Bandgap evolution of Mg3N2 under pressure:Experimental and theoretical studies
2022-06-29GangWu吴刚LuWang王璐KuoBao包括XianliLi李贤丽ShengWang王升andChunhongXu徐春红
Gang Wu(吴刚) Lu Wang(王璐) Kuo Bao(包括) Xianli Li(李贤丽)Sheng Wang(王升) and Chunhong Xu(徐春红)
1School of Physics and Electronic Engineering,Northeast Petroleum University,Daqing 163318,China
2State Key Laboratory of Superhard Materials,College of Physics,Jilin University,Changchun 130012,China
3Institute of Unconventional Oil&Gas,Northeast Petroleum University,Daqing 163318,China
Keywords: high pressure,electronic structures,first-principles calculations,alkaline-earth metal nitride
In the search for novel functional materials, the multifaceted family of metal nitride compounds exhibiting diverse properties is widely studied as a model system.Binary nitrides with large bandgap,such as AlN and GaN,have long been employed as high-performance semiconductor materials.[1]By modulating the distances between atoms,pressure would have a significant impact on the character of the materials. In some cases, new phase with unique properties would form under high pressure condition.[2,3]Obviously, research on the high pressure behaviors of semiconductors is of great significance to clarify the regulatory mechanism of material properties.
There have been several investigations into the high pressure structure of Mg3N2. Under pressure, R¨omer predicted that the ambientIa-3 structure would transform intoC2/mstructure andP3m1 structure in order.[4]This phase sequence was largely validated by Haoet al.,who discovered theC2/mphase by synchrotron x-ray differaction(XRD)from 20.6 GPa to 40 GPa, and anticipated the formation of theP3m1 structure at 67 GPa.[5]As can be seen, there is little disagreement about the high pressure structure of Mg3N2. Furthermore,the electronic and optical properties of Mg3N2have been aroused considerable attention because of its prospective application in phosphor-converted light emitting diodes (pc-LEDs), as a visible-light-activated luminescent material.[6,7]In particular,Mg3N2was suggested to be an promising alternative to AlN and Ga1Al1-nN in optoelectronics.[8]It is generally believed that Mg3N2has a direct bandgap structure.However,the computational data present largely different values of the bandgap,ranging from 1.10 eV to 2.25 eV.[9–11]
In addition, the bandgap of Mg3N2was predicted to increase under pressure,different from the cognition that the energy band is usually widened under high pressure, accompanied by a reducing of gap value.[12]Unfortunately, only rare research on this phenomenon has been reported so far. The lack of systematic investigations hampers our understanding of the corresponding mechanism. Further investigations are needed to clarify the mechanism of pressure on the bandgap of magnesium nitride.
Moreover, nitrogen-rich compounds with low bond order N–N bonds are generally considered to be potential high energy density materials(HEDM).[13,14]Alkaline earth metal nitrogen-rich compounds have made breakthrough progress as an HDEM candidate.[15,16]Several nitrides with unconventional chemical stoichiometry have been synthesized experimentally, such as Mg2N4with an N4unit and MgN4with a one-dimensional (1D) N chain.[17]But the theoretically predicted MgN10with an N5ring, which was supposed to possess a higher energy density, has not yet been obtained experimentally.[18]The interaction between Mg and N atoms plays a critical role in the evolution of nitrogen configurations and related structures at high pressures. However, the mechanism of interatomic interaction in the ambient phase is not clear, and further research into this interaction is needed to provide theoretical guidance for the subsequent synthesis of nitrogen-rich nitrides.
In the present study, Raman spectra and ultra-violetvisible(UV-Vis)absorption spectra,were conducted to investigate the high pressure behavior of Mg3N2up to 50 GPa.The increasing bandgap of Mg3N2with elevated pressure was first observed experimentally. Theoretical calculations such as band structures, density of states (DOS), and differential charge density were combined to clarify the evolution of the bandgap and the interaction between atoms under high pressure.
2. Experimental and computational methods
The experiment employed A diamond anvil cell (DAC)with 300-μm culet faces to generate high pressures up to 50 GPa. A tungsten gasket pre-compressed to around 40 μm was placed between the two diamond anvils, and a laser was used to drill a hole with a diameter of 12 μm in the middle of the gasket that served as the sample chamber in the DAC.A moisture-sensitive lump of Mg3N2(Alfa Aesar, 99.5%) of approximate size 40 μm×50 μm was placed into the sample chamber in an argon-atmosphere glove box, whereupon silicone grease served as the pressure transmitting medium and was sealed in the DAC. The pressure in the sample chamber was determined by the frequency shift of the R1line of the Ruby ball.[19]
The high pressure Raman experiment was performed using a JY-T64000 spectrometer with a nitrogen-cooled CCD detector and a 532-nm laser generated by a doubled solid-state diode Nd:yanadate laser (Coherent Company). The UV-Vis absorption spectra were measured by the optics of Ocean Optics QE65000 in conjunction with a deuterium–halogen light source with a wavelength range of 350 nm to 2000 nm.
The density functional theory, as implemented in the CASTEP code, was used to perform first-principles computations.[20]To determine precise exchange and correlation energies for a particular structural arrangement, the generalized-gradient approximation (GGA) with Perdew–Burke–Ernzerh (PBE) functional was utilized.[21]Normconserving pseudo-potentials for N and Mg were used to explain the atomic electrical configuration. The 2s22p3and 2p63s2electrons were considered as the valence electrons for N and Mg,respectively. The geometry optimization and properties computation, including band structure, DOS, and differential charge density, were performed using a plane-wave cutoff energy of 1000 eV and ak-point spacing of 0.04 °A-1derived from a convergence test. All of the calculations adopted the same self-consistent energy convergence criteria of 1×10⁻⁵eV/atom.
2.1. Results and discussion
2.2. Raman experiments and calculations
According to the group theory analysis, the irreducible representations of optical modes in theIa-3 structure can be written as:Γ=9A+9E+30T, in whichA,E, andTrepresent the nondegenerate, double degenerate, and triply degenerate vibration modes respectively. Four of theAmodes are Raman-active,and in the case ofEmodes andTmodes,it is 4 and 14,respectively.
As shown in Fig. 1, Raman spectra of theIa-3 structure at 0 GPa was calculated with the CASTEP code to assign the relative vibration mode. Only some of the calculated peaks have relatively strong peak strengths(2Amodes,3Emodes,and 8Tmodes), whose vibration mode is marked below the corresponding peak. The strongest peak (ν5) is assigned to the symmetrical stretching vibration of Mg and N. By comparing the Raman spectra measured at 2.2 GPa,it is found that most of the calculated Raman peaks are observed experimentally, except for small differences in the relative intensity of some weak peaks, which indicates an excellent coincident is achieved between the calculated spectra and experimental results. In addition,the observed Raman spectra at 2.2 GPa are quite close to the previous results,[22]guaranteeing the purity of the Mg2N3sample.
Due to the sensitivity of vibration frequency to atomic coordinates,Raman spectroscopy is an effective probe to detect the local and cooperative changes in structure under pressure.In this study,in-situRaman spectra have been conducted on Mg3N2up to 43.5 GPa. As shown in Fig. 2, all the peaks move towards high frequency approximately linearly,indicating a general decrease in the atomic distance under pressure.All of the Raman peaks soften and broaden obviously as pressure increases,and some weak peaks at 2.2 GPa(such asν8–ν10andν12)vanish completely at 5 GPa.
A shoulder peak emerges near 413 cm-1(indicated by the arrow in Fig.2)without any other obvious change. According to the calculation results, this peak is assigned to a triply degenerated mode, which is overlapped by the most intenseν5mode. The strongest peak(ν5)persists till 25 GPa,after which no signal can be observed until 43.5 GPa. This might indicate a total phase transition to a new phase with a relatively weak Raman signal. It should be emphasized that the weakening ofν5peak starts from 17 GPa, which is very similar to the first order phase transition in Mg3N2at 20 GPa in previous high pressure diffraction research.[5]The Raman signal of theIa-3 structure reappears as pressure is released to 2.4 GPa.

2.3. UV-Vis absorption experiments
As shown in Fig. 3, the color of Mg3N2changes from deep yellow (3 GPa) to light yellow (47 GPa). In general,a more transparent sample corresponds to a larger bandgap.From the trend of the color changes under pressure, we can preliminarily infer that the bandgap of the sample increases.In the optical absorption experiments,more detailed information about the bandgap can be obtained. The absorption edge distributes from 460 nm to 530 nm at 3 GPa,which is related to the energy threshold of photons allowed to be absorbed.Accompanied by the color change of Mg3N2changes,the absorption edge shows a blueshift trend under pressure,indicating an increase in the minimum energy required in inter-band transition.
According to the Tauc plot method, in the case of direct bandgap, a series plots of (αhν)2versusphoton energyhνwere obtained based on the absorption spectra under every pressure,known as the Tauc plot.[23,24]The estimated bandgap can be obtained from the intercept of a linear region extrapolation on the energy axis.The evolution of the bandgap is shown in Fig. 5(d). The bandgap value increases from 2.05 eV at 3 GPa to 2.88 eV at 51.9 GPa.There is a change in the increasing ratio of bandgap value to the pressure at nearly 25 GPa,which is very similar to the pressure at which vibration peaks of Mg3N2disappear thoroughly in our Raman measurement.This might be regarded as another manifestation of theIa-3 toC2/mphase transition reported in the previous study.
Thus, the bandgap of Mg3N2widening under pressure is first observed in UV-Vis absorption experiments. Pressure clearly has a strong ability to tune the bandgap of Mg3N2,which would make Mg3N2more suitable for wide bandgap applications.

2.4. Electronic structures calculations
To further investigate the bandgap evolution, the electronic band structure and projected density of states (PDOS)forIa-3 andC2/mstructures were also calculated. As presented in Fig.4,both theIa-3 andC2/mstructures possess the direct type bandgap,which widens with elevated pressure.The gap value of theIa-3 structure varies from 1.27 eV(0 GPa)to 1.96 eV (20 GPa), and for theC2/mstructure from 1.95 eV(20 GPa)to 2.79 eV(50 GPa). These values are similar with the previous results calculated by VASP(1.6 eV forIa-3 phase at ambient condition and 2.3 eV forC2/mphase at 25 GPa).However, these values are rough estimates, as the standard exchange correlation functionals of DFT,such as generalized gradient approximation(GGA),underestimate the gap values.Thus,for the analysis of bandgap evolution trends,our calculation results could still provide relative accuracy qualitatively.
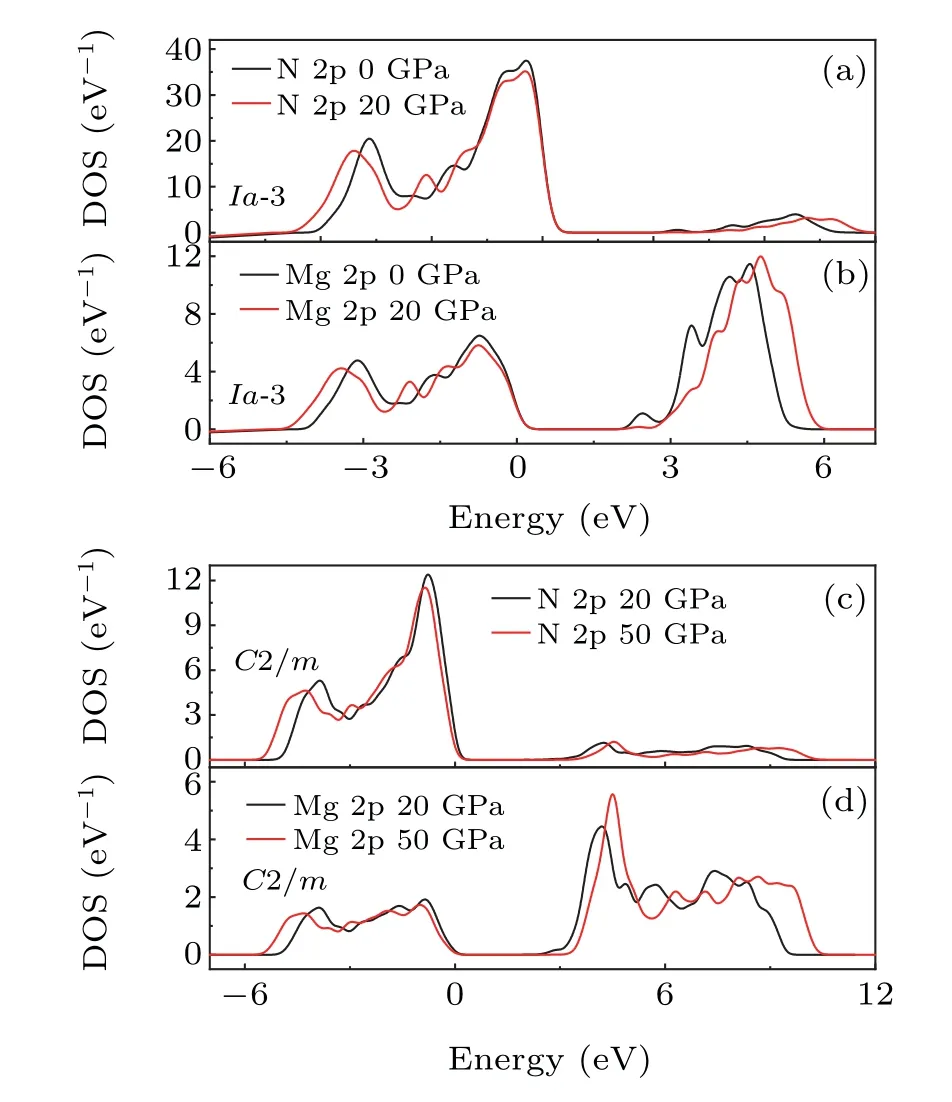
The PDOS of theIa-3 and theC2/mstructures are also shown in Fig. 4. The valance band is dominated by Mg 2p orbitals,and the conduction band is mainly attributed to N 2p orbitals. The dissimilarities in the strong peak positions in the PDOS of Mg with N,indicate the mainly ionic interaction of Mg with its neighboring N,which is consistent with a differential in atomic electronegativity of up to 1.8. However, a very small chemical bond can also be seen,because of the partially overlapped PDOS of Mg and N.Therefore,the bonding in Mg3N2can be regarded as a mixture of mainly ionic and minorly covalent components.

As pressure increases, the valence band expands toward the lower energy,and the conduction band widens toward the higher energy, which is mainly induced by the compression of the lattice and the consequent shortening of the bond under pressure. By comparing the PDOS of specified orbitals under different pressures(Fig.5),it is found that the PDOS of N 2p softens obviously, indicating the delocalization of electrons.However, the PDOS peak value of Mg 2p in the conduction band increases under pressure both in theIa-3 and theC2/mstructure, indicating an enhanced localization of electrons in Mg. This is equivalent to the weakening of the tendency of magnesium to lose electrons and form ionic bonds, in other words,the increasing electronegativity of Mg under high pressure. Combined with the change of nitrogen PDOS, the ionicity of Mg–N bonds decreases under pressure,instead of the enhanced covalent properties.
Looking at the differential charge density in some selected planes is also an efficient way to understand the bond property of Mg3N2.The differential charge density is obtained by subtracting the spherically symmetric charge density of Mg and N in the free state from the charge density of Mg3N2.In theIa-3 structure, the plane across the central N and four neighboring Mg is selected to project the differential charge density. And in theC2/mstructure, the (1 0 0) plane is selected. As presented in Fig.6,positive values(colored in red)indicate gaining electrons, which are mainly distributed near N atom. This is in accordance with the ionic properties of the Mg–N bond. As pressure increases,the electrons obtained by the N atom tend to be distributed toward its neighboring Mg atom. This is in good agreement with the enhanced covalent bond found in our PDOS analysis.
The increasing covalent component is considered to be responsible for the widening of the bandgap.[25–28]The evolution of the Mg3N2bandgap should take into account two effects: on one hand, the shortened atomic distances under pressure induce widening of both the valence band and the conduction band, which tend to reduce the bandgap. On the other hand,the shortened bond length increases the overlap of the electron cloud,accompanying with the enhanced covalent bond,which tends to widen the bandgap. The competition of these two effects results in the increasing bandgap of Mg3N2under pressure.

3. Conclusion
In summary, we have conducted a systemic study of the high pressure behaviors of Mg3N2up to 50 GPa. The pressure induced bandgap widening is observed experimentally for the first time. The bandgap increasing ratio changes at 25 GPa,which is in good agreement with both our Raman results and previous phase transition research. The calculated electronic structures present the increasing bandgap as well. The PDOS shows a localization of the Mg 2p electron, thereby inducing an enhanced covalent character in the Mg–N bond, which is responsible for the increasing bandgap. The present work will be helpful for understanding the atomic interaction in alkaline earth metal nitride and designing nitrogen-based semiconductors with unique properties.
Acknowledgments
Project supported by the Open Project of State Key Laboratory of Superhard Materials, Jilin University (Grant No. 202102) and Young Science Foundation of Northeast Petroleum University(Grant No.2018QNL-53).
猜你喜欢
杂志排行

Chinese Physics B的其它文章
- Ergodic stationary distribution of a stochastic rumor propagation model with general incidence function
- Most probable transition paths in eutrophicated lake ecosystem under Gaussian white noise and periodic force
- Local sum uncertainty relations for angular momentum operators of bipartite permutation symmetric systems
- Quantum algorithm for neighborhood preserving embedding
- Vortex chains induced by anisotropic spin–orbit coupling and magnetic field in spin-2 Bose–Einstein condensates
- Short-wave infrared continuous-variable quantum key distribution over satellite-to-submarine channels