A systematic study on mycochemical profiles, antioxidant, and anti-inflammatory activities of 30 varieties of Jew’s ear (Auricularia auricula-judae)
2022-06-20ThidulIslmFngjieYoWenyiKngLixinLuBojunXu
Thidul Islm, Fngjie Yo*, Wenyi Kng, Lixin Lu Bojun Xu*
a College of Horticulture, Jilin Agricultural University, Changchun 130118, China
b Food Science and Technology Program, BNU-HKBU United International College, Zhuhai 519087, China
c National R & D Center for Edible Fungus Processing Technology, Henan University, Kaifeng 475004, China
Keywords:
Auricularia auricula-judae
Phenolic compounds
Antioxidant properties
Chemical composition
Anti-inflammation
High performance liquid chromatography
A B S T R A C T
The health-promoting properties and chemical profiles of 30 Jew’s ear mushroom varieties were investigated. The antioxidant properties were determined by ferric reducing antioxidant power (FRAP),1,1-diphenyl-2-picrylhydrazyl (DPPH) free radical scavenging, 2,2’-azino-bis-(3-ethylbenzothiazoline-6-sulfonic acid) (ABTS) free radical scavenging, and metal chelating ability (MCA) assays, while phenolic profiles were determined by total phenol content (TPC) and total flavonoid content (TFC) colorimetric assays. Total carbohydrate, β-glucan, and melanin contents were determined by colorimetric methods.5’-Nucleotides, vitamin D2, ergosterol, and ergothioneine contents were determined by high performance liquid chromatography (HPLC). Anti-inflammation activities of Jew’s ear were evaluated by the colorimetric protease inhibitory method. The results showed that Jew’s ear mushrooms possessed substantial phenolics and antioxidant properties. All the Jew’s ear varieties contain high amount of total carbohydrate, β-glucan,reducing sugar, melanin, pectin, vitamin D2, ergosterol, and ergothioneine. The current findings could provide scientific information for breeders to nurture desired varieties and for food industry to develop new health promoting products.
1. Introduction
Auricularia auricula-judae, also known as black fungi, wood ear, Jew’s ear, and jelly ear, belongs to the family of Auriculariaceae.TheseAuriculariaare an important genus among edible macrofungi of wild or cultivated mushrooms because of their high nutrient content and pharmacological properties [1].A. auricula-judaehas a long historical tradition for the application of health promoting purpose [2], also included in Asian cuisine especially in China,and widely popular because of its crispy texture and trifling flavor to make them a great addition into soups, stir-fries, and salads.A. auricula-judaeis the 4thmost popular cultivated edible mushroom in the world [3], it contains amino acids, carbohydrates, vitamins,and trace elements with composed of various health promoting compounds such as polysaccharides, melanin, polyphenols, and flavonoids [4]. Antioxidants are important compounds to control the progressive diseases in which formatted by oxidative damages [5].A. auricula-judaeplays a significant role as antioxidant activities in the scavenging of free radicals to protect from various diseases [6],and it also has multiple biological functions such as anticoagulant [7],and antitumor activity [8]. It has been reported that edible and medicinal mushrooms including Jew’s ear have large number of chemical compositions that possess antioxidant properties and play a significant role in preventing and treating chronic diseases [9]. Jew’s ear has been documented in Chinese medicinal books because of their numerous medicinal properties. However, there is a lack of study to compare antioxidants and bioactive compositions among the various varieties of Jew’s ear.
In National Research Center of Edible and Medicinal Mushroom locates in Jilin Agricultural University in China, 30 varieties of Jew’s ear have been collected and/or bred. The 30 varieties of Jew’s ear have different fruiting body yield, carry abundant genetic nature, and demonstrate diverse morphological properties. However, there are no scientific data available to demonstrate if diverse varieties of Jew’s ears have different myochemical profiles and different performance in bioactivities. Thus, the current study aimed to systematically analyze the phenolic, antioxidant, and other health-promoting mycochemical profiles of 30 Jew’s ear varieties. The objective of this study was to know 30 Jew’s ear varieties phenolic profile through assessing total phenol content (TPC), total flavonoid content (TFC), and for antioxidant capacities through assessing ferric reducing antioxidant power (FRAP), 1,1-diphenyl-2-picrylhydrazyl (DPPH) free radical scavenging, 2,2’-azino-bis-(3-ethylbenzothiazoline-6-sulfonic acid)(ABTS) free radical scavenging, and metal chelating ability (MCA).Various assays were done to estimate total carbohydrate,β-glucan,reducing sugar, melanin, color properties, pectin, vitamin D2,ergosterol, ergothioneine, and 5’-nucleotides content. In addition,in vitroprotease inhibitory assay was conducted to determine t the anti-inflammation activities of these 30 Jew’s ear varieties.
2. Materials and methods
2.1 Jew’s ear sample collection and preparation
Dry fruiting bodies sample of 30 Jew’s ear varieties were collected from Jilin Agricultural University, Changchun, China. The germplasm resources (Table 1) of fungi are preserved in Institute of Horticulture, Jilin Agricultural University, Changchun, China.Morphological features of 30 Jew’s ear are presented in Fig. 1. Prior to chemical and biological analyses, all samples were dried thoroughly and ground into powder. During milling, all the steps were conducted carefully to avoid any cross-contamination. Ground Jew’s ear samples were transferred into small containers and stored in a cool place. The moisture content was determined by Sartorius moisture analyzer MA-150(Sartorius Weighing Technology GmbH, Goettingen, Germany). The moisture contents of Jew’s ear samples were presented in Table 2.
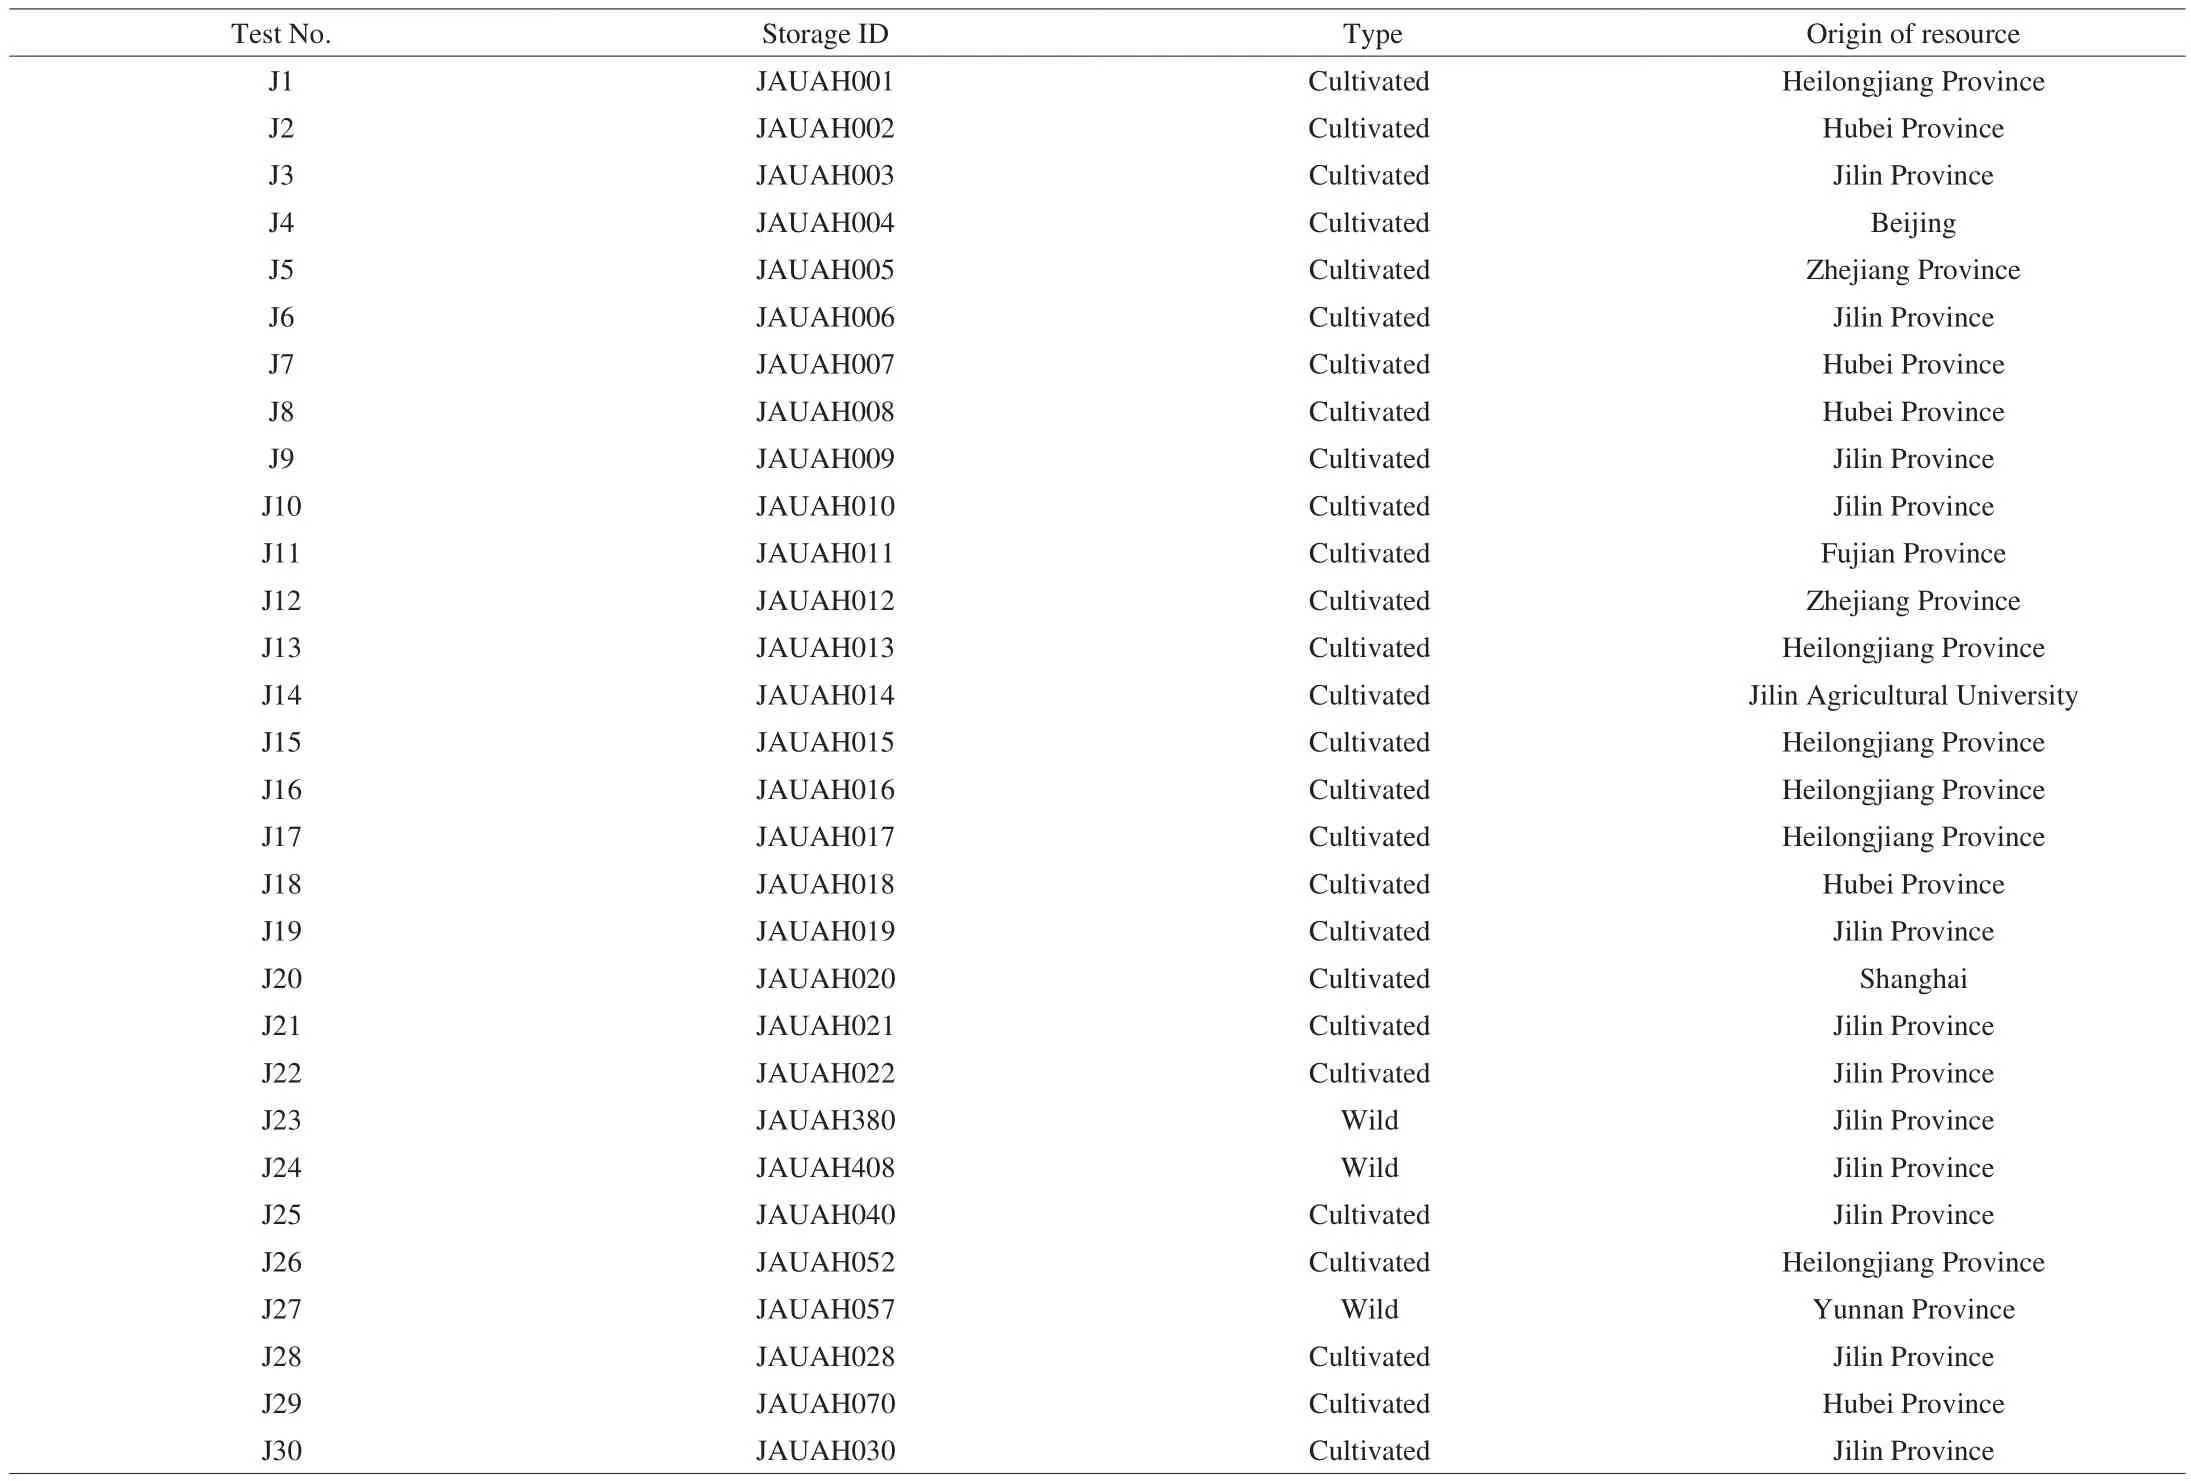
Table 1Strain names and origins of germplasm of the preserved fungi A. auricular.
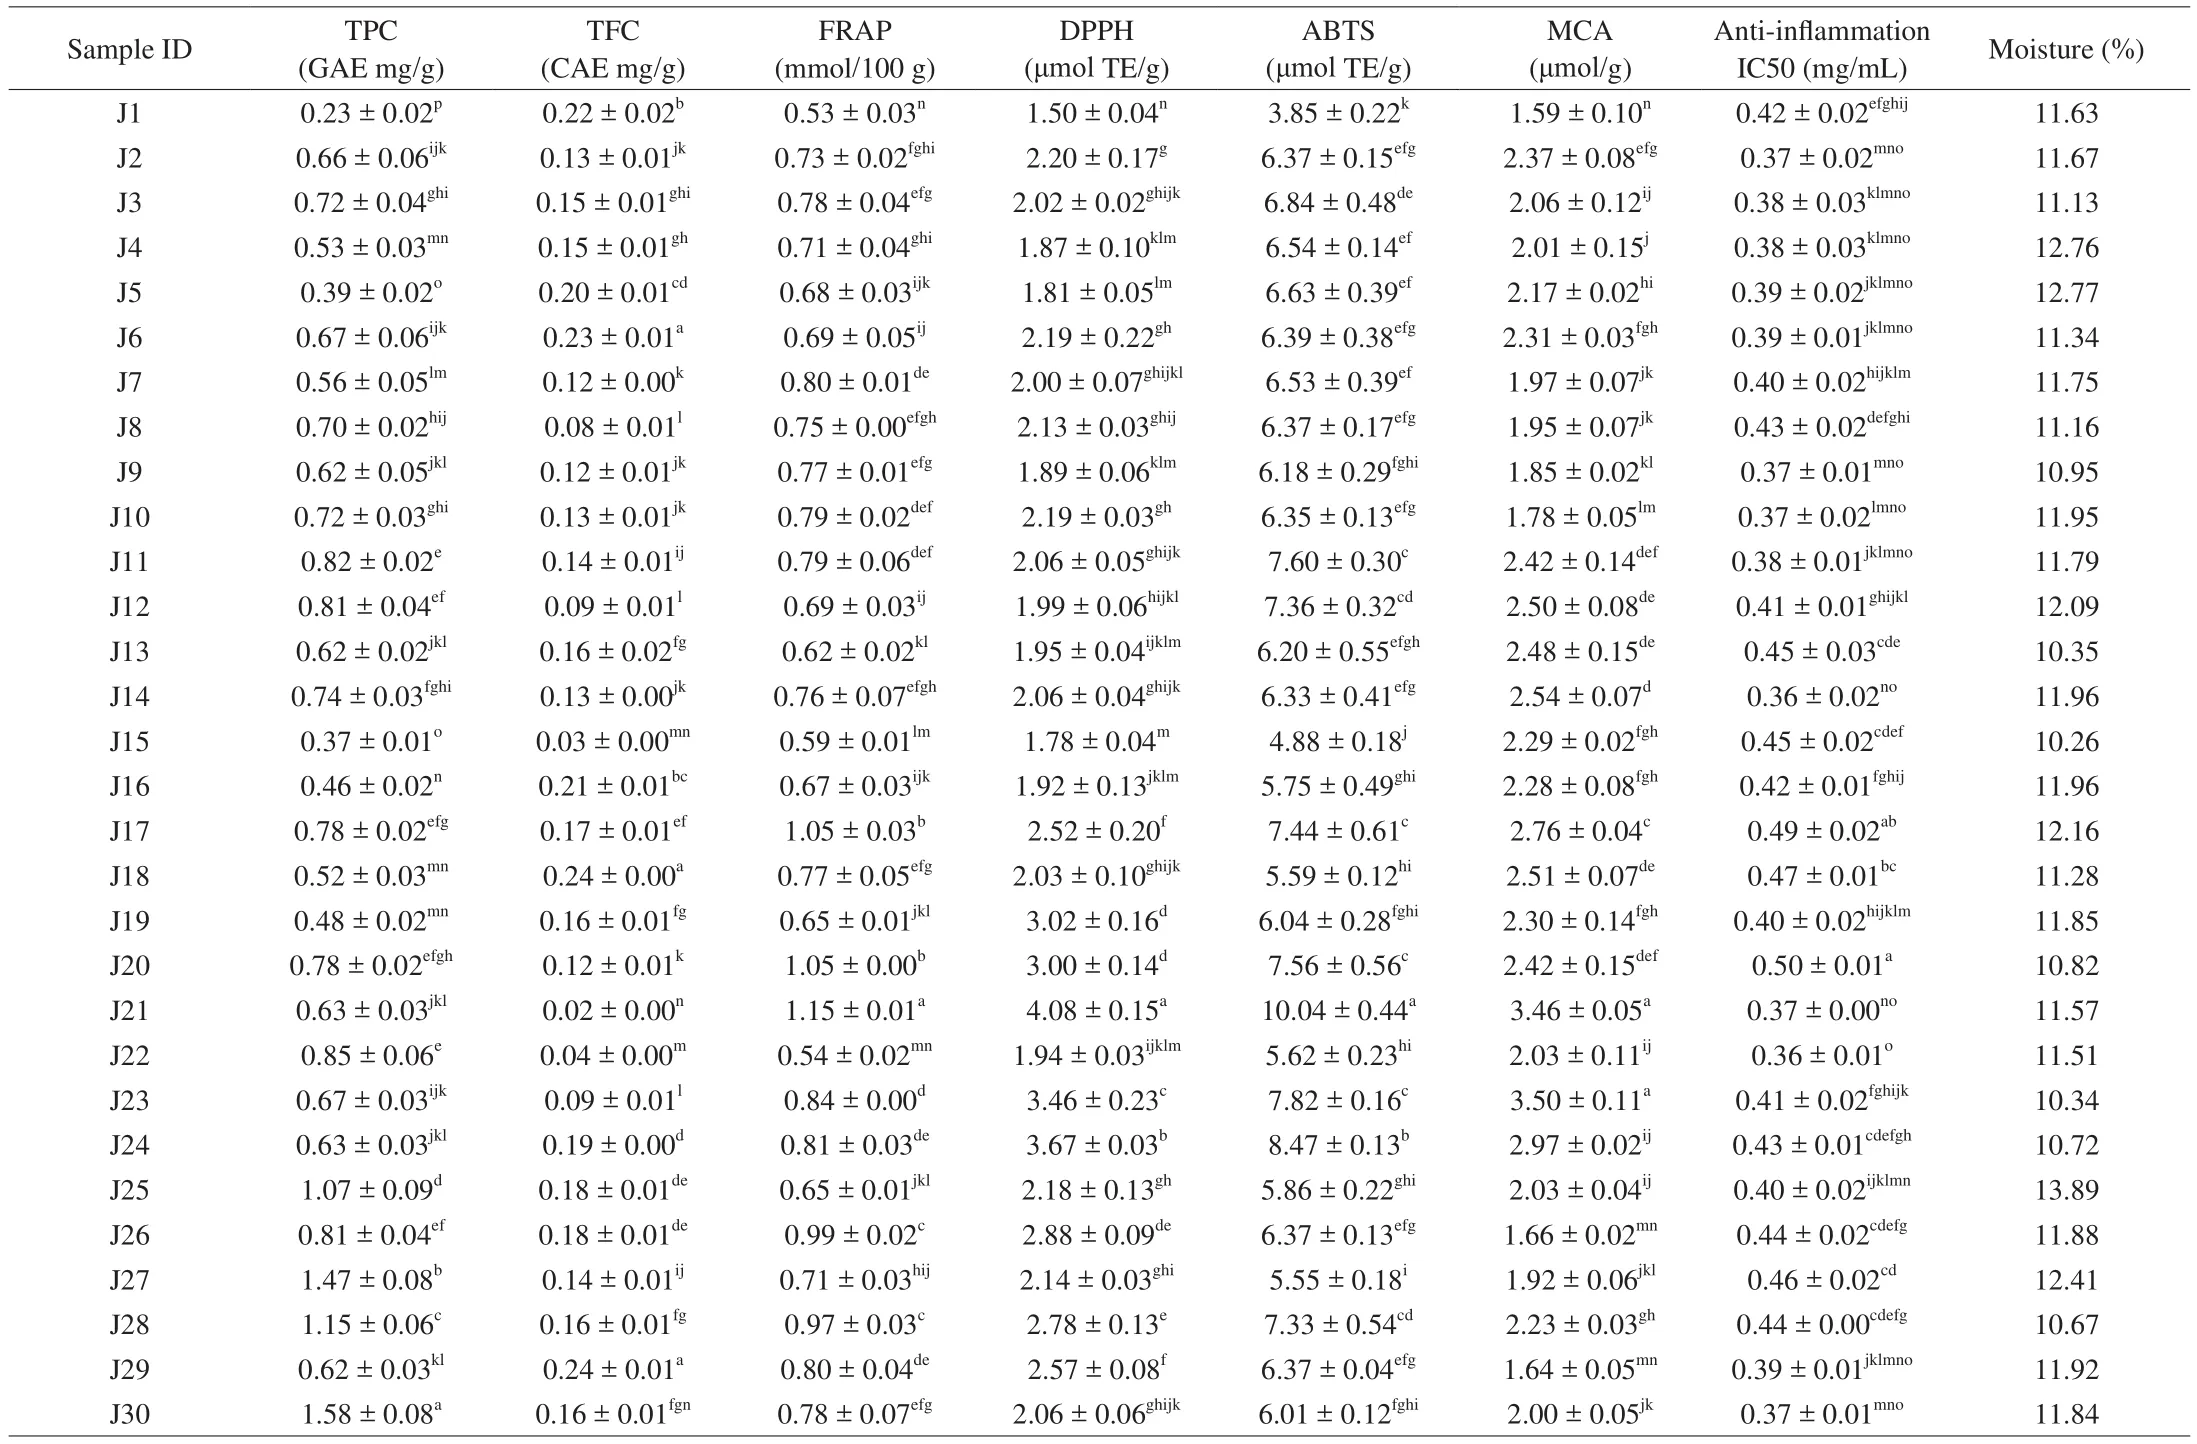
Table 2Phenolics (TPC and TFC), antioxidant capacities (FRAP, DPPH, ABTS, and MCA), anti-inflammation IC50, and moisture content of Jew’s ear mushrooms.
2.2 Chemicals and reagents
Acetone, acetic acid, methanol (analytical grade), Folin-Ciocalteu reagent, sodium carbonate, gallic acid, sodium hydroxide (NaOH),sodium nitrite (NaNO2), FeCl2·4H2O, ferrozine, AlCl3·6H2O,(+)-catechin, DPPH, absolute ethanol (analytical grade), 6-hydroxy-2,5,7,8-tetramethlchroman-2-carboxylic acid (Trolox), sodium acetate·3H2O, butylated hydroxytoluene (BHT), trifluoroacetic acid (TFA), ABTS, potassium persulfate, glacial acetic acid,2,4,6-tri(2-pyridyl)-s-triazine (TPTZ), ferric chloride (FeCl3·6H2O),ethylenediaminetetraacetic acid (EDTA-2Na), ferrous sulfate(FeSO4·7H2O), acetonitrile (HPLC grade), methanol (HPLC grade),3,5-dinitrosalicylic acid (DNS), glucose, potassium sodium tartrate (KNaC4H4O6), phenol, sodium sul fite (Na2SO3), potassium dihydrogen phosphate (KH2PO4), dipotassium phosphate (K2HPO4), cytosine,cytidine, uridine, adenine, guanosine, melanin, ergothioneine,vitamin D2, and ergosterol (standard HPLC grade) were purchased from Sigma-Aldrich Co. (Shanghai, China). Dithiothreitol, betaine,2-mercapto-1-methyl imidazole, sodium dodecyl sulfate (SDS),triethylamine (TEA), sodium dihydrogen phosphate, sulfuric acid,hydrochloric acid, solid sodium carbonate, and other remaining chemicals and reagents were supplied by Tianjin Damao Chemical Reagent Co., Ltd. (Tianjin, China). All chemicals were of analytical grade unless specially mentioned.
2.3 Sample preparation for antioxidant and antiinflammation analysis
Jew’s ear samples were extracted by following the procedure of Xu et al. [10], with slight modifications. Briefly, 0.5 g of dry powder of each sample (in triplicate) in total 30 Jew’s ear samples were transferred into 15 mL centrifugal tubes and 5 mL of extraction solvent acetone/ water/ acetic acid (70.0 : 29.5 : 0.5) was added in each tube. All the tubes were placed in an orbital shaker for 3 h at 300 r/min in a dark environment, then kept them in the dark for 12 h.The tubes were then centrifuged at 3 000 r/min for 10 min and all the supernatants were transferred into another new batch of 15 mL tubes afterwards. Then another 5 mL of extraction solution was added to the same 0.5 g sample tubes again by repeating the steps mentioned above. Total two times extract were combined in 15 mL tubes and the final volume was recorded. The extracts were stored in a dark environment at 4 °C for further analysis.
2.4 Determination of TPC
TPC was determined using the colorimetric method described by Xu et al. [10]. Briefly, 50 μL sample solution was mixed with 250 μL Folin-Ciocalteu phenol reagent and stood for 5 min to react with phenol compounds of the sample. Later, 750 μL of 7% Na2CO3was added and stood for another 5 min. Finally, 950 μL of distilled water was added and mixed them properly. It was left in the dark at room temperature for 1 h, then the absorbance was measured at 765 nm against of blank by using UV-visible spectrophotometer. The TPC was expressed as gallic acid equivalents (mg GAE/g sample) in accordance to the external standard calibration curve of the gallic acid in a linearity range of 25–1 000 μg/mL (R2> 0.99).
2.5 Determination of TFC
Xu et al. [10]designated colorimetric method was used to determine the TFC in Jew’s ear. Brie fly, 250 μL of sample extract was mixed with 1.25 mL of distilled water, then 75 μL of 5% NaNO2was added into each tube and mixed them properly with vortex mixture. After 6 min,150 μL of 10% AlCl3·6H2O solution was added and stand for 5 min before 500 μL of 1 mol/L NaOH solution was added into each tube.The solution was mixed properly with vortex mixture, then 275 μL distilled water was added and again mixed them well. The absorbance was measured by the UV-visible spectrophotometer at 510 nm. The TFC was expressed as catechin equivalents (mg CAE/g sample)of the external standard calibration curve of catechin in a linearity range from 10 μg/mL to 1 000 μg/mL (R2> 0.99).
2.6 Determination of FRAP
FRAP was also determined using a colorimetric method described by Xu et al. [10]. Briefly, 100 μL sample extract was transferred into 15 mL centrifugal tube and hold them in 37 °C water bath, then 3 mL of 37 °C warm FRAP reagent and 300 μL distilled water were added into each tube. The combined solutions were mixed with vortex mixture and stood for 4 min, then the solution absorbance was measured by the UV-visible spectrophotometer at 593 nm against of blank. The FRAP value was expressed as mmol of Fe2+equivalents per 100 g of the sample (mmol/100 g sample) according to the external standard calibration curve of Fe2+in a linearity range from 0.1 mmol/L to 1.00 mmol/L (R2> 0.99).
2.7 Determination of DPPH free radical scavenging capacity
DPPH was determined using the colorimetric method described by Xu et al. [10]. Brie fly, 0.2 mL of sample extract was mixed with 3.8 mL of 0.1 mmol/L DPPH solution. All the tubes were mixed evenly with vortex mixture and stood at room temperature in dark for 30 min. The UV-visible spectrophotometer was used to measure the absorbance at 517 nm against of blank. The DPPH was expressed as Trolox equivalents (μmol TE/g sample) according to the external standard calibration curve of Trolox in a linear range from 100 μmol/L to 750 μmol/L (R2> 0.99).
2.8 Determination of ABTS radical scavenging ability
ABTS was determined using the colorimetric method described by Miller et al. [11]. ABTS+stock solution was prepared accordingly; 3.6 g (7 mmol/L) ABTS and 0.662 3 g (2.45 mmol/L)potassium persulphate were dissolved with distilled water in an amber bottle and incubated in dark at room temperature for about 16 h to generate ABTS radical cation. This stock solution was taken to dilute with ethanol, and the absorbance of 0.70 ± 0.02 at 734 nm was obtained to use as a working solution. Afterwards,20 μL of sample extract was mixed with 1 mL ABTS working solution and incubated them for 6 min at 30 °C in dark. The absorbance was measured by the UV-visible spectrophotometer at 734 nm at 30 °C against of blank. The ABTS inhibition was expressed as Trolox equivalents (μmol TE/g sample) in accordance with the external standard calibration curve of Trolox in a linearity range from 50 μmol/L to 1 000 μmol/L (R2> 0.99).
2.9 Determination of MCA
MCA of Jew’s ear was determined using the colorimetric method described by Dinis et al. [12], with slight modifications.Brie fly, 50 μL of sample extract was mixed with 50 μL FeCl2.4H2O(2.00 mmol/L), 200 μL ferrozine (5 mmol/L), and 1.2 mL of 70% acetone extract solvent and bring the final volume of 1.5 mL. The absorbance was measured by the UV-visible spectrophotometer at 562 nm against of blank. The MCA was expressed as EDTA-2Na equivalents (μmol/g sample) to the external standard calibration curve of EDTA-2Na in a linearity range from 0.05 mmol/L to 1.75 mmol/L (R2> 0.99).
2.10 Determination of total carbohydrate content
The total carbohydrate from Jew’s ear was determined by the phenol-sulphuric acid method with slight modifications. Briefly,100 mg of each Jew’s ear powder samples were mixed with 5 mL of 2.5 N-HCl in 15 mL boiling tubes. All the tubes were incubated in a boiling water bath for 3 h to hydrolyze, then were cooled down at room temperature. The hydrolyzed solution was neutralized with solid sodium carbonate, then was transferred in 100 mL volumetric flask, and filled with distilled water. The solution was centrifuged to collect the supernatant. Accurately, 1 mL of supernatant was mixed with 0.5 mL 6% phenol and 2.5 mL sulphuric acid. After 30 min, the solution was mixed again, and the absorbance was measured by the UV-visible spectrophotometer at 490 nm against the reagent blank.The total carbohydrate content was expressed as glucose equivalents in accordance with the external standard calibration curve of glucose in a linearity range from 10 μg/mL to 100 μg/mL (R2> 0.99).
2.11 Determination of β-glucan content
Theβ-glucan content of Jew’s ear was performed by determining the total glucan andα-glucan using mushroomβ-glucan assay kit K-YBGL 12/16 (Megazyme Int, Co., Wicklow, Ireland) according to the manufacturer procedure. The total glucan andα-glucan absorbance were measured by UV-spectrophotometer at 510 nm against the reagent blank. Theα-glucan was subtracted from the total glucan content to obtain the amount ofβ-glucan content.
2.12 Determination of total reducing sugar
Total reducing sugar was determined according to the procedure of Yin et al. [13], with minor modifications. Brie fly, 100 mg of Jew’s ear powder was extracted with 80% ethanol twice (each time 5 mL)in a boiling water bath for 30 min. The supernatant was collected by centrifugation at 10 000 r/min for 10 min, and the organic solvent was evaporated by vacuum oven dryer at 45 °C. The extracted dry sugar was dissolved with 10 mL of distilled water. Then 1.0 mL of sample sugar solution was mixed with 2.0 mL of DNS reagent solution and placed in a boiling water bath for 5 min. All the tubes were cooled down thoroughly by immersing them into cold water immediately. Finally, 7.0 mL of distilled water was added into each tube. The optical density of the solution was measured by UV-visible spectrophotometer at 540 nm. The total reducing sugar was expressed as glucose equivalents (mg/g sample) to the external standard calibration curve of glucose in a linearity range from 50 μg/mL to 350 μg/mL (R2> 0.99).
2.13 Determination of melanin content
The extraction of melanin from Jew’s ear was performed according to the procedure of [14]with slight modifications, and the quantification of melanin was carried out according to the method of Santos et al. [15]. The dry melanin extract was dissolved in 0.01 mol/L NaOH and the densities of the melanin-containing solutions were determined by UV-spectrophotometer at 400 nm. The spectra were measured between 200 nm to 800 nm to compare the sample and standard spectra peak according to the description of Lopusiewicz et al. [16].The synthetic melanin external standard calibration curve was used in a linearity range from 5 μg/mL to 80 μg/mL (R2> 0.99).
2.14 Determination of pectin content
The total pectin content of Jew’s ear was determined gravimetrically using the method described by Donchenko [17],with slight changes. Briefly, 1.00 g of Jew’s ear powder sample was extracted with 20 mL of 1% ammonium oxalate solution for overnight, then was filtered by vacuum filtration to collect the extract liquid. The equal amount of absolute ethanol was added into the extracted liquid to precipitate the pectin. Afterward, it was centrifuged at 8 000 r/min for 10 min, then the pectin was collected and placed in a vacuum oven dryer at 45 °C. The dry pectin was weighed, and the percentage of pectin was calculated according to the actual and dry weight basis.
2.15 Determination of 5’-nucleotides content
For the extraction of 5’-nucleotides compounds, 1.00 g of Jew’s ear powder was mixed 15 mL distilled water in 50 mL centrifugal tube, then was extracted by ultra-sonication (250 W, 40 kHz) for 1 h. The extract liquid was collected after centrifugation, and the supernatant was transferred by 0.22 μm nylon filter into 2 mL of 9 mm screw thread vials. Determination of nucleotides were performed by high-performance liquid chromatography (HPLC) according to the description of Ranogajec et al. [18]with minor modifications.The sample (20 μL) was injected to the HPLC system (Alliance System, Germany) with an UV-DAD detector (Alliance 1200 Series,Germany) and the compounds were separated by using C18column(YMC-Pack ODS-AM-303, 4.6 mm × 150 mm, 5 μm; Agilent Technologies, Wilmington, DE, USA). The mobile phases were A:50 mmol/L phosphate buffer (pH 5.8) and B: methanol at a flow rate of 0.4 mL/min. The gradient program was used as follows: The mobile phase (A:B) at 0–3 min was 60 : 40; 3–12 min was 100 : 0; and 16–22 min was 60 : 40. Determination and quantification of 5’-nucleotides were performed at 254 nm at 20 °C. The 5’-nucleotides content in Jew’s ear were expressed as μg/g in accordance with the external standard calibration curve of cytosine, cytidine, uridine,adenine, and guanosine in a linearity range from 10 μg/mL to 100 μg/mL (R2> 0.99).
2.16 Determination of vitamin D2 and ergosterol content by HPLC
Vitamin D2and ergosterol content of Jew’s ear were determined using the HPLC method described by Jasinghe et al. [19]. Brie fly, 1.00 g of Jew’s ear powder was transferred into 250 mL conical flask, then 4 mL of sodium ascorbate solution, 50 mL of 95 % ethanol, and 10 mL of 50 % potassium hydroxide solution were added to the samplecontaining conical flask. The conical flask was heated at 80 °C for 1 h.After cooling down, the mixture was filtered, and filtrated solution was transferred to the separatory funnel. The solution was extracted with 15 mL deionized water, 15 mL ethanol, and 40 mLn-pentane 3 times successively. The organic layer was washed with 50 mL of 3 % KOH in 5 % ethanol and the organic layer was transferred into a 250 mL round-bottom flask using a rotary evaporator to evaporate organic solvent. The residue was redissolved with 2 mL absolute ethanol. The solution was filtered through a 0.22 μm nylon syringe filter and transferred in 2 mL of 9 mm screw thread vials. The sample (20 μL) was injected into the HPLC system (Alliance System, Germany) with an UV-DAD detector (Alliance 1200 Series,Germany) and separated the compounds by using C18column (YMCPack ODS-AM-303, 4.6 mm × 250 mm, 5 μm; Agilent Technologies,Wilmington, DE, U.S.A.) with a flow rate of 1.5 mL/min. Acetonitrile and methanol (75 : 25) were used as mobile phase. Determination and quantification of vitamin D2and ergosterol were performed at 265 nm at 34 °C. Vitamin D2content in Jew’s ear was expressed as μg/g in accordance with the external standard calibration curve of vitamin D2in a linearity range from 10 μmol/L to 100 μmol/L (R2> 0.99), and the ergosterol content in Jew’s ear was expressed as mg/g in accordance with the external standard calibration curve of ergosterol in a linearity range from 5 μmol/L to 300 μmol/L (R2> 0.99).
2.17 Determination of ergothioneine content
Ergothioneine was determined by the method described by Dubost et al. [20], with slight modifications. Brie fly, 0.50 g mushroom powder was mixed with 7 mL of ethanolic extraction solution(10 mmol/L dithiothreitol, 100 μmol/L betaine, 100 μmol/L 2-mercapto-1-methylimidazole) and 3 mL of deionized water in 15 mL centrifuge tubes. Then, 2 mL of 1 g/100 mL SDS solution was added into each tube and mixed them by vortex mixture around 20 seconds. All the sample tubes were centrifuged at 9 000 r/min for 10 min at 25 °C to collect the supernatant. Accurately, 3 mL of supernatant was transferred into 10 mL centrifugal tube and evaporated all the solvent by vacuum oven dryer at 40 °C. The dried residue was reconstituted by 1.5 mL of ultrapure water. Sonication and vortex were used to dissolve the residue completely. Then, the reconstituted solution was centrifuged at 9 000 r/min for 4 min. The supernatant was filtered through syringe filter (0.22 μm) into 2 mL of 9 mm screw thread vials. HPLC analysis of ergothioneine was carried out on a HPLC system (Alliance System, Germany) with an UV-DAD detector (Alliance 1200 Series, Germany). The column was used an Agilent Eclipse XDB-C18column (4.6 mm × 150 mm, 5 μm; Agilent Technologies, Wilmington, DE, USA). The sample was injected at volume of 10 μL with a flow rate of 0.4 mL/min. The mobile phase A(3% acetonitrile, 0.1% TEA, 50 mmol/L dibasic sodium phosphate in water), mobile phase B (acetonitrile), and the mobile phase C (water) were used. Separation was carried out under gradient elution as follows; 0 min 15 : 85 (B : C,V/V), 0–5 min ramp to 5 : 15 : 80 (A : B : C,V/V), 5–6 min ramp to 10 : 90 (B : C,V/V),6–8 min ramp to 3 : 97 (B : C,V/V), 8–15 min 3 : 97 (B : C,V/V)with a flow rate at 0.4 mL/min. Determination and quantification of ergothioneine was performed at 254 nm. The ergothioneine content in Jew’s ear was expressed as mg/g in accordance with the external standard calibration curve of ergothioneine in a linearity range from 10 μg/mL to 100 μg/mL (R2> 0.99).
2.18 Determination of protease inhibitory activity
The sample extract was prepared according to the procedure of Kumarappan et al. [21], with slight modifications. Briefly, 0.5 g Jew’s ear powder sample was extracted with 5 mL of 70% ethanol for 12 h, then the supernatant was transferred into another centrifugal tube. The process was repeated two more times by adding 5 mL of 70% ethanol into same 0.5 g sample (0.5 g sample extracted with total 15 mL of 70% ethanol solution), and the three repeated extraction were combined, and then was evaporated the ethanol by rotary evaporator at 45 °C. The remaining liquid was dried by freeze-dryer, and the solid dry sample was redissolved with Tris-HCl(25 mmol/L at 7.4 pH) solution in 1.00, 0.75, 0.50, 0.25, and 0.10 mg/mL concentrations. The colorimetric method was performed according to the following procedure. Accurately, 1 mL of different concentration sample solution was mixed with 1 mL of 0.2 mg/mL trypsin and 1 mL of 25 mmol/L Tris-HCl buffer (pH 7.4) in 15 mL centrifuge tube and incubated at 37 °C for 5 min. After incubation, 0.5 mL of 0.8% casein solution was added, then mixed with vortex for 15 s and again was incubated at 37 °C for 20 min. Finally, 2 mL of 70% HClO4was added into each tube and mixed them well by vortex. The tube was centrifuged at 5 000 r/min for 10 min and the absorbance was measured by UV-spectrophotometer at 280 nm against of blank.
2.19 Statistical analysis
The results were reported as mean ± standard deviation (SD)and the data analysis was done by using Microsoft Office Excel. The significant differences (P< 0.05) among the samples were determined through one-way ANOVA with Duncan’s multiple range tests using software SPSS (Version 17) statistical analysis. The principal component analysis (PCA) was performed by XLSTAT statistical software excel tool.
3. Results and discussion
3.1 Phenolic content of Jew’s ear
Phenolics are the vital responsible compounds in food products for antioxidant activity. The phenolic contents of 30 Jew’s ear varieties were presented in Table 2. The results showed that among these 30 Jew’s ear samples, the highest phenolic content was recorded in samples J30, J27, J28, and J25, which was higher than 1 mg GAE/g,while the lowest phenolic content recorded in J1, J15, J5, J16, and J19 was below 0.50 mg GAE/g of Jew’s ear samples. The average phenolic content of the remaining 21 samples was 0.69 mg GAE/g as determined. Among 30 Jew’s ear samples, the lowest phenolic content offive samples on average was 0.39 mg GAE/g. Therefore,the results in the current study showed that the phenolic compounds were rich in all the Jew’s ear varieties, while phenolic content of four Jew’s ear samples were relatively higher than the rest samples. The current results on TPC are comparable with our previous study [6]on a cultivated Jew’s ear sample (with TPC at 0.83 mg GAE/g) collected from Suifenhe in Heilongjiang Province, China. It has been verified that the total phenolic content of Jew’s ear may be contributed by its phenolic acids (gallic acid, gentisic acid, syringic acid,3,4-dihydroxybenzaldehyde, etc.) in our previous study [6]. Phenolics are the potential bioactive compound with excellent antioxidant properties and numerous health-promoting benefits [22]. Many researchers have closely observed that phenolic compounds have biological activity because of their potential antioxidants and free radical scavenging activity [23]. The antioxidant activity of phenolic compounds plays a decisive role in scavenging and neutralizing free radicals, quenching singlet, and triplet oxygen, or decomposing peroxides [24].
3.2 Flavonoids content of Jew’s ear
Total flavonoids content of 30 Jew’s ear varieties were presented in Table 2. Among the 30 Jew’s ear samples, the high amount of flavonoids content range was determined from 0.42 mg CAE/g to 0.21 mg CAE/g in J29, J18, J6, J1, and J16, while the lowest was from 0.03 mg CAE/g to 0.09 mg CAE/g recorded in J21, J15, J22, J8, J12,and J23. The average value the remaining Jew’s ear samples was recorded as 0.15 mg CAE/g. These results indicated that almost all the samples of Jew’s ear have a substantial amount of total flavonoids except for six samples, in which relative lower amount offlavonoids were found. The current results on TFC are comparable with our previous study [6]on a cultivated Jew’s ear sample (with TFC value at 0.23 mg CAE/g) collected from Suifenhe in Heilongjiang Province,China. Flavonoids are numerous polyphenol groups, which are characterized by the benzo-γ-pyrone structure. These compounds are important to human health because of their free radical scavenging activities [25]. Many researchers are interested in these substances because of their effective health-promoting benefits from the antioxidant activities. It is believed that the flavonoids in dietary supplements have potential health-promoting properties due to their antioxidant activities, as it has shown inin vitroandin vivostudies [25]. The main function offlavonoids in human health is to induce the human protective enzymatic systems, which have potential effects to play an important role against cardiovascular diseases,cancers, and other age-related diseases [25].
3.3 FRAP of Jew’s ear
FRAP is one of the popular colorimetric methods to determine the antioxidants. The FRAP values of 30 Jew’s ear varieties were presented in Table 2. The highest FRAP value was recorded on average at 1.08 mmol/100 g in J21, J18, and J20, while the lowest at only 0.53, 0.54, and 0.59 mmol/100 g in J1, J15, and J22 were recorded among these 30 Jew’s ear samples. The average FRAP of the remaining samples was recorded at 0.77 mmol/100 g sample. The FRAP method was developed to measure the ability of antioxidants to reduce Fe3+-TPTZ complex to Fe2+-TPTZ. The higher reduction of Fe3+-TPTZ means the higher the antioxidant activity. The reducing ability of a compound demonstrate the antioxidant activity of that compound [26]. Results showed that all the Jew’s ear mushrooms contain 0.53 mmol/100 g to 1.15 mmol/100 g, indicating that these Jew’s ear have reduction ability of ferric ion.
3.4 DPPH free radical scavenging ability of Jew’s ear
The ability of Jew’s ear antioxidants to scavenge the DPPH free radicals were measured, and the results were presented in Table 2.Among 30 Jew’s ear varieties, it was found that J21, J24, J23, J19,and J20 had the highest DPPH free radical scavenging rate with an average of 3.45 μmol TE/g, while the lowest scavenging rate was recorded 1.50 μmol TE/g and 1.78 μmol TE/g in J1 and J15. The average free radical scavenging capacity of the remaining 23 samples was 2.15 μmol TE/g. Various studies have applied DPPH method to determine the antioxidant activity of various neutral products [26].The DPPH count as a great antioxidant compound because of their hydrogen donating capacity [27]. The ranging of DPPH scavenging activity was recorded from 1.50 μmol TE/g to 4.08 μmol TE/g of 30 Jew’s ear mushrooms. These results demonstrated that all the Jew’s ear have DPPH scavenging activity.
3.5 ABTS free radicals scavenging capacity of Jew’s ear
The antioxidant radicals scavenging activities of Jew’s ear varieties were presented in Table 2. The results showed that samples J21 and J24 have the highest free radicals scavenging activity of 10.04 and 8.47 μmol TE/g, respectively, while J1 and J15 have the lowest free radical scavenging activity (3.85 and 4.88 μmol TE/g). The average radicals scavenging activity of remaining 26 samples were recorded at 6.50 μmol TE/g. The most sensitive radical scavenging activity is ABTS which known as ABTS radical scavenging assay,that is widely used to determine the antioxidant activities [28].The ABTS free radical stabilizes by absorbing hydrogen ions from antioxidants and losing their blue color. Also, in ABTS assay,antioxidant activity takes place to remove the hydroxyl or superoxide free radicals through the physiological process or evaluated with a high oxidation index indicates that the sample has strong antioxidant activity [29]. It is to be noted that all the Jew’s ear samples obtained high TE values by ABTS assay, indicating that Jew’s ear have potential antioxidant activity.
3.6 MCA of Jew’s ear
The metal chelating ability of 30 Jew’s ear varieties were presented in Table 2. The highest chelating ability was found in samples J23 and J21 (3.50 and 3.46 μmol/g), while the lowest in samples J1, J30, and J26 (1.59, 1.64 and 1.66 μmol/g). The remaining 25 Jew’s ear samples showed on average metal chelating ability of 2.27 μmol/g. The results showed that the 30 Jew’s ear samples have metal chelating ability (from 1.59 μmol/g to 3.50 μmol/g).The binding of ferrous ions from Jew’s ear varieties was estimated,which could quantitatively form complexes with Fe2+. The number of chelating agents present in a sample could be determined by transferring into the complex formation of the red color, and this red reduction depends on the presence of the chelating agent in the sample. Therefore, by measuring the color reduction, the chelating activity of the coexisting chelating agent can be evaluated [30]. In this MCA assay, the ethanolic extracts of Jew’s ear varieties antioxidant compounds inhibited the formation of ferrous and ferrozine complex,indicating that they have stronger chelating activity and capture ferrous ion before ferrozine. Fenton reaction can determine the lipid peroxidation in the presence of iron, and rapidly occur peroxidation with the aid of using decomposing the lipid hydroperoxides to peroxyl, and alkoxyl radicals keep continue the reaction of lipid peroxidation [31]. Metal chelating antioxidants protect from oxidative damage and destroy oxidation-promoting metal ions [32].
3.7 Total carbohydrate content of Jew’s ear
The major components of Jew’s ear mushroom are carbohydrates.The total carbohydrate contents of the 30 Jew’s ear varieties were presented in Table 3. All the varieties showed a considerable amount of carbohydrate content between 62.34% to 75.72%, which showed that the higher amount of carbohydrate content in all Jew’s ear mushrooms. Carbohydrate is the key source of energy production in our body. Besides this, carbohydrates help to store energy, build macromolecules, spare protein, and promote lipid metabolism in the body.
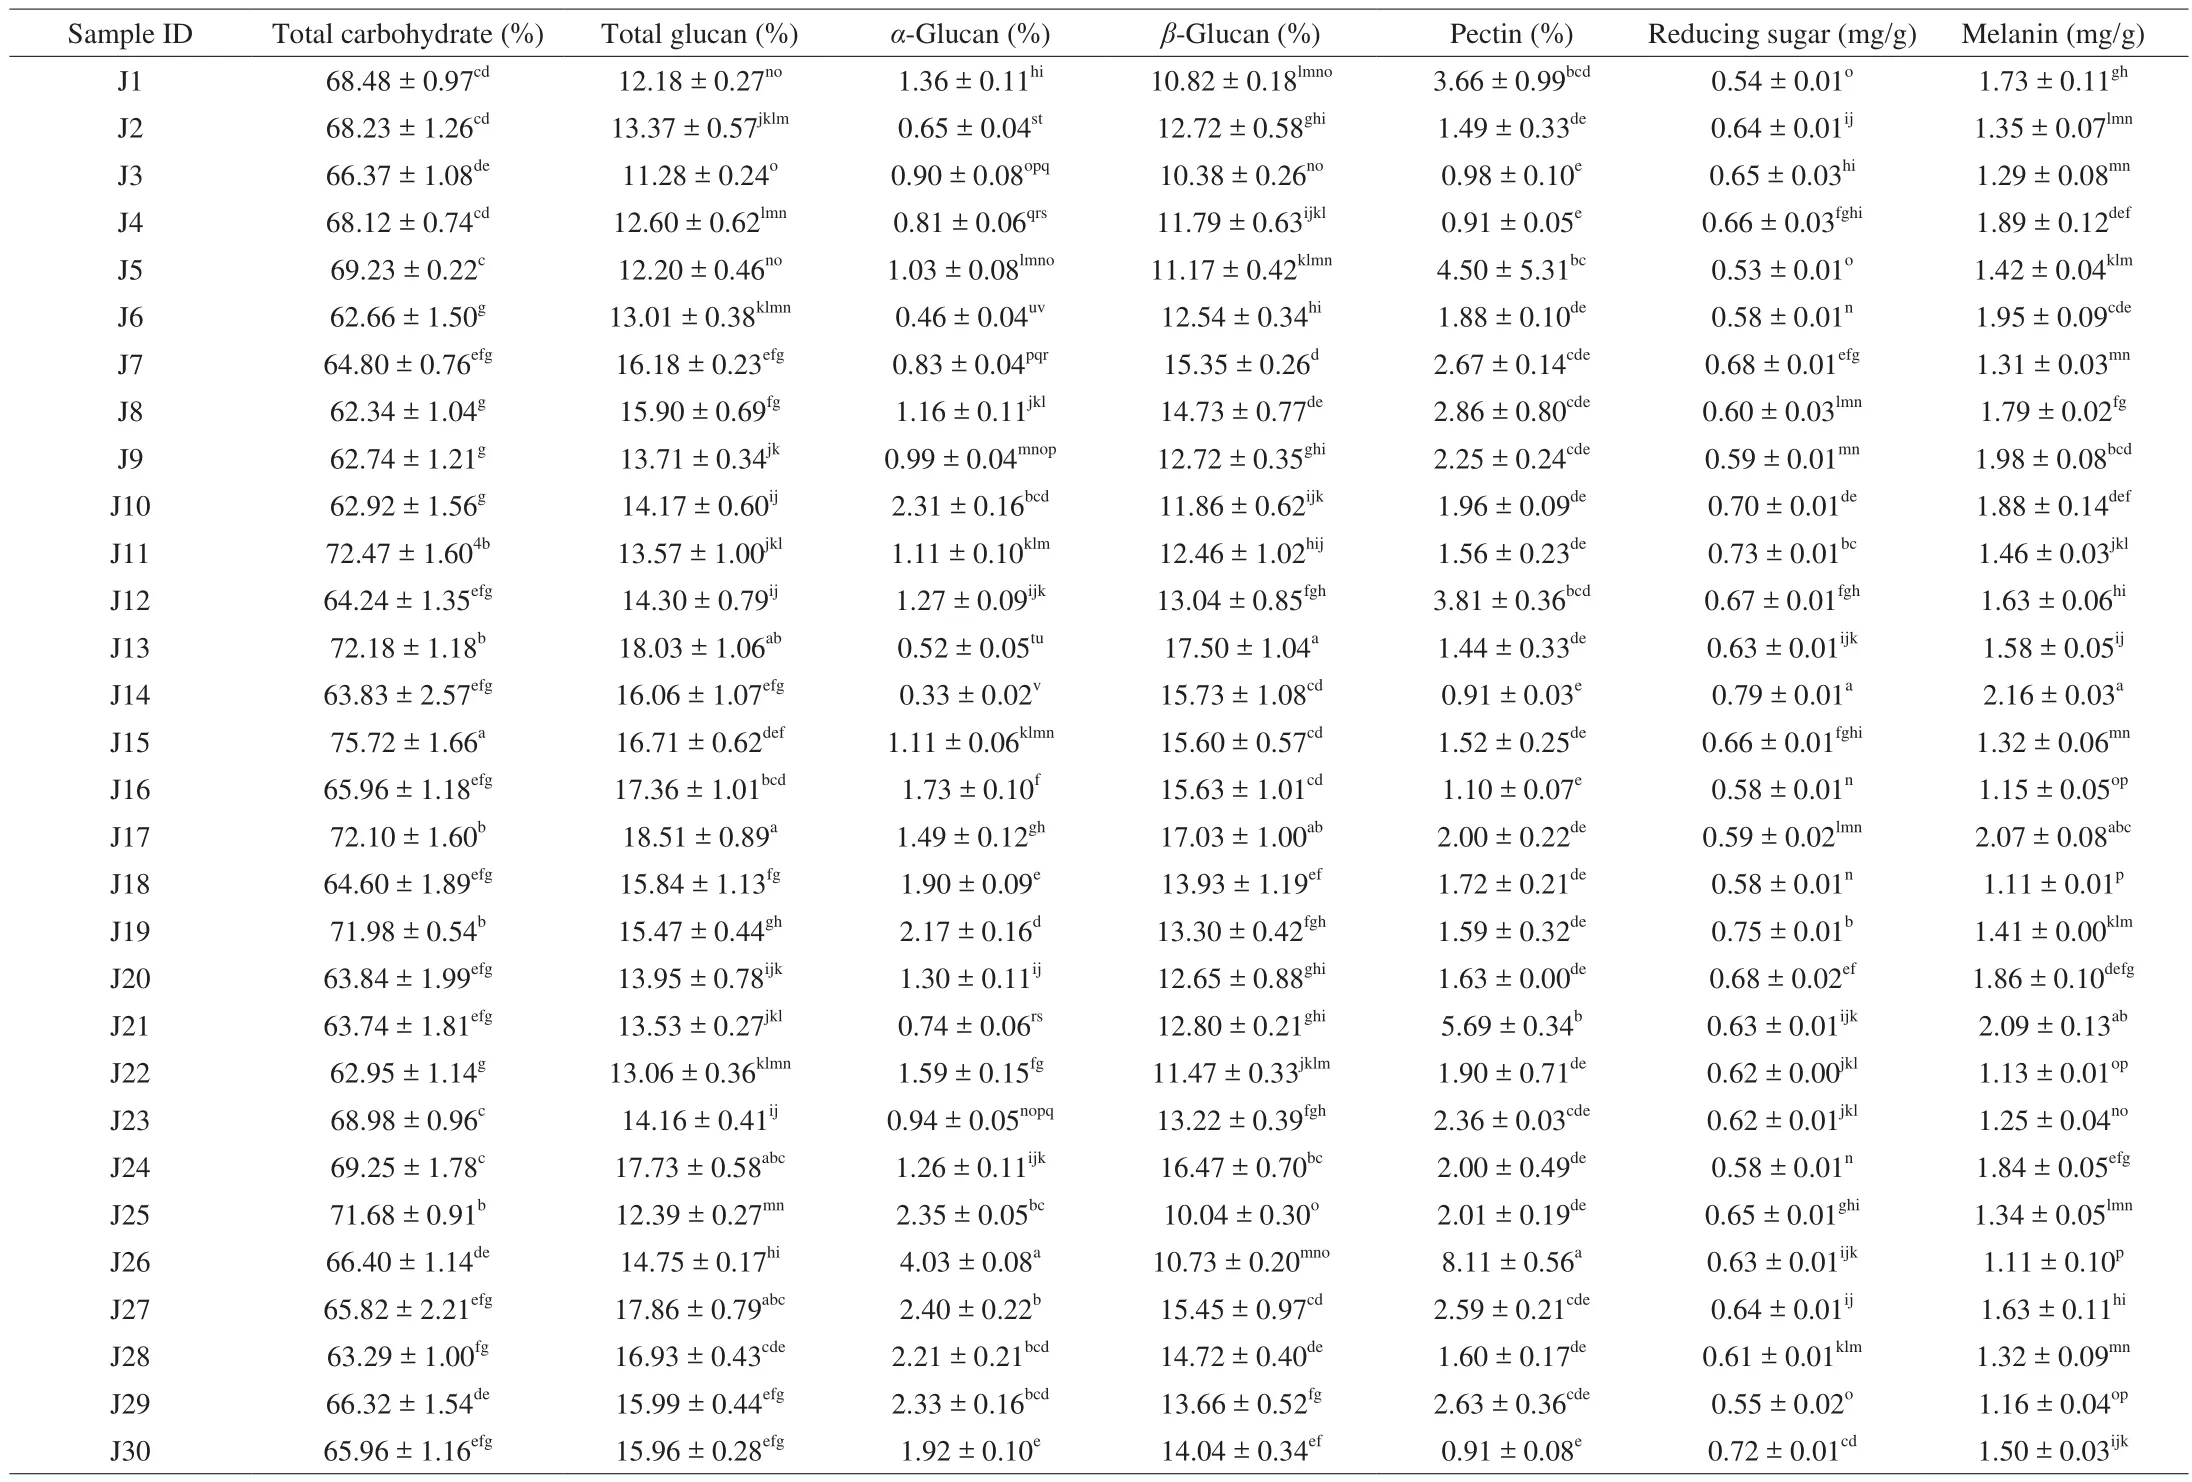
Table 3Total carbohydrate, total glucan, α-glucan, β-glucan, pectin, reducing sugar, and melanin content of Jew’s ear mushrooms.
3.8 β-Glucan content of Jew’s ear
β-Glucans are one of the major components in mushroom. The total glucan andα-glucan were identified in the 30 Jew’s ear varieties.Furthermore,α-glucan was subtracted from total glucan for the results ofβ-glucan. The total glucan,α-glucan, andβ-glucan contents of the 30 Jew’s ear varieties were presented in Table 3. The highestβ-glucan contents were recorded 17.50% and 17.03% in J13 and J17, while the lowest were recorded 10.04%, 10.38%, 10.73%, and 10.82% in J25,J3, J26, and J1 Jew’s ear mushrooms. The averageβ-glucan content of remaining 24 samples was recorded 13.63%. The results indicated that the 30 Jew’s ear mushrooms have highβ-glucan content. It has been found thatβ-glucan has numerous biological health-promoting functions.β-Glucan can stimulate the immune system by modulating humoral and cellular immunity and has beneficial effect to fight against infections such as bacterial, viral, fungal, parasitic, and exhibit hypocholesterolemic and anticoagulant properties. According to recent research,β-glucan has the characteristics of anti-cytotoxic, antimutagenic, anti-tumorigenic, which making it promising candidate as pharmacological promoters of health [33].
3.9 Reducing sugar content of Jew’s ear
The reducing sugar content of 30 Jew’s ear mushrooms were presented in Table 3. All the Jew’s ear mushrooms showed a higher amount of reducing sugar content. The highest reducing sugar content was 0.79 mg/g in sample J14, while the lowest was 0.53 mg/g in J5. The average reducing sugar content of remaining 28 Jew’s ear samples was 0.64 mg/g. It has previously been reported that the reducing sugar content was higher in commercial Jew’s ear [34],while this current study’s Jews ear varieties showed a little lower amount of the reducing sugar content. Reducing sugar normally a carbohydrate or natural sugar containing free aldehyde or ketone groups with various functions. This reducing sugar could react with other parts of the food, for example it could react with amino acids,thereby changing the color or taste of the food.
3.10 Total pectin content of Jew’s ear
Pectin is a soluble fiber that improves the digestive system, and cure gastrointestinal and metabolic disorders. The total pectin contents of the 30 Jew’s ear mushrooms were presented in Table 3. The results showed that the maximum amount of pectin content was 8.11% in J26,while the lowest was recorded at 0.91% in J4, J14, and J30 Jew’s ear sample. The average total pectin content of the remaining 26 samples was 2.28%. Pectins have complex biomolecules and have been reported that the accumulation of pectic polymers and oligosaccharides from pectin have potential health-promoting benefits [35].Pectin contains variety of bioactive substances, which are used in the pharmaceutical industry as a raw material for the prevention of cancer, obesity, diabetes, and heart disease [36].
3.11 Melanin content in Jew’s ear
The melanin contents of 30 Jew’s ear were presented in Table 3.The highest melanin contents were found in J14, J21, and J17 (2.16,2.09, and 2.07 mg/g, respectively), while the lowest were found in J18 and J26 (1.11 mg/g). The average melanin content of remaining 25 samples was 1.53 mg/g. Melanin is a natural pigment which found in most organisms and has been widely and conventionally used in food, cosmetics, and medicines because of their excellent antioxidant,anti-radiation, and anti-quorum sensing properties [37,38]. However,synthetic melanin is not safe in comparison to natural pigments.Therefore, many researchers are focusing on natural melanin production through the extraction of plant materials like black fungi [39]. Therefore, Jew’s ear could be a great source to produce natural melanin.
3.12 5’-Nucleotides contents in Jew’s ear
5’-Nucleotides contents in 30 Jew’s ear mushrooms were presented in Table 4. 5’-Nucleotide standards and sample HPLC chromatograms were presented in Supplemental Fig. 1. The results showed that all the Jew’s ear mushrooms contain cytosine, cytidine,uridine, adenine, and guanosine. The highest cytosine content was 101.74 μg/g in J23, cytidine was 105.09 μg/g in J23, uridine was 106.52 μg/g in 27J, adenine was 259.15 μg/g in J21, and guanosine was 314.48 μg/g in J3, while the lowest cytosine content was 7.61 μg/g in J8, cytidine was 8.61 μg/g in J26, uridine was 9.62 μg/g in J29, adenine was 60.28 μg/g in J1, and guanosine was 62.07 μg/g in J20. The remaining 28 Jew’s ear mushrooms average content of cytosine was 24.42 μg/g, cytidine was 16.52 μg/g, uridine was 43.81 μg/g, adenine was 163.41 μg/g, and guanosine was 188.04 μg/g.The results showed that all the Jew’s ear samples have higher amounts of 5’-nucleotides. Nucleosides are involved in multiple physiological processes in the human body using purinergic/pyrimidine receptors [40]. It has also been reported that nucleosides and/or nucleotides enhance the brain function, effects on immunomodulation,influence fatty acids metabolism, contribute to iron absorption in the gut, and improve gastrointestinal tract repair [41].
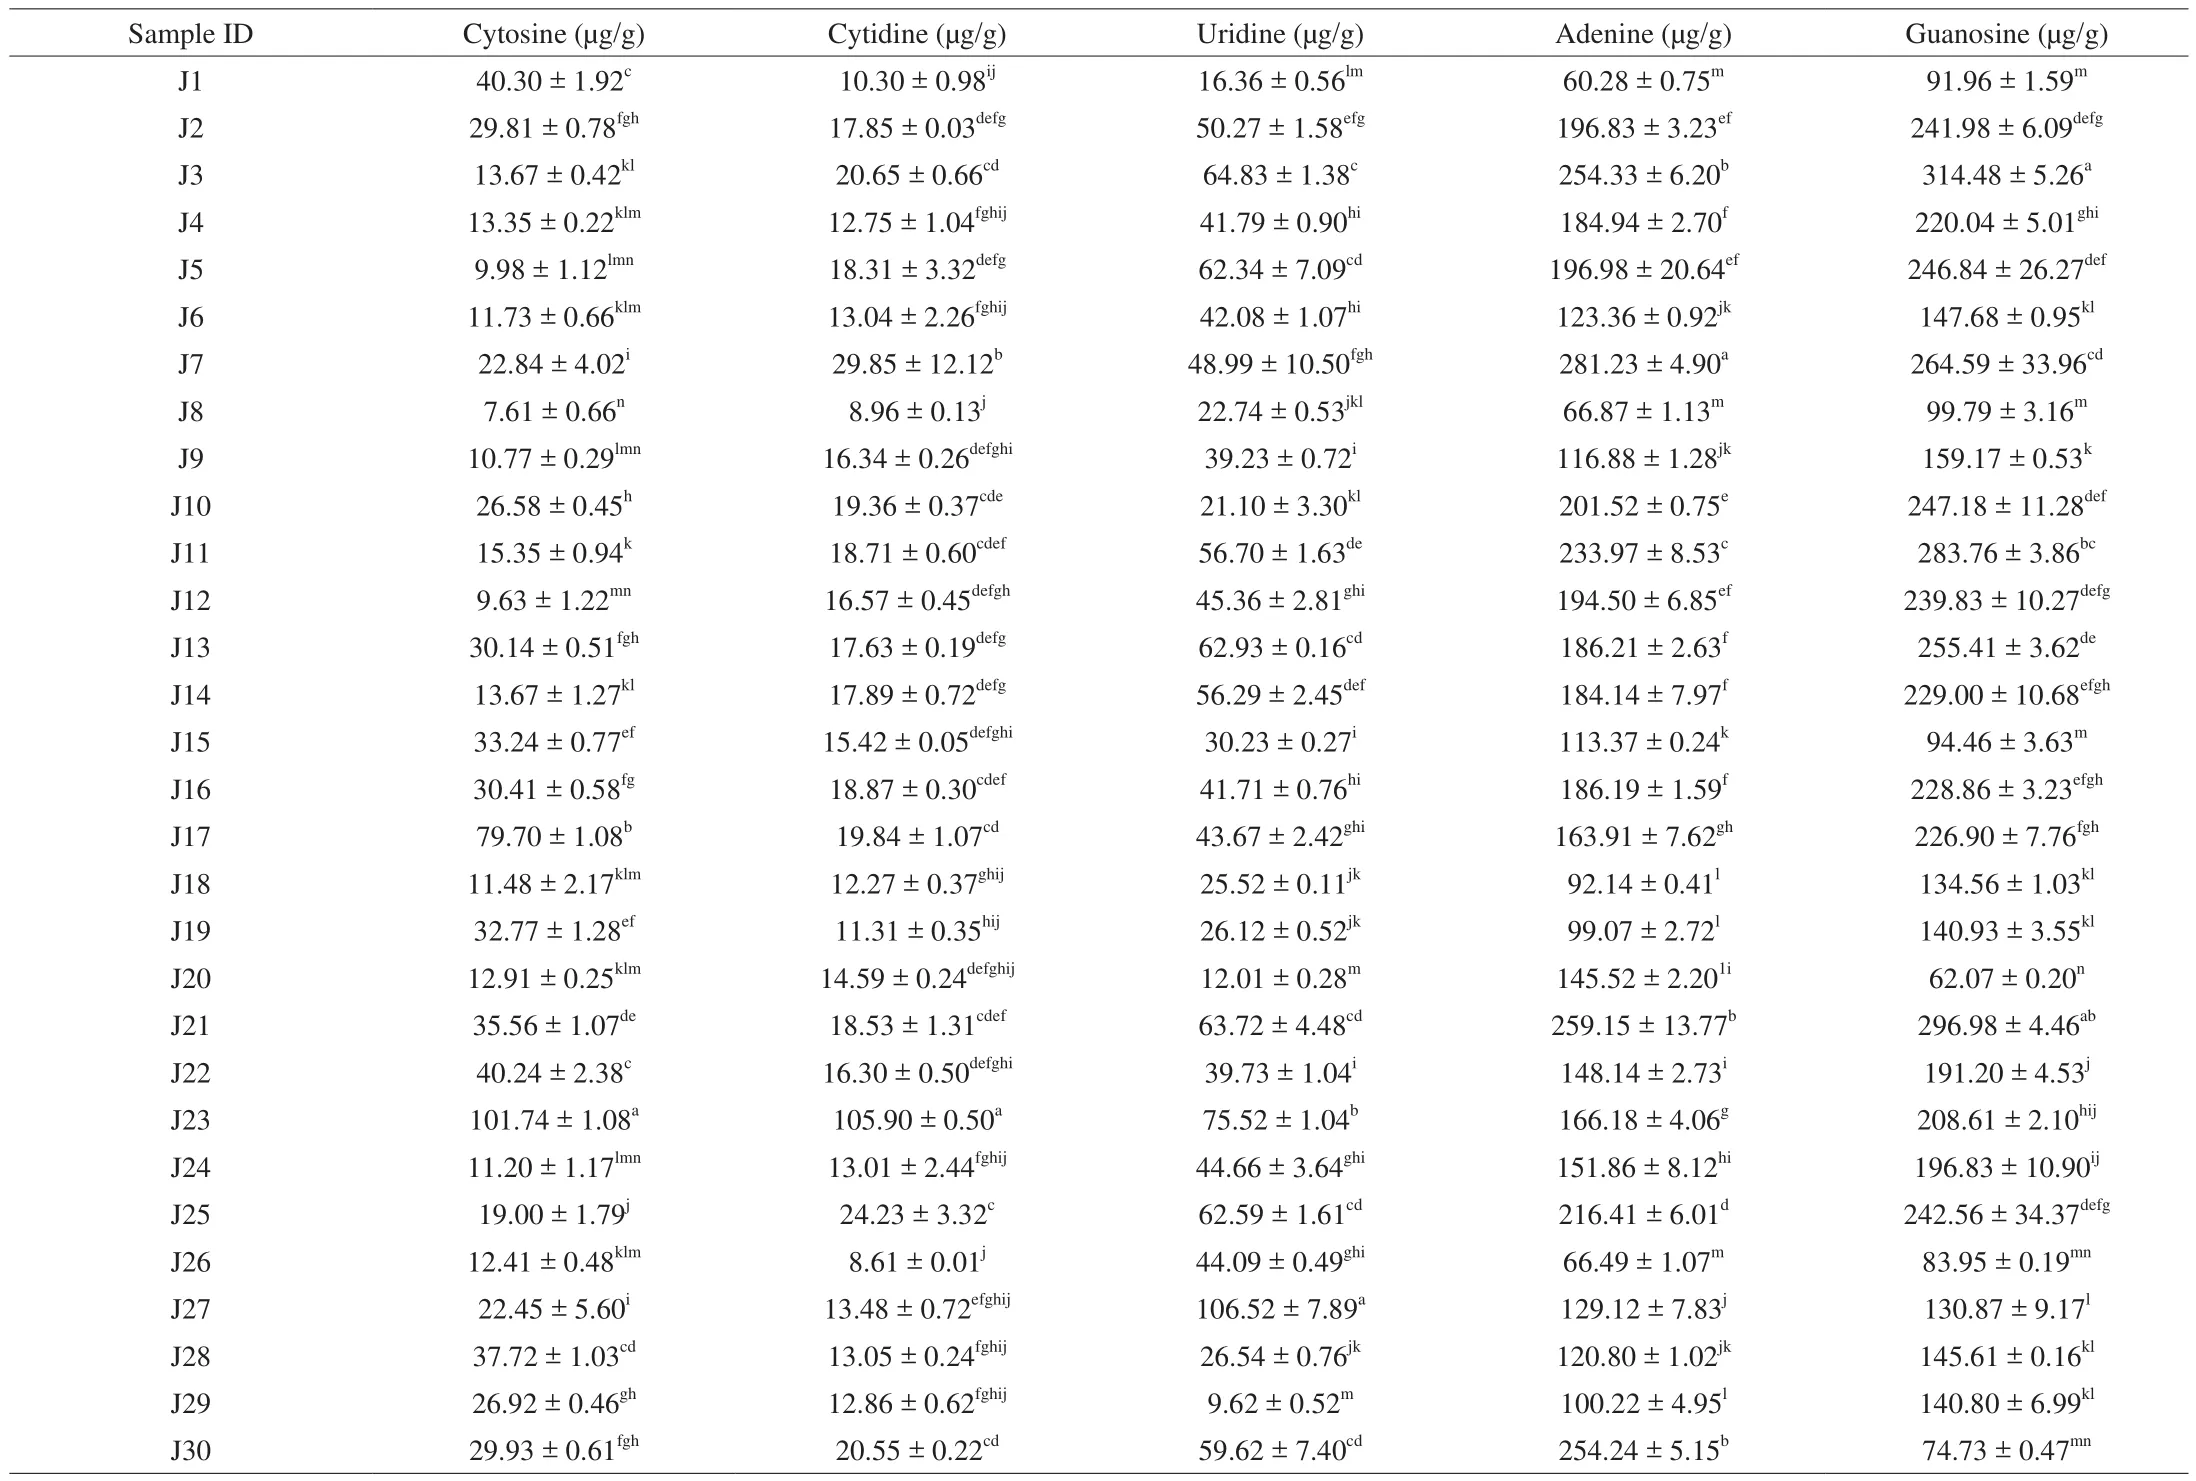
Table 45’-Nucleotide contents of Jew’s ear mushrooms.
3.13 Vitamin D2 and ergosterol content in Jew’s ear
Vitamin D2and ergosterol contents of 30 Jew’s ear mushrooms were presented in Table 5. The HPLC chromatograms of the standards of vitamin D2and ergosterol, and Jew’s ear vitamin D2and ergosterol content were shown in Supplemental Fig. 2. Among 30 Jew’s ear mushrooms, the highest vitamin D2contents were in J10, J1, and J3, which were 48.67, 47.73, and 44.06 μg/g, while the lowest were in J29, J22, J30, J19, J9, and J6, which were 22.30 μg/g on average. Meanwhile, the average content of the remaining samples was recorded at 33.87 μg/g. The results showed that all the Jew’s ear contain 22–48 μg/g of vitamin D2. It has been reported that vitamin D2functionally supports bone growth and actively regulates the immune response [42]. Jasinghe et al. [43]found that vitamin D2content in mushrooms was increased through UV-irradiation. Many articles have been reported that vitamin D deficiency is associated with cancers,heart diseases, obesity, diabetes, and arthritis. It has been found that vitamin D has potential abilities in the treatment of various diseases,including hyperproliferative, malignancies, cancers, diabetes, heart disease, and osteoporosis [19,44].
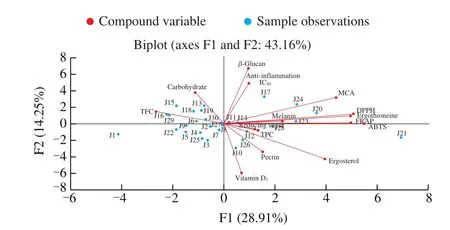
Fig. 2 Analysis of 30 Jew’s ear samples distribution and their chemical compounds correlation observation in the two first PCA axes of F1 and F2.
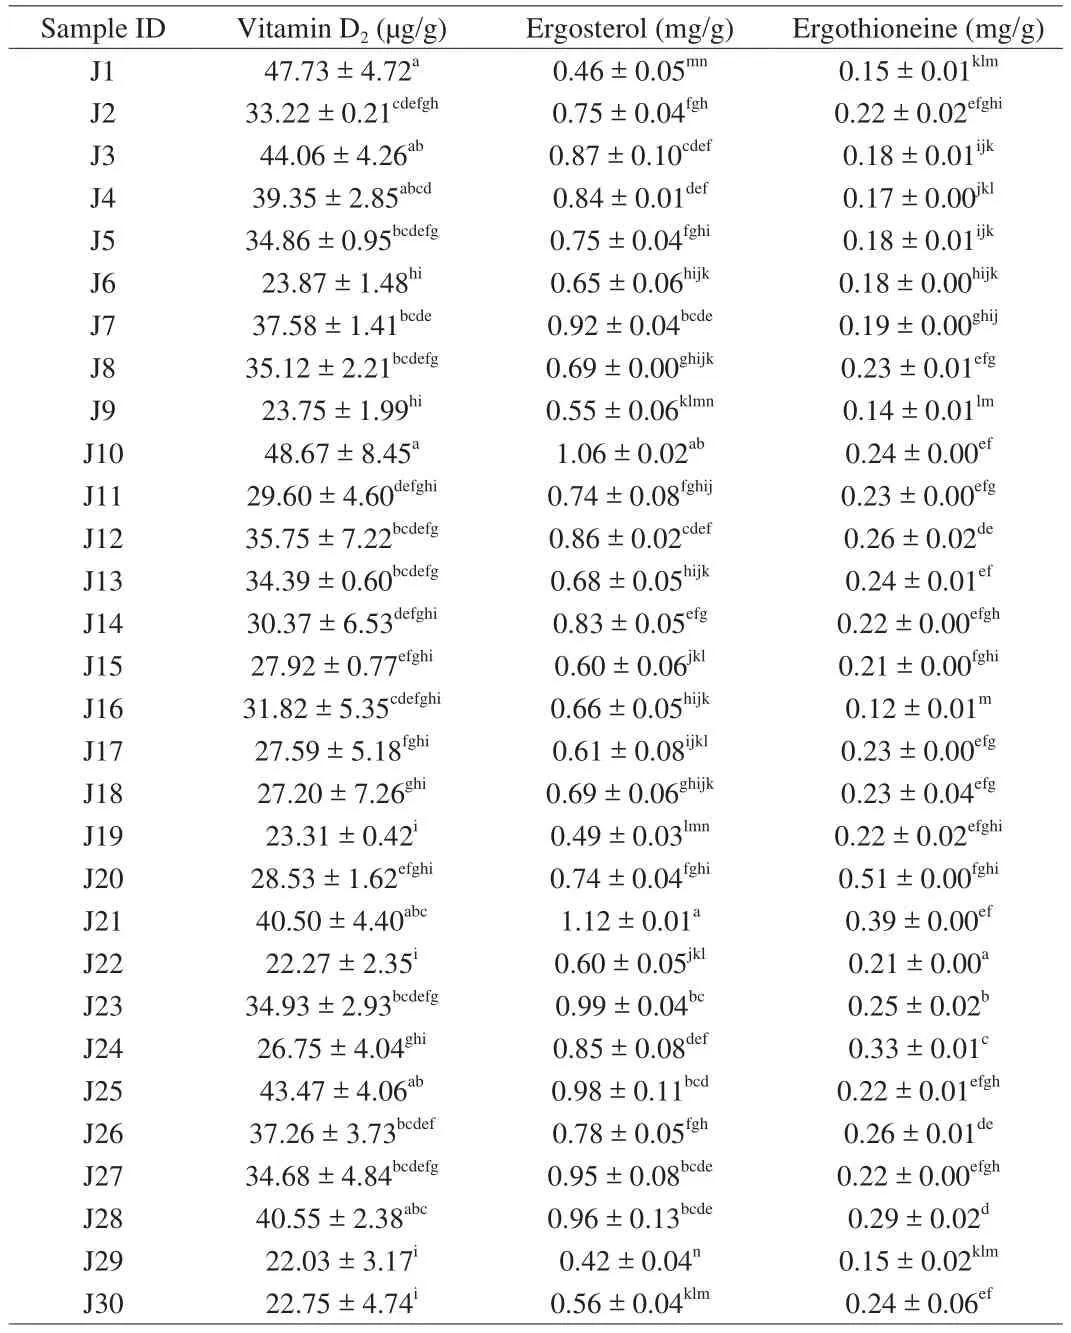
Table 5Vitamin D2, ergosterol, and ergothioneine content of Jew’s ear mushrooms.
The highest ergosterol contents were found in J21 and J10(approximately 1.12 and 1.06 mg/g, respectively), while the lowest contents were in J29, J1, and J19 (0.42, 0.46, and 0.49 mg/g,respectively). The average ergosterol content of the remaining 26 samples was 0.26 mg/g. As the results showed that all the Jew’s ear mushrooms contain a higher amount of ergosterol. Many researchers have found that ergosterol has remarkable antioxidant and antimicrobial properties without any hepatotoxicity [45], and this ergosterol is the precursor of vitamin D2under UV radiation in mushrooms [46], which believes that this ergosterol could increase vitamin D2content in Jew’s ear.
3.14 Ergothioneine content of Jew’s ear
Ergothioneine was found in all the Jew’s ear mushrooms which were presented in Table 5. The standard of ergothioneine and Jew’s ear ergothioneine content HPLC chromatograms were presented in Supplemental Fig. 3. The results showed that the highest ergothioneine content was 0.51 mg/g found in J20, while the lowest was 0.12 mg/g found in J16, and the average ergothioneine content of the reaming 28 samples was 0.22 mg/g. Ergothioneine is a sulfurcontaining amino acid known as an antioxidant compound. In this study, rich amount of ergothioneine was found in all the Jew’s ear varieties. It has been reported that ergothioneine is an antioxidant compound which could protect our body from harmful cells damage,and it has also been suggested that ergothioneine could be referred as a vitamin because of its unique role in protecting mitochondria from oxidation [47].
3.15 Anti-inflammation ability of Jew’s ear
Jew’s earin vitroanti-inflammation activity 50% inhibiting concentration (IC50) were presented in Table 2. The best IC50inhibition activity was found in samples J14 and J22 at the lowest concentration of 0.36 mg/mL, while the IC50was at a high concentration of 0.50 mg/mL in J20. Meanwhile, the average concentration of IC50was found 0.41 mg/mL in the remaining Jew’s ear samples.
In flammation is a complex biological response to get injure and leads to many physical symptoms by losing its normal function,therefore it initiates pain, heat, and swelling. Inflammation has linkage with a variety of diseases including diabetes, obesity, cancer,cardiovascular diseases, and so on [48,49]. Anti-inflammatory compounds from plant origin are potential natural compounds and safe medicines which do not have the harmful side effects as nonsteroidal anti-inflammatory drugs [50]. The results showed that all the Jew’s ear mushrooms have high anti-inflammation activity,which demonstrated that Jew’s ear have a potential source of antiinflammation activity and could prevent our body from various inflammatory diseases and cell damage.
3.16 Pearson correlation between compounds and bioactivities
The correlation among phenolic compounds, antioxidant capacities, total carbohydrate,β-glucan, reducing sugar, pectin,melanin, vitamin D2, ergosterol, ergothioneine, and anti-inflammation IC50were presented in Table 6. The results of DPPH, FRAP, ABTS,MCA, ergothioneine, ergosterol, and vitamin D2were exhibited positive linear correlation at the level of 0.01,r= 0.692 for DPPH and FRAP,r= 0.746 for ABTS and FRAP,r= 0.770 for ABTS and DPPH,r= 0.645 for MCA and DPPH,r= 0.708 for MCA and ABTS,r= 0.545 for ergosterol and ABTS,r= 0.622 for ergosterol and vitamin D2,r= 0.644 for ergothioneine and FRAP,r= 0.670 for ergothioneine and DPPH,r= 0.619 for ergothioneine and ABTS, andr= 0.487 for ergothioneine and MCA. The positive linear correlation at the level of 0.05 werer= 0.401 for MCA and FRAP,r= 0.395 for ergosterol and FRAP,r= 0.379 for ergosterol and DPPH,r= 0.384 for ergosterol and MCA,r= 0.394 for ergothioneine and ergosterol,r= 0.433 for anti-inflammation IC50andβ-glucan,r= 0.385 for antiinflammation IC50and ergothioneine. Ergothioneine has the potential ability to protect from oxidative cell damage and considered an antioxidant compound [51]which showed positive correlation with other antioxidant activities. The presence of ergosterol in mushroom could help to produce vitamin D2under the UV-irradiation [43]which demonstrated that higher ergosterol content could increase vitamin D2.The current results demonstrated that ergosterol and vitamin D2have significant positive correlation (r= 0.622) and it has been verified with previous study [43]. It also con firmed with our previous study on food legumes and goji berries that different antioxidant assays have strong positive correlations [10,52]. The high correlation values between ergothioneine and antioxidant assays further verified that ergothioneine is one of the powerful antioxidants in foods [47].
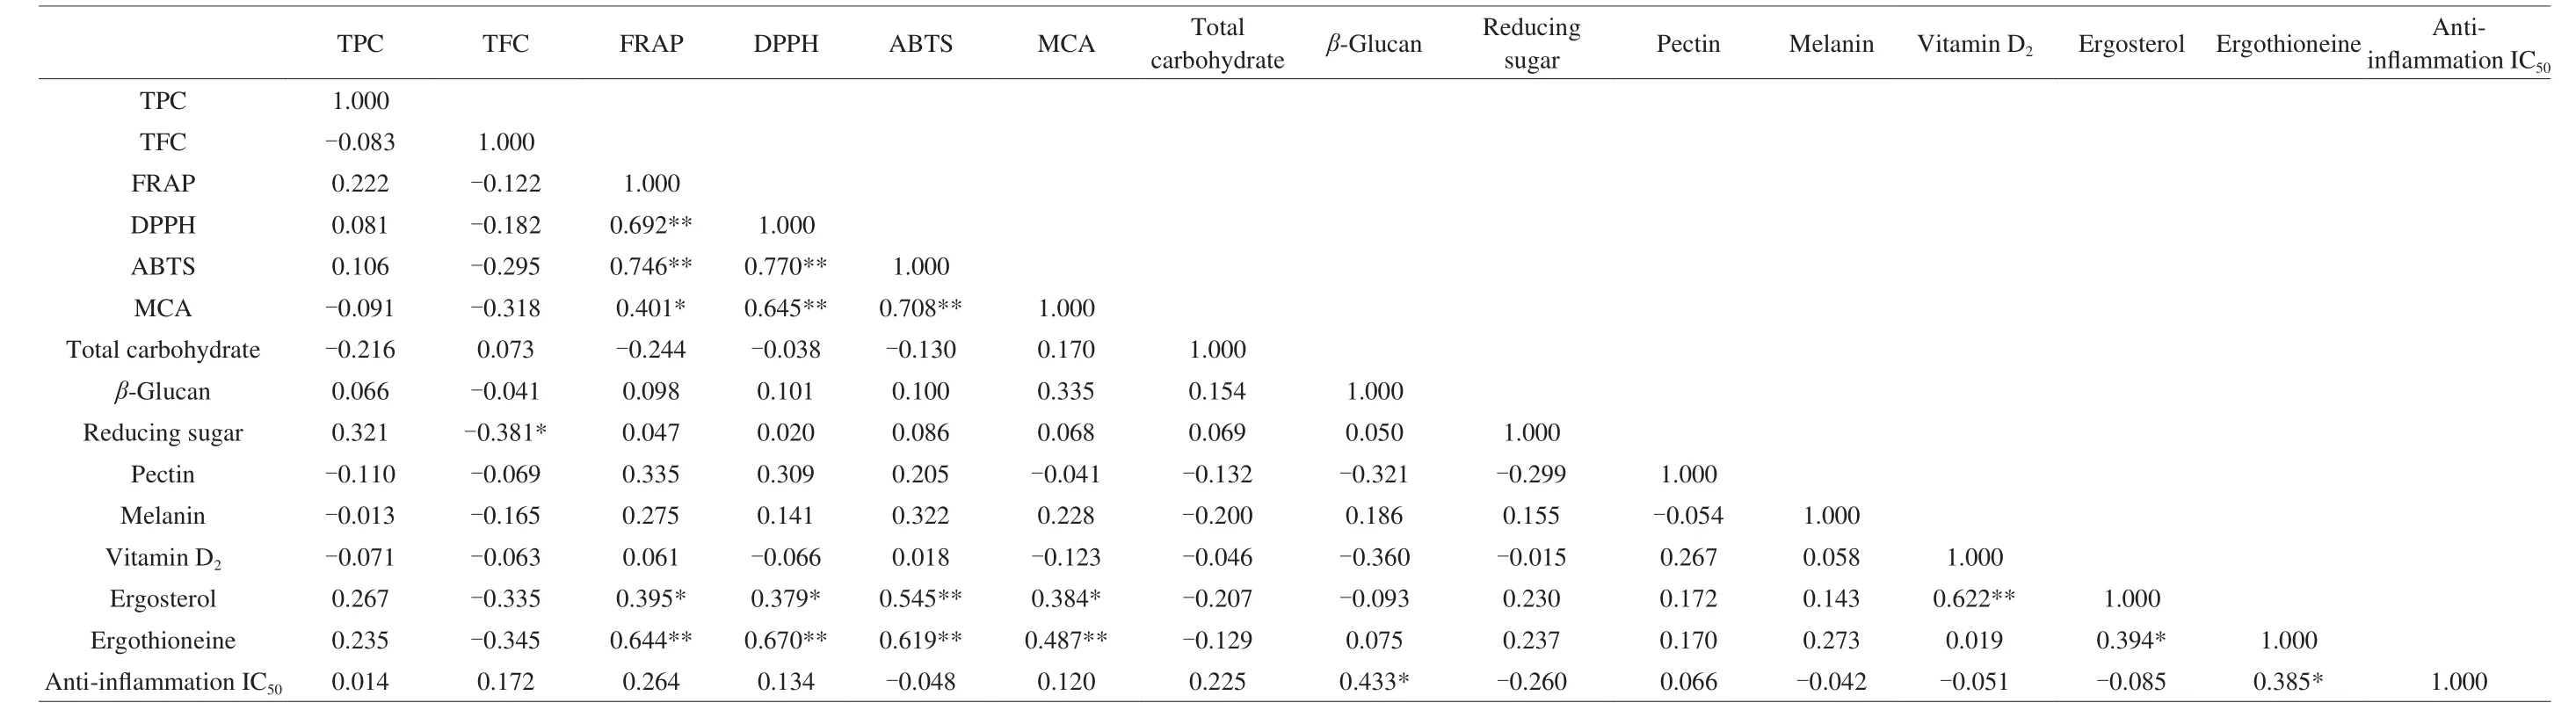
Table 6 Correlationanalysis among different compounds of Jew’ ear mushrooms.
3.17 PCA
The PCA was performed on different chemical compounds and the distributions of Jew’ ear samples were presented in Fig. 2. Total 15 different components from 30 Jew’s ear samples were analyzed.Usually, PCA is used to perform for the reduction of variables from the large number to a small number of principal components, which could explain the greatest variance of analyzed data [53]. The results showed that the distributions of all the samples were positioned tidily around the middle of the plot. However, the J21 sample was further away than the other samples and this may outlier. The first two principal components (F1 and F2) were accounted for 43.16% of the total variance (28.91% and 14.25%, respectively). The F1 was associated with the contents ofβ-glucan, anti-inflammation IC50, MCA, DPPH, ergothioneine, melanin, FRAP, ABTS, reducing sugar, TPC, ergosterol, pectin, and vitamin D2, whereas the F2 was correlated with TFC and carbohydrate. The compounds were closed to each other and formed small angles that were positively correlated, such asβ-glucan and anti-inflammation IC50, DPPH and ergothioneine, FRAP and ABTS. On the other hand, those compounds found at around 90° angles were not significantly correlated, such asβ-glucan and ergosterol. Some of the compounds formed at large angles (around 180°) were negatively correlated, such as reducing sugar and TFC, TFC and ergosterol, and vitamin D2andβ-glucan.These PCA statistical results clearly explained the relationship between one compound to another and clarified their positive and inventive correlation. The PCA analyses further verified with previous pearson correlation analyses, and the major components contribute to the bioactivities of Jew’s ear.
4. Conclusions
In conclusion, the various health-promoting chemical compositions were found in these 30 Jew’s ear varieties, where the higher phenolic compounds and antioxidant activities were recorded. Moreover, it contains the higher amount of carbohydrates,β-glucan, reducing sugar, melanin, pectin, 5’-nucleotides, vitamin D2,ergosterol, and ergothioneine. The potential anti-inflammation activity was shown in all the Jew’s ear varieties. The significant correlation among FRAP, DPPH, ABTS, MCA, and ergothioneine values proposed that antioxidant assays are reliable. A highly correlation of ergothioneine and antioxidants capacities indicated that ergothioneine could make a significant contribution to antioxidant activities, and the correlation between ergosterol and vitamin D2indicated that ergosterol may be the key factor to increase the amount of vitamin D2in Jew’s ear samples, it needs further experimental verification. These all health-promoting compounds demonstrate that Jew’s ear could be an excellent raw material in pharmacology and functional food product development.
Conflicts of interest
The authors declare no conflict of interest.
Acknowledgement
This research was jointly supported by one research grant(R202017) from BNU-HKBU United International College, China,and one grant (20200101) from The Open Project of National R & D Center for Edible Fungus Processing Technology, Kaifeng, China),and one grant China Agriculture Research System (No. CARS-20).Appendix A. Supplementary data
Supplementary data associated with this article can be found, in the online version, at http://doi.org/10.1016/j.fshw.2022.03.005.
杂志排行

食品科学与人类健康(英文)的其它文章
- Dietary bioactives and essential oils of lemon and lime fruits
- Green tea, epigallocatechin gallate and the prevention of Alzheimer’s disease: clinical evidence
- Simultaneous quantification of 18 bioactive constituents in Ziziphus jujuba fruits by HPLC coupled with a chemometric method
- GPP (composition of Ganoderma lucidum polysaccharides and Polyporus umbellatus polysaccharides) protects against DSS-induced murine colitis by enhancing immune function and regulating intestinal flora
- Immunoregulatory polysaccharides from Apocynum venetum L.flowers stimulate phagocytosis and cytokine expression via activating the NF-κB/MAPK signaling pathways in RAW264.7 cells
- MLST analysis of genetic diversity of Bacillus coagulans strains to evaluate effects on constipation model