New Massive Contact Twin Binary in a Radio-quiet HII Region Associated with the M17 Complex
2022-05-24JiaYin尹佳ZhiweiChen陈志维YongqiangYao姚永强JianChen陈健BinLi李彬andZhiboJiang江治波
Jia Yin (尹佳) ,Zhiwei Chen (陈志维) ,Yongqiang Yao(姚永强) ,Jian Chen (陈健),4 ,Bin Li (李彬),4 ,and Zhibo Jiang (江治波)
1 National Astronomical Observatories,Chinese Academy of Sciences,Beijing 100101,China
2 University of Chinese Academy of Sciences,Beijing 100049,China
3 Purple Mountain Observatory,Chinese Academy of Sciences,Nanjing 210023,China;zwchen@pmo.ac.cn
4School of Astronomy and Space Science,University of Science and Technology of China,Hefei 230026,China
Abstract Early-B stars,much less energetic than O stars,may create an H II region that appears as radio-quiet.We report the identification of new early-B stars associated with the radio-quiet H II region G014.645–00.606 in the M17 complex.The radio-quiet H II region G014.645–00.606 is adjacent to three radio-quiet WISE H II region candidates.The ionizing sources of the radio-quiet H II regions are expected to be later than B1V,given the sensitivity about 1–2 mJy of the MAGPIS 20 cm survey.The stars were first selected if their parallaxes of Gaia EDR3 match that of the 22 GHz H2O maser source within the same region.We used the color–magnitude diagram made from the Zwicky Transient Facility photometric catalog to select the candidates for massive stars because the intrinsic g−r colors of massive stars change little from B-type to O-type stars.Five stars lie in the areas of the color–magnitude diagram where either reddened massive stars or evolved post-main sequence stars of lower masses are commonly found.Three of the five stars,sources 1,2,and 3,are located at the cavities of the three IR bubbles,and extended Hα emission is detected around the three IR bubbles.We suggest that sources 1,2,and 3 are candidates for early-B stars associated with the radio-quiet region G014.645–00.606.Particularly,source 1 is an EW type eclipsing binary with a short period of 0.825 day,while source 2 is an EA type eclipsing binary with a short period of 0.919 day.The physical parameters of the two binary systems have been derived through the PHOEBE model.Source 1 is a twin binary of two stars with Teff ≈23,500 K,and source 2 contains a hotter component (Teff ≈20,100 K) and a cooler one (Teff ≈15,500 K).The O−C values of source 1 show a trend of decline,implying that the period of the source is deceasing.Source 1 is likely a contact early-B twin binary,for which mass transfer might cause its orbit to shrink.
Key words:stars:massive–stars:early-type–(stars:) binaries:eclipsing–stars:fundamental parameters
1.Introduction
Our understanding of the OB stars(mass >8 M⊙)is far from enough and precise.For instance,systematic surveys of the OB stars in the past decade have shown that the majority of OB stars are binaries and/or multiple systems (Chini et al.2012;Sana et al.2012;Kobulnicky et al.2014;Sota et al.2014;Aldoretta et al.2015;Pozo Nuñez et al.2019;IJspeert et al.2021;Luo et al.2021).The binary fraction of OB stars increases as the spectral type goes to early (Guo et al.2022),and O stars in cluster,associations,and runaways have binary fraction (70%) higher than those in field environment (40%;Chini et al.2012).These observational studies challenge the accepted predominance of the single star evolutionary channel and complicate the exact determination of the evolutionary status and final fates of these stars (Han et al.2020).
OB stars are mostly within stellar clusters,thus the dynamical interactions between cluster members likely alter the properties of OB-type multiple systems after several dynamical times(Kourniotis et al.2015).Establishing the multiplicity properties of large,statistically significant samples of newly born OB stars is consequently crucial to understand the initial conditions and properly compute the evolution of these objects.Banyard et al.(2021) analyzed the spectrum of 80 B-type stars in the open cluster NGC 6231 with an age of 2–7 Myr,and constrained a debiased spectroscopic binary fraction of 52%±8%,a value lower than that for the more massive O-type stars.The orbital properties of the 27 B-type binary candidates in NGC 6231 generally resemble those of B-and O-type stars in both the Galaxy and Large Magellanic (Banyard et al.2021).Spectroscopic time domain observations for newly born OB stars distributed in various star-forming regions are generally time consuming.For the star-forming regions,multiband photometric surveys of the young stars from low to high-mass are the efficient ways to detect young Eclipsing Binaries (EBs;Barr Domínguez et al.2013;Rice et al.2015;Bhardwaj et al.2019;Michalska 2019;Martínez-Vázquez et al.2021;Yin et al.2021).The physical parameters of multiple systems can be determined by modeling the light and radial velocity curves,and provide a detailed understanding of their interior rotation and angular momentum transport mechanisms(Aerts et al.2019;Southworth et al.2021).
Apart from the optical spectroscopic surveys for the OB stars in the Galaxy(Sota et al.2011;Aldoretta et al.2015;Liu et al.2019;Li 2021),the mid-IR surveys are able to detect the mid-IR radiation from warm dust grains and polycyclic aromatic hydrocarbons (PAH) which interplay with the (far)-UV photons from OB stars (Anderson et al.2014;Kerton et al.2015;Jayasinghe et al.2019).The ionized gas excited by far-UV photons from OB stars is also detectable in the form of free–free continuum emission and radio recombination lines in radio wavelengths (Helfand et al.2006;Stil et al.2006;Anderson et al.2011,2018;Hou &Gao 2019;Wenger et al.2021;Zhang et al.2021).The methods from mid-IR and radio wavelengths cannot constrain the specific candidate OB stars responsible for the mid-IR and radiation emissions.In addition,photometric and astrometric information of the stellar sources within the same areas are necessary for further classifying the candidate OB stars.For example,new young OB stars were found in the field around young clusters from the VST Photometric Hα Survey of the Southern Galactic Plane and Bulge (VPHAS+;Drew et al.2014;Mohr-Smith et al.2017;Drew et al.2018).Star-forming regions are generally suffering high extinction,OB stars within star-forming regions are largely unknown and awaiting discovery (Chen et al.2015;Povich et al.2017).
The M17 H II nebula (aka NGC 6618) is located in the Sagittarius spiral arm(Elmegreen et al.1979;Reid et al.2019)at a distance ≈2.0 kpc (Xu et al.2011;Chibueze et al.2016).The young embedded cluster NGC 6618 is thought to be younger than 3 Myr (Jiang et al.2002),and contains hundreds of stars earlier than B9 (Lada et al.1991;Hoffmeister et al.2008).M17 has been studied in depth from various aspects,such as physical properties of massive young stellar objects(MYSOs;Chini et al.2004;Nielbock et al.2007;Ramírez-Tannus et al.2017;Lim et al.2020;Chen et al.2021),magnetic fields of the H II region and surrounding molecular clouds (Chen et al.2012),the molecular gas distribution and overall star formation activities (Povich et al.2009;Nguyen-Luong et al.2020).As the mid-IR surveys like GLIMPSE and MIPSGAL covered the Galactic plane,an infrared dark cloud(IRDC) located southwest to M17 came into common interest.With the name M17 SWex,this IRDC was first studied by Povich &Whitney (2010) who identified numerous candidate YSOs within M17 SWex (see also Povich et al.2016).The large-scale CO gas of M17 and M17 SWex share common molecular gas radial velocity (Elmegreen et al.1979;Nguyen-Luong et al.2020),indicating that M17 and M17 SWex are parts of the entire M17 cloud complex.Shimoikura et al.(2019)observed M17 SWex with the 45 m Nobeyama radio telescope in12CO,13CO,C18O,CCS,and N2H+emission lines in 93–115 GHz,and detected 46 dense cores (mostly gravitationally stable) within M17 SWex.Two extended green objects(EGO) G14.33–00.64 and G14.64–00.57 were detected toward M17 SWex (Towner et al.2019).EGO G14.33–00.64 is at a distance 1.12±0.13 kpc (Sato et al.2010),while EGO G14.64–00.57 is at a distance1.8-+300..0708kpc (Wu et al.2014).The molecular gas associated with EGO G14.64–00.57 and the bulk gas of M17 are coherent in VLSR≈19 km s−1(Shimoikura et al.2019;Nguyen-Luong et al.2020).EGO G14.64–00.57 is associated with both dense core 46 in Shimoikura et al.(2019)and hot core candidate G14.630–0.569 in Sato et al.(2021).These signposts for EGO G14.64–00.57 may hint earlier stage of high-mass star formation (Towner et al.2019) or formation of less massive stars resulting in radio-quiet infrared sources(Anderson et al.2014).Not far from EGO G14.64–00.57,three bright WISE sources are classified as radio-quiet H II region candidates (Anderson et al.2014).These sources are also coinciding with an IR bubble Jayasinghe et al.(2019).The IR brightness and morphology hint the existence of embedded massive stars.
In this paper we report the discoveries of new OB star candidates that are still embedded within the molecular gas of the M17 cloud complex.Two candidates are identified as shortperiod EBs from the multiepoch and multiband photometric observations.This paper is organized as follows:Section 2 describes the observations and uses public data;in Section 3,the new radio-quiet H II region in M17 SWex is presented;in Section 4,the most probable OB candidates associated with the H II are identified;in Section 5,the variabilities and parameters of OB binaries are analyzed.Finally,our conclusions are summarized in Section 6.
2.Observations and Public Data
2.1.The UKIRT near-IR Imaging Data
The UKIRT/WFCAM JHK observations of the M17 H II region were taken by the UKIRT telescope with the WFCAM near-IR camera on 2005 June 1–4 under the project U/05A/J2,and the H21–0 S(1) narrow filter observations were taken by the same camera on 2008 May 21 and 23 under the project U/08A/H59.The reduced JHK and H2images were directly retrieved from the WFCAM Science Archive.5http://wsa.roe.ac.uk/index.htmlThe total exposure time of the JHK and H2images is 2520 s,2160 s,2160 s,and 800 s,respectively.
2.2.High-cadence Optical Observations
We carried out high-cadence time-series photometric observations of the H II region candidates in M17,using the 0.8 m Yaoan high precision telescope (hereafter YAHPT) at Purple Mountain Observatory.The YAHPT is equipped with a 2048×2048 CCD and the field of view is aboutThe Johnson-Cousions filters V,Rc,and Icwere used and the exposure times are all 30 s in these filters.Multiband images were obtained on 11 nights with good weather from 2021 July 7 to August 7.Aperture photometry was performed on the multiband images obtained in these nights.
2.3.Public Survey Data
The Gaia Early Data Release 3 (Gaia EDR3;Gaia Collaboration et al.2021) provides astrometric solutions for about 1.3 billion stars in the Galaxy.The limiting magnitude of Gaia EDR3 is about 21 mag.The typical uncertainties of the positions,parallaxes,and proper motions at G=20 mag are 0.4 mas,0.5 mas,and 0.5 mas yr−1,respectively.
The Zwicky Transient Facility (ZTF;Bellm et al.2019;Masci et al.2019) is a northern-sky synoptic survey using the Palomar 48 inch Schmidt Telescope.Aided by the wide-field camera with an FOV of 47 deg2,ZTF is able to scan the entire northern sky in two nights,and to achieve a depth of 20.5 mag with 30 s exposure time in the three custom-made filters gZTF,rZTF,and iZTF.The multiepoch photometric data of ZTF in the gZTFand rZTFfilters were used in this paper.
The SuperCOSMOS Hα Survey (SHS;Parker et al.2005)provides the online digital atlas of the AAO/UKST Hα survey for the southern Galactic Plane and Magellanic Clouds.The narrow band Hα image is a good tracer of diffuse ionized gas.
The Galactic Legacy Infrared Mid-Plane Survey Extraordinaire (GLIMPSE) survey (Benjamin et al.2003;Churchwell et al.2009) is a legacy science program of the Spitzer Space Telescope,and provides the inner Galactic plane survey in 3.6,4.5,5.8 and 8.0 μm bands with angular resolution aboutthe Spitzer 8 μm band,the PAH emission and warm dust emission are prominent.We used the Spitzer 8 μm image to trace the area in the vicinity of embedded OB stars.
3.The New Radio-quiet H II Region in the Southwest to M17
As shown in the left panel of Figure 1,the JHK colorcomposite image of 1 deg2area is centered on the bright M17 H II region.The majority of M17 SWex IRDC is located far to the southwest and thus is out of the 1 deg2area.In the lower right corner of the left panel of Figure 1,an area of high extinction is obviously seen in the JHK color-composite image.This high extinction area is corresponding to the most eastern part of the M17 SWex IRDC in the frame of galactic coordinate.The closeup view of this high extinction area is shown in the right panel of Figure 1,which is composite of Hα image,H22.12 μm image,and Spitzer 8.0 μm image.EGO G14.64–00.57 is lying on the outer border of bright rim seen in the Spitzer 8.0 μm image,where the 1.2 mm continuum peak is coinciding with the molecular dense core 46 in Shimoikura et al.(2019)and hot core candidate G14.630–0.569 in Sato et al.(2021).
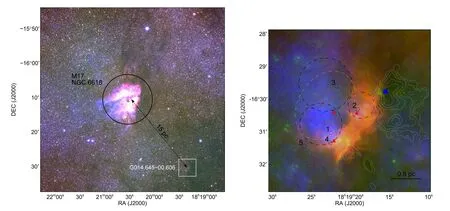
Figure 1.Color-composite image of M17 from UKIDSS (blue:J,green:H,and red:K) and G014.645–00.606 (blue:Hα,green:H2,and red:8 μm).In the right panel,the cloud is overlaid with the 1.2 mm continuum emission contours (Rygl et al.2010).The dashed oval indicates IR bubble identified by Jayasinghe et al.(2019).The three dashed circles indicate three circular bubbles in 8 μm band.The blue square indicates the 22 GHz water maser in the cloud(Jaffe et al.1981;Palagi et al.1993).The black circles with IDs indicate the OB candidates.The red triangles indicate three WISE sources (Anderson et al.2014).The black line segment represents the view of 0.5 pc at a distance of 1.83 kpc.
The IR bubble identified in Jayasinghe et al.(2019)is shown as the dashed ellipse with a major axis ofThe IR bubble outlines the border of the bright rim seen in the Spitzer 8 μm image.A single star-driven bubble may not be able to form this complex profile,which may consist of multiple bubbles with different ages and distances.The Spitzer 8 μm image clearly presents three smaller circular bubbles of radii less than 0.5 pc,which are shown as black dashed-line circles.The circles are extended by the arched bright rims,and the bubble-1,bubble-2,and bubble-3 contains stellar source 1,source 2,and source 3 in line of sight,respectively.The IR elliptical bubble in Jayasinghe et al.(2019) seems to consist of the two larger circular bubbles(bubble-1 and bubble-3)outlined in this work.The smaller circular bubble (bubble-2) is within the 8.0 μm bright rim.As shown in the red triangles,two of the three WISE H II region candidates in Anderson et al.(2014)are lying on the border of the 8.0 μm bright rim,with the third one within the IR elliptical bubble.Two WISE H II region candidates are coinciding with the edges of two circular bubbles (bubble-1 and bubble-2).Around the IR bubble,diffuse Hα emissions extend to the northeast,in which direction little mid-IR emission is observed,indicative of little dust and gas.The Hα emission within bubble-1 is very clear,while the Hα emission around bubble-2 and bubble-3 is weak.The bubbles seen at 8 μm and extended Hα emission within the cavities of bubbles indicate the existence of massive stars.
The three WISE H II candidates are classified as radio-quiet because of the absence of radio continuum sources (Anderson et al.2014).The sensitivity of the MAGPIS 20 cm survey is 1–2 mJy (Helfand et al.2006).We assume an upper limit of 4 mJy at 20 cm for the three WISE H II candidates.From this upper limit of radio continuum emission,we can estimate the upper limit of the number of ionizing photons in this region.The number of ionizing photons was represented by Carpenter et al.(1990) as
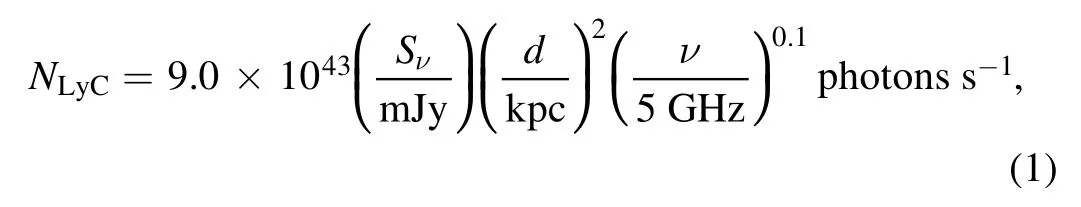
where Sνis the integrated flux density of radio continuum emission.Sν≤4 mJy leads to NLyC≤1.0×1045photons s−1when d=1.8 kpc and ν=1.4 GHz.According to the rates of Lyman and dissociating photons (Table 1 in Diaz-Miller et al.1998),a ZAMS star of effective temperature about 23,000 K could emit such amount of ionizing photons.The putative OB stars within the IR bubbles are not much hotter than 23,000 K,or equivalently not earlier than B1V.
This radio-quiet H II region candidate,named as G014.645–00.606,is located at the middle between the M17 H II region and M17SWex IRDC.In the following we will locate the massive star candidates of G014.645–00.606 based on the multiband photometric data and Gaia EDR3 astrometric data.
4.Massive Star Candidates of G014.645–00.606
4.1.Selection of OB Candidates
The left panel of Figure 2 shows the JHK color-composite image of G014.645–00.606.The nebula only seen in the K band image is consistent with the 8.0 μm bright rim.The five brightest stars in the K band are close to the IR bubbles,as the red circles shown in the three panels.The parallax and the proper motions in R.A.and decl.of the EGO G14.64–00.57 were measured as 0.546±0.022 mas and (0.22±1.20,−2.07±1.20)mas yr−1(Wu et al.2014).Because of the close relation between EGO G14.64–00.57 and the IR bubbles,we suggest that the massive star candidates have parallaxes similar to that of EGO G14.64–00.57.We have made use of the Gaia EDR3 data to identify the candidates,and the parallaxes of stars within a radius of 5′ are constrained by conditions ϖ/σ(ϖ)≥5 andSome stars with similar proper motions may form a cluster,and the proper motions are concentrated in (0.2,−1.7)mas yr−1with a radius less than 1.0 mas yr−1.The cluster may be associated with EGO G14.64–00.57,and they have a similar proper motion.Thus,the stars with the parallax constraints are considered when the difference between stellar proper motions and the proper motion (0.2,−1.7)mas yr−1is less than 2.0 mas yr−1.A total of 52 stars are close to EGO G14.64–00.57 in the parallax and proper motion.The gray points in the middle and the right panels of Figure 2 show the proper motions and the parallaxes of the selected stars from Gaia EDR3,respectively.Then we introduce the second criterion that the absolute magnitude of massive star candidates should be analogous to the bona fide OB stars.
We have used the photometric results of ZTF in the gZTFand rZTFbands to estimate the absolute magnitude.Figure 3 is the color–magnitude diagram (CMD) with the g−r color as the horizontal axis and thevalue as the vertical axis,where D is the distance computed from the Gaia EDR3 parallax.The magnitudes and colors here have been converted from ZTF photometric system to Pan-STARRS1 (PS1;Chambers et al.2016) photometric system,as shown in Appendix A,to match the photometric system in CMD 3.5(Marigo et al.2017;Pastorelli et al.2019).The distributions of the sources in Figure 3 show two groups,the low-mass group lying close to the main-sequence locus in the mass range 0.6–1.5 M⊙,and the higher-mass group lying in the lower right region where the extinction is also higher.Eight sources are lying within the mass range 3–12 M⊙,including the five luminous stars close to the IR bubbles.The other three stars that are far from the bubbles may not be relevant to the bubbles.

Figure 2.Candidate OBs selections around G014.645–00.606.A color-composite image presents the photometric observations of G014.645–00.606 from UKIDSS(blue:J,green:H,and red:Ks).The red circles and black IDs indicate the five OB candidates (brightest stars) in the K band.In the middle panel,the big circle represents the area to select OB candidates,and the dashed box indicates the zoom-in area of the right panel in Figure 1.The green diamonds indicate the three OB candidates far from IR bubbles.The blue square indicates the 22 GHz water maser,which has a trigonometric parallax of 0.546±0.022 mas,measured by BeSSeL Survey of the VLBA(Wu et al.2014).The gray points within a 5′radius circle indicate the stars selected from Gaia EDR3,and the arrows indicate the proper motions.The parallaxes and errors of the stars are represented in the right panel.
Since the position of a star in CMD is constrained by the mass and age of the star,we have estimated the masses of the five stars on different isochrones along the extinction vector AVin Figure 3.The visual extinction AVis treated as a free parameter.The convention between AVand the extinction in the g and r bands is Ag/AV=1.155 and Ar/AV=0.843 (Wang &Chen 2019),respectively.Assuming a value of AV,the extinction Arin the r band is then computed according to the corresponding ratio.The stellar mass inferred from the CMD strongly depends on the assumed age.Based on the isochrones of 1 Gyr,100 Myr,and 10 Myr in Figure 3,the masses of the five stars are estimated to be in the range of about 2 M⊙,4–5 M⊙,and 5–12 M⊙,respectively.At the assumed age of 10 Myr,the five stars fall into the types of early-B stars.We have estimated the stellar parameters,such as mass,temperature,and extinction of the five stars according to the 10 Myr isochrone,as listed in Table 1.
Sources 2,4 and 5 are OB candidates earlier than B3V classified by Chen et al.(2019).The three candidates are identified from the VPHAS+data via the color–color diagram.The different results between this work and Chen et al.(2019)may be due to the different photometric data and selection method of OB candidates.In addition,we considered the distance in the CMD,and sources 1 and 3 are then classified as OB candidates.
4.2.The Most Probable OB Stars Associated with the Radio-quiet H II Region G014.645–00.606
Because there are obvious Hα emissions and mid-IR radiation around the sources 1,2,and 3 in Figure 1,they may be associated with the corresponding bubbles and cause Hα emissions and mid-IR radiation to form the bright rim.Source 1 is wrapped by the brightest Hα emissions in bubble-1 with a radius of 0.35 pc,and has a closer distance of about 0.12 pc to the mid-IR rim.The Hα emissions extend in a gradient weakening to the northeast,which suggest that source 1 is one of OB stars excited the H II region.Sources 2 and 3 are in bubbles of radius 0.22 pc and 0.44 pc respectively,and accompanied by the relatively weak Hα emissions.However,source 4 lies on the boundary of bubble-1,and its relation to surrounding radiation is not clear.The ionization characteristics of source 4 may be obscured by those of source 1 due to the larger distance.Source 5 is outside the boundary of bubble-1 and may not be directly related to ionized region.
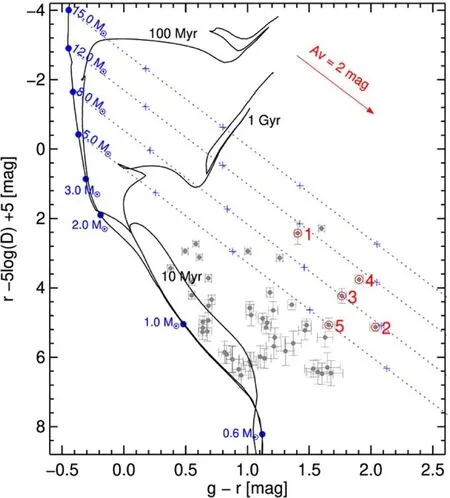
Figure 3.The CMD for the selected stars.The gray points with errors denote the selected stars from Gaia EDR3 in the circle region of Figure 2.The potential OB stars are marked by red circles and IDs.The black curves present isochrones of 10 Myr,100 Myr,and 1 Gyr,and the blue points indicate the stellar mass in MS from 0.1 M⊙to 15.0 M⊙,obtained from CMD 3.5 (Marigo et al.2017;Pastorelli et al.2019).The red arrow denotes the extinction vector AV.The distances,D,of the stars are obtained by the corresponding parallaxes in Gaia EDR3.
Given that an OB star drives H II region,the H II region expands rapidly to an equilibrium state as the Strömgren sphere with a radius (Krumholz et al.2007) of
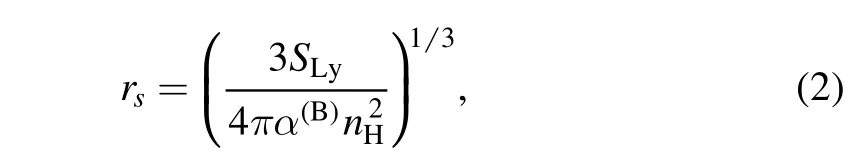
where α(B)is the case B recombination coefficient,(Osterbrock 1989)at a gas temperature T.The nHis the density of neutral gas.Assuming a typical value of nH=100 cm−3in Galactic molecular clouds,the ionized gas temperature of 8000 K(Krumholz et al.2007),and NLyC≤1.0×1045photons s−1,the Strömgren radius of H II region is computed as 0.1 pc.An early-B star with a temperature of about 23,000 K can drive the H II region with a radius of 0.1 pc and a number of ionizing photons 1.0×1045photons s−1.The radii of the bubbles around sources 1,2,and 3 seem larger than the Strömgren radius of early B-type stars,which could be the result of the expansion of the H II regions.The radius increases with time and strongly depends on the surrounding.When the H II region expands,the temperature of the inner gas is higher than that of the surrounding cloud material,and the ionization front expands under the pressure inside the ionized gas (Geen et al.2020).From the positions and radii of the bubbles,we believe that sources 1,2 and 3 could be the most early B-type stars driving the bubbles.
5.Early-B Eclipsing Binaries
We have compared the early-B candidates(sources 1,2,and 3) with the public catalog of variable stars,and found that source 1 is a known variable star V1963 Sgr in the General Catalog of Variable Stars (GCVS;Samus’ et al.2017),International Variable Star Index (VSX;Watson et al.2006),and All-Sky Automated Survey for Supernovae (ASAS-SN;Jayasinghe et al.2018),as listed in Table 2.Source 1 is an eclipsing binary of Algol type (EA) classified by GCVS and VSX,while it seems an eclipsing binary of W Ursae Majoris type (EW) from the light curves of ASAS-SN.We have analyzed the variabilities of the binaries in this section,including period and variability type,color variability,physical parameters,and long-term variation of the period.
5.1.Period and Variability Type
In order to research the variability of the three early-B candidates,we have used the time-series photometric observations of ZTF,which covered from 2018 May to 2021 June,and about 100 observations in the gZTFband and 200 observations in the rZTFband.The mutilband Analysis of Variance (AoV;Mondrik et al.2015) method is used to analyze observations,and the sampling frequency is set to 0.1–10 day−1under a frequency spacing of Δf=1.0×10⁻⁵.The folded light curves of sources 1 and 2 show significant amplitude and periodic variations,while those of source 3 show no obvious amplitude and periodic variation.The amplitudes of the light curves are about 0.9 mag and 0.3 mag for sources 1 and 2,respectively.The periodic analyses of sources 1 and 2 are shown in Figures 4 and 5,respectively.Due to the coincidence of the primary and secondary eclipses of binary stars,the half periods of the binary stars can be calculated from the optimal frequency of the AoV method,and the period of sources 1 and 2 is 0.82508 day and 0.91938 day,respectively.The typical photometric errors of source 1 are less than 0.02 mag in the two bands,while the typical photometric errors of source 2 are 0.05 mag in gZTFand 0.02 mag in rZTFbands.
We have used the high-cadence observation of YAHPT in V,Rc,and Icbands (as listed in Table 4) to verify the periods of sources 1 and 2.The typical photometric errors of source 1 are less than 0.02 mag in the three bands.For source 2,the photometric data in the V band is not used due to unavailable photometric quality,the photometric data in Rcand Icbands with errors less than 0.03 mag have been used.The same periodic analysis is applied to the three bands,which have about 300 observations in each band.The periods of sources 1 and 2 are 0.82532 day and 0.91988 day,which are slightly different from the previous results and suggest a long-term variation of the periods (in Section 5.4).
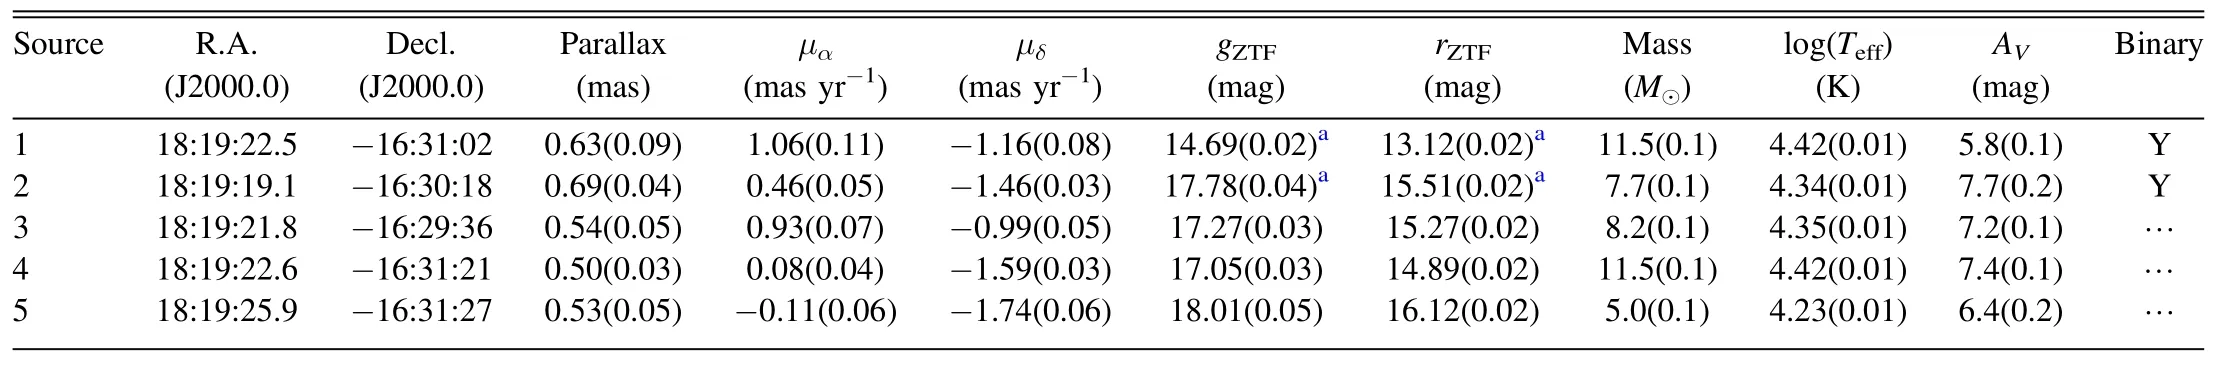
Table 1 OB Candidates
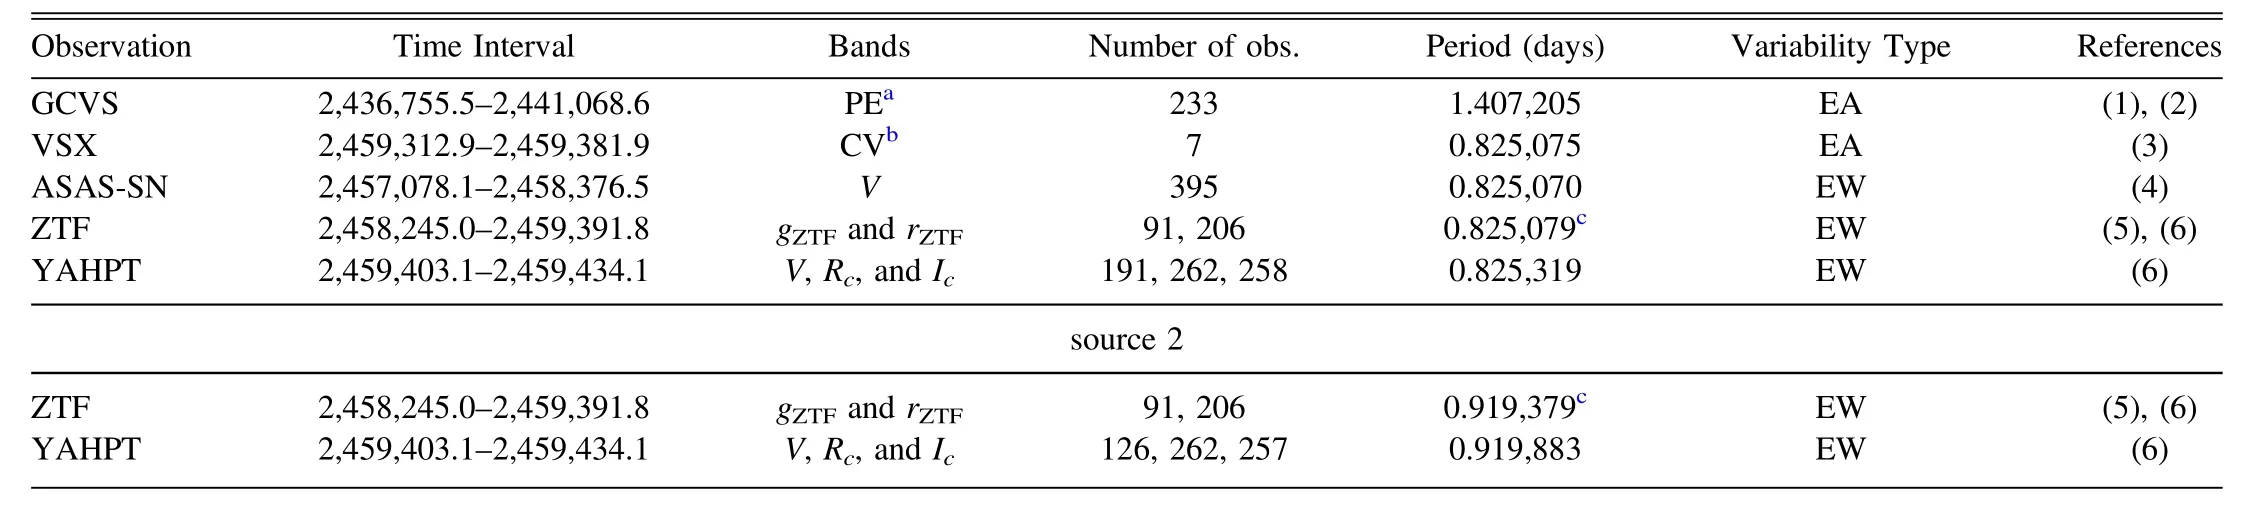
Table 2 The Observations of Sources 1 and 2
As shown in Figure 4,the folded light curves indicate an EW-type binary system of source 1,and the same primary and secondary eclipses imply that the two components have nearly the same stellar temperatures.In Figure 5,source 2 is a newly discovered binary system,whose primary and secondary eclipses are different in amplitude,and the temperatures of the components are definitely different.As the short-period B-type EBs,they are important due to rarely found so far.In a new catalog of OBA-type stars observed by TESS,there are 3425 EBs and 737 B-type EBs,and only 57 B-type EBs have a period of less than 1.0 day (IJspeert et al.2021).

Figure 4.Light curves,periodograms,and folded light curves of source 1.The first and second rows are the periodic analysis results from ZTF and YAHPT observations,respectively.The typical photometric errors are less than 0.02 mag in gZTF,rZTF,V,Rc,and Ic bands.
5.2.Color Variability
Color variability of eclipsing binary shows a particular pattern in the CMD,as described by Gaia Collaboration et al.(2019).The variability of eclipsing binary systems induces linear motions in a time-dependent CMD,and the motions are vertical with great amplitudes in magnitude and small amplitudes in color,as shown in Figure 6.
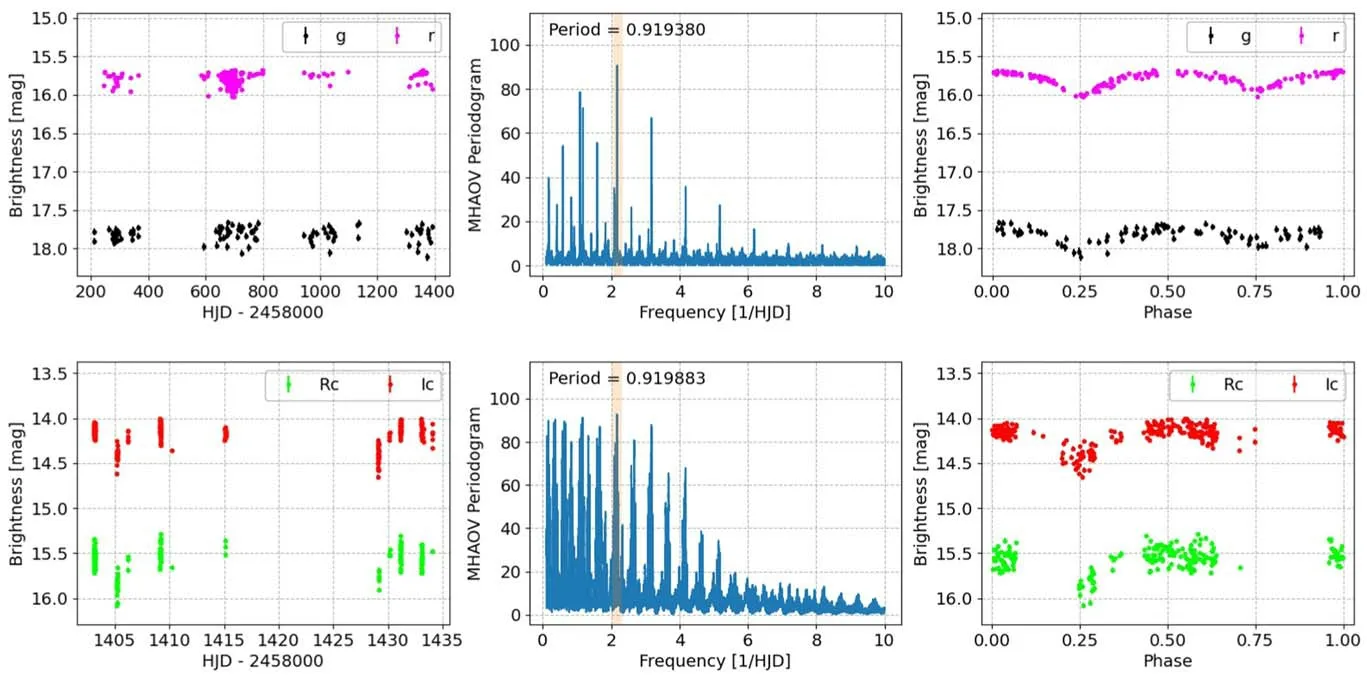
Figure 5.Light curves,periodograms,and folded light curves of source 2.The typical photometric errors are less than 0.02 mag in the rZTF band,less than 0.03 mag in Rc and Ic bands,and less than 0.05 mag in the gZTF band.
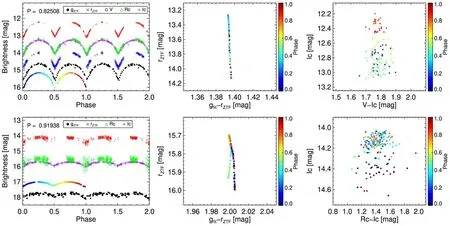
Figure 6.Color variability of sources 1 and 2.The first column shows the folded light curves in gZTF,rZTF,V,Rc,and Ic,and the fitting results(gfit +constant)of gZTF are indicated by color,gfit+0.5 for source 1 and gfit−0.7 for source 2.The second column shows the CMDs constructed from gfit and rZTF,where phase is indicated by color.The third column shows the CMDs constructed from V,Rc and Ic in YAHPT observations,and the phase is indicated by color.The typical error is less than 0.02 mag for gfit−rZTF and 0.06 mag for Rc−Ic,respectively.

Figure 7.Light-curve modeling results of sources 1 and 2.The black points and purple crosses represent the observations in gZTF and rZTF.The curves denote the corresponding fitting results.The residuals (δgZTF−0.2 and δrZTF−0.1) are shown at the bottom of the figures.
We have used ZTF and YAHPT observations to produce the color variability of eclipsing binaries in CMDs respectively.Due to non-simultaneous observations between gZTFand rZTF,a model result of the eclipsing binary systems in gZTFband in Section 5.3 is used to compute the color gZTF−rZTF.For the colors of YAHPT observation,V−Icand Rc−Ic,the two pair observations would be selected when their time interval is less than 0.001 day,which is far less than the limitation of the pattern variations caused by non-simultaneous observation(Yin et al.2021).
As expected,the vertical motions of sources 1 and 2 induced by color variability in CMD are caused by the eclipsing of the binaries.Because stellar rotation could cause the motions with a smaller amplitude in magnitude,and the extinction could cause the motions in the direction of the extinction vector(Gaia Collaboration et al.2019),the motions of sources 1 and 2 are not caused by the rotation and extinction of the star.Due to the smaller error in rZTFband and the introduction of the fitting result in the gZTFband,the motions of the ZTF observations are more convergence than those of YAHPT observations.The nearly invariable colors of source 1 suggested the two components have almost the same temperature,while the apparent dispersion in the color variability of source 2 may be ascribed to the eclipsing of the two components with different temperatures.
According to Table 5 of Pecaut&Mamajek(2013),we have estimated the SpTs of the binaries sources 1 and 2 from the effective temperatures of Table 1.The SpTs of the binaries sources 1 and 2 are B1V and B1.5V,respectively.However,the SpT of source 1 was classified as F8/G0e+F/G? by Halbedel (1984),and the spectrum appears veiled and composite with a Hβ emission peak and some double emissions.The spectral divergence may be caused by the envelope extinction of of the contact binary system,and the spectrum was veiled by the envelope of the contact binary source 1.For the components of binary systems,the brightness of the primary star will be lower.We have estimated the primary temperature(T1)and the secondary temperature(T2)in CMD,based on the estimated temperature ratios(T2/T1)of the light curves.The temperature ratios of sources 1 and 2 are about 1.0 and 0.8,and the primary temperatures of sources1 and 2 are estimated to be 23,513 K and 20,145 K,equivalent to SpTs of B2V and B2V,respectively.
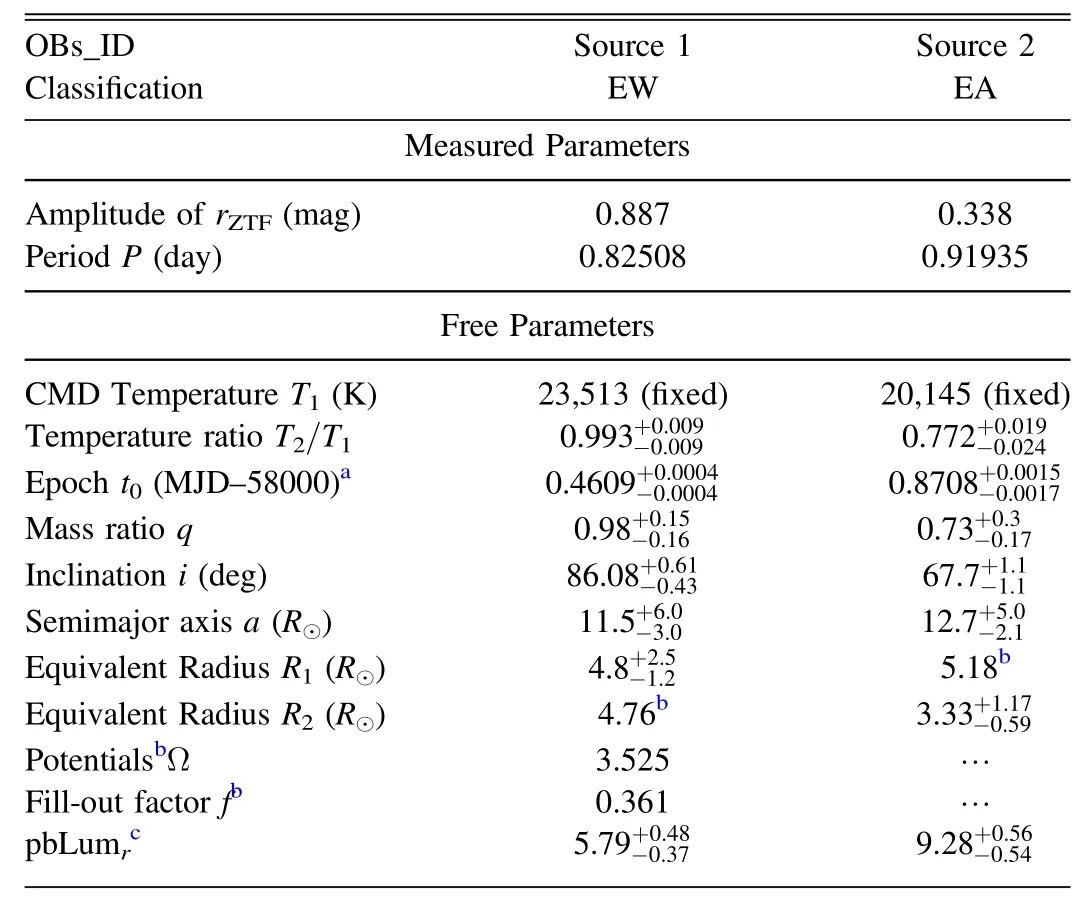
Table 3 The Parameters of the Modeled Binary Systems
5.3.Modeling of Eclipsing Binaries
We have used the PHysics of Eclipsing BinariEs(PHOEBE;Prša &Zwitter 2005) to derive the parameters of the eclipsing binaries found with the ZTF observations.The PHOEBE,based on the Wilson–Devinney code (Wilson &Devinney 1971)is often used to reproduce and fit the light curves,radial velocity curves,and spectral line profiles of eclipsing systems though modeling eclipse events (Prša et al.2016).
PHOEBE provides default values for the parameters of the binary systems,and contains free parameters and read-only parameters due to built-in constraints (Conroy et al.2020).In this work,the built-in constraints have been preserved to keep the model within the real of physical solutions,and the values of some free parameters are obtained from the observations,as shown in Table 3.The periods (P),effective temperature of each primary star (T1),and extinction (AV) values obtained from previous analysis are used.The AVis used to adjust the observed luminosity ratio to the intrinsic luminosity ratio between gZTFand rZTFbands.The fluxes in the gZTFand rZTFbands are used as the“data set-coupled”mode of the PHOEBE model,which means the same scaling factor of passband luminosity to be applied to two different data sets,and the gZTFfluxes are bound to the rZTFfluxes.Because the CMD temperatures of the components are all above 6000 K,the bolometric gravity brightening,g=1.0,and albedo,A=1.0,values suggested by PHOEBE are used when modeling the light curves.The eccentricity(Ecc)of the contact binary source 1 and semi-detached binary source 2 is set to a default value of zero.
After optimizing and determining a reasonable starting model by hand,the fitting models to the light curves of sources 1 and 2 are performed via an affine-invariant Markov chain Monte Carlo ensemble sampling code EMCEE (Foreman-Mackey et al.2013).We have used the uniform priors for the free parameters in Table 3,and set 1200 steps and 20 walkers for sampling the parameter space to explore the posterior distributions of the free parameters.Due to the different variability types of sources 1 and 2,the models of sources 1 and 2 are configured as contact binary system and semidetached binary system respectively.The optimized parameter estimates and the uncertainties of posterior density are listed in Table 3,and the posterior distributions are illustrated in Appendix B.The optimized light curve models constructed from these parameters are shown in Figure 7.Due to the mass ratio of 0.98,the temperature ratio of 0.993,and about 4.8 R⊙radii of primary and secondary stars,source 1 could be a twin binary.From the fill-out factor of envelope 0.361,the twin binary system has contact with a common envelope,and the mass exchange may have occurred.
5.4.Possible Decrease of Orbiting Period of Source 1
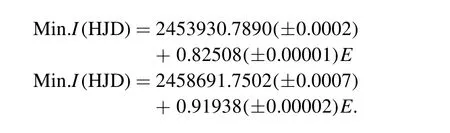
The temporal variation in the period of EB provides useful information about mass transfer,presence of third body,and other characteristics.We have used the O−C Diagram to study the temporal variation of EB period,some of the minimum times(O)of source 1 are obtained from the Eclipsing Binaries Minima Database6http://var2.astro.cz/ocgate/(Paschke &Brat 2006).Based on the observations of rZTF,V,Rc,and Ic bands in Table 4,the minima and uncertainties of sources 1 and 2 are calculated by using Nelson’s polynomial fitting program,7Software by Bob Nelson,http://binaries.boulder.swri.edu/binaries/software/.which was developed by the method of Kwee &van Woerden (1956).As shown in Table 5 and Figure 8,six new minima are derived,including five minimum times (three primary,P-type,and two secondary,S-type,minima) for source 1 and one P-type minimum time for source 2.The calculated times can be expressed as C=T0+P×E,where E is the epoch number represented as the integer value of (O−T0)/P and its decimal number corresponds to the O−C value.As the recent period results of source 1 are about 0.825 day,we adopt the previous maximum epoch of T0=2453930.789 and the period of P=0.82508 day in Krajci(2007).The ephemerides of sources 1 and 2 are as follows:
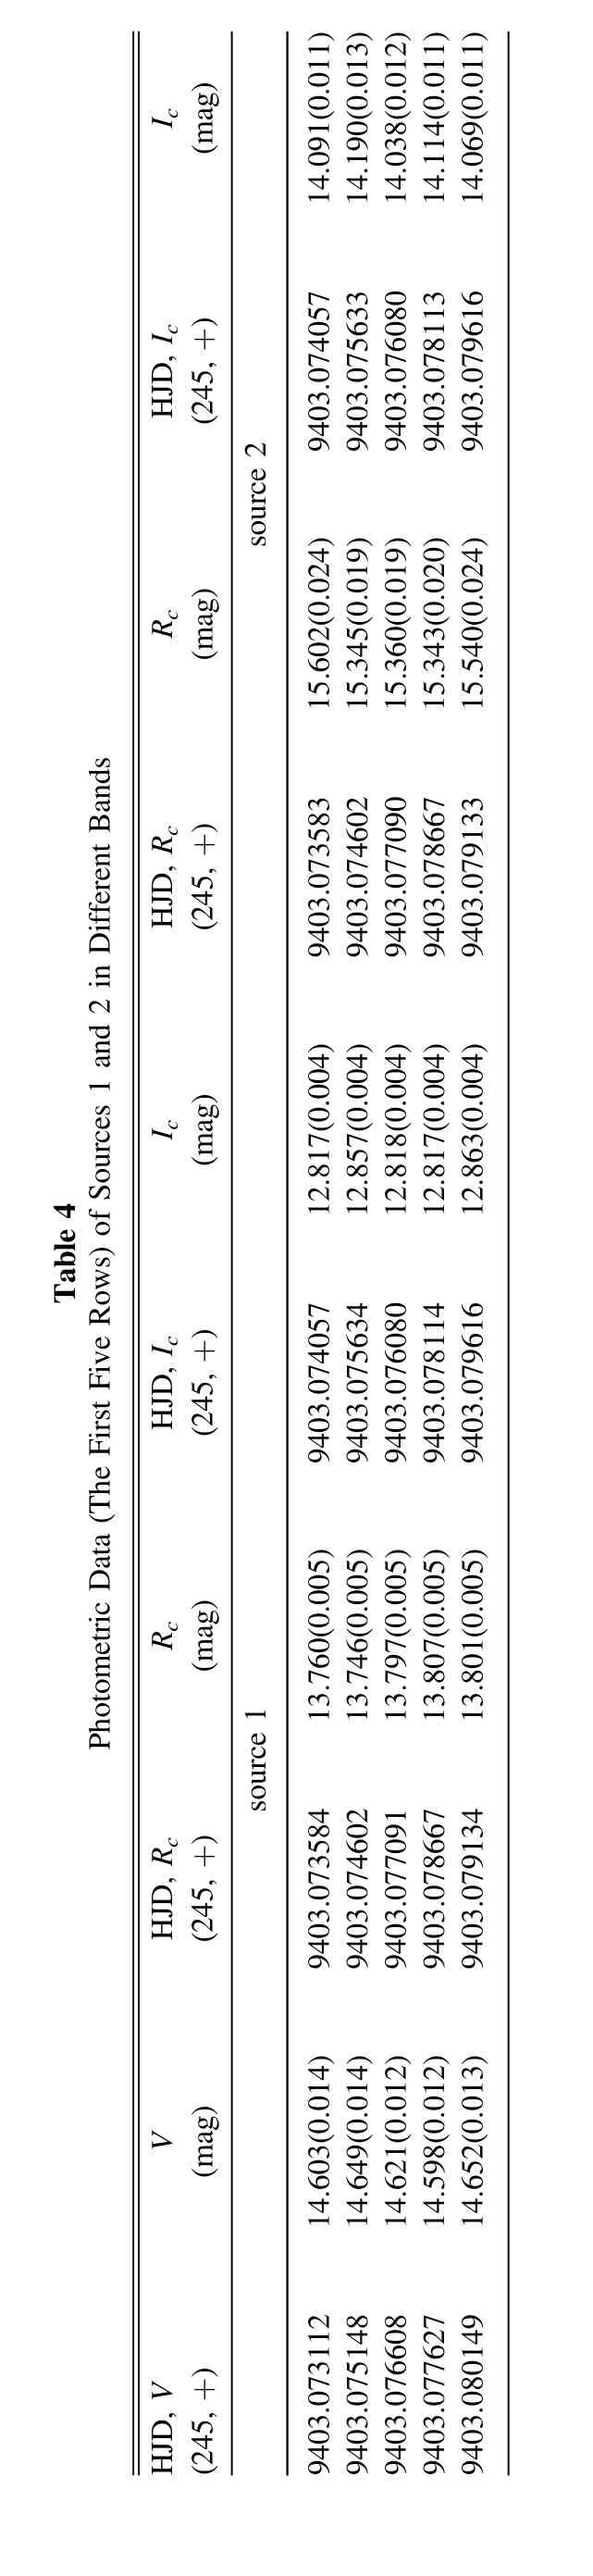
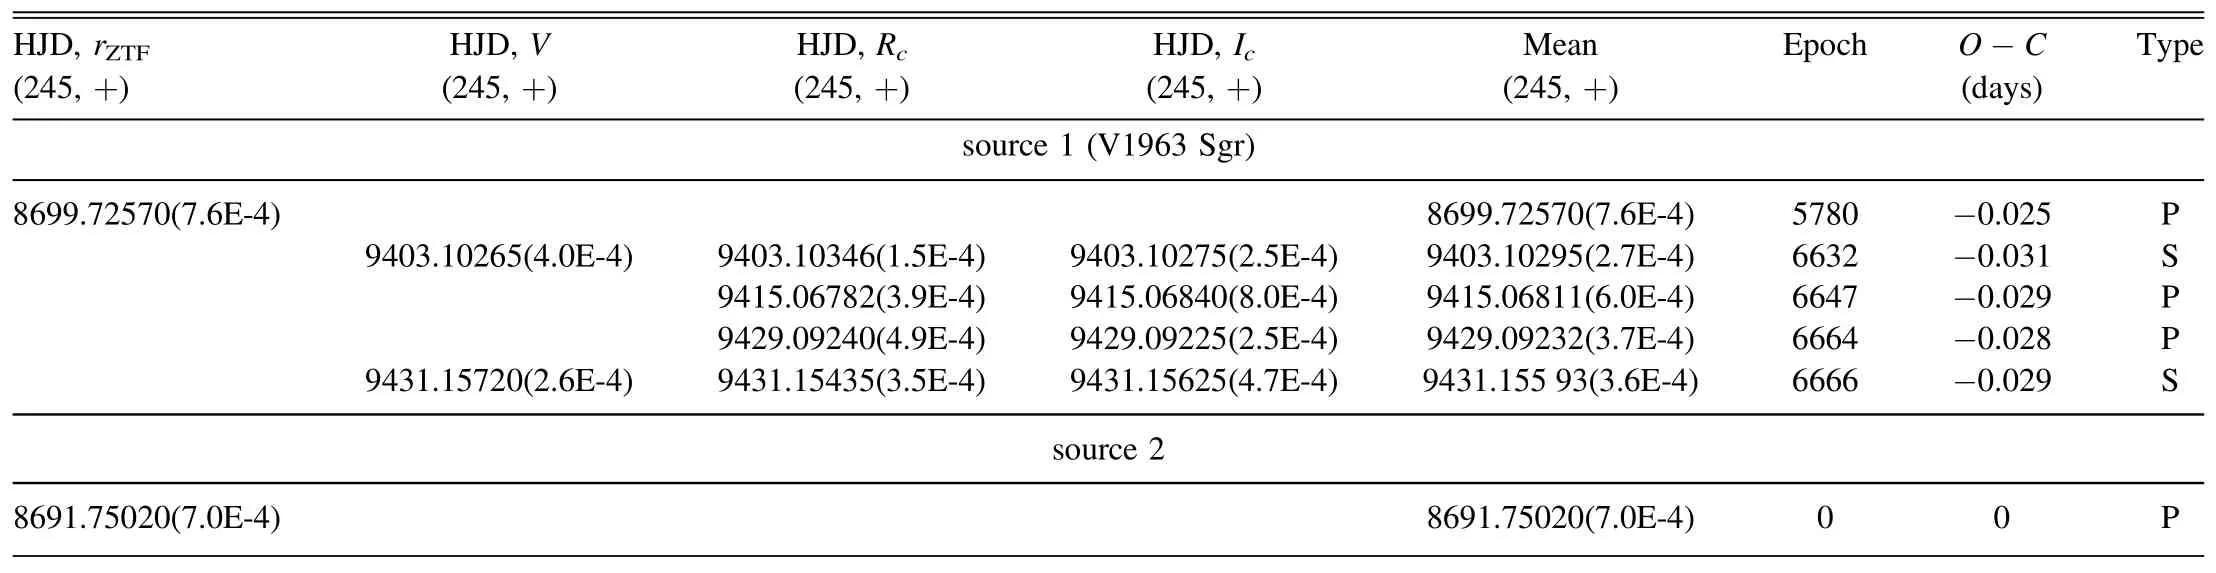
Table 5 The New Minimum Times of Sources 1 and 2 in Different Bands
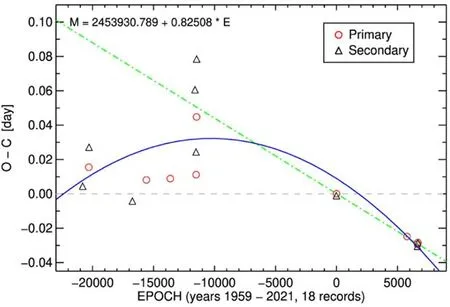
Figure 8.The O−C diagram for the minimum time of source 1.The last five points are calculated from the ZTF and YAHPT observations,and the points in front are from Maffei &Tosti (1991) and Krajci (2007).The blue line shows the parabolic fitting result of O−C values.The green dotted-and-dashed line shows the line fitting result of the last seven O−C values.
As shown in Figure 8,the O−C values of source 1 cover more than six decades,and show a period decrease in recent decades.The aperiodic behavior does not support the third body case that causes the periodic variation,and may be attributed to mass transfer or mass loss from one component to the other (Lame’E et al.2010).The O−C values of source 1 can be fitted by a downward parabolic curve,which can be represented by the following equation:
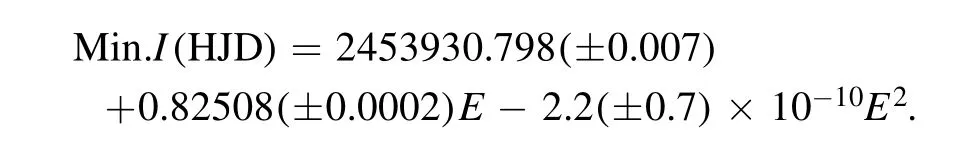
The quadratic term,−2.2×10⁻¹⁰,means that the orbital period decreases at a rate of−2.0(±0.6)×10−7days yr−1.Due to q <1 derived in Section 5.3,the period change rate of source 1 suggests that the mass transfer is taking place from the primary to secondary component and causes the orbit to shrink(Negu &Tessema 2015).
Unfortunately,the photometric uncertainty in the study of Maffei &Tosti (1991) is about 0.25 mag,the O−C values may have a large deviation.Based on the O−C values of Krajci (2007) and this work,the orbital period decreases at a rate of−1.90(±0.01)×10−3days yr−1,as the green dottedand-dashed line shown in Figure 8.The negative slope points to a real period that is shorter than the used period(Sterken 2005).However,such a small number of data is insufficient to account for the result,the variant pattern of orbital period needs to be confirmed by more observations.
6.Conclusions
In this work,we have used the Hα and IR images,astrometric information of Gaia EDR3,and ZTF photometric observations to identify OB candidates in the radio-quiet H II region G014.645–00.606 in M17SWex,and found that three bright stars (sources 1,2 and 3) are the most likely candidates related to the H II region and located in the mid-IR bubbles.The three candidates are identified as early B-type stars,which can drive the observed IR bubbles with a radius of about 0.2 pc and a number of ionized photons of about 1045photons s−1.
We have made use of the ZTF and YAHPT time-series photometric observations to analyze the variabilities of the candidates.Based on the AoV method,source 1 (V1963 Sgr)and source 2 are proven to be EBs,source 1 is an EW type star with a period of 0.82508 day,and source 2 is an EA type star with a period of 0.91935 day.From the brightness of the two binary systems in CMD,the primary temperature of sources 1 and 2 is about 23,000 K and 20,000 K respectively.The physical parameters have been fitted by PHOEBE model from light curves and showed that source 1 could be a twin binary.The new minimum times of sources 1 and 2 are added,and the period of source 1 show long-term variations in the O−C diagram.The orbital period of source 1 decreases at a rate of−2.0(±0.6)×10−7days yr−1,suggesting mass exchange between the components.However,the number of the minimum times in the O−C diagram is still small,the variant pattern of orbital period needs more observation to be confirmed.
The massive binary systems associated with H II regions provide us with more opportunities to study the evolution of massive stars,such as single star evolution or binary mergers.Our next work will be to establish the multiplicity properties of large samples of OB stars from the H II regions and statistically analyze the physical parameters to constraint the evolution mechanism of massive binary systems.
Acknowledgments
This work is supported by National Key Research &Development Program of China (2017YFA0402702).We acknowledge the science research grants from the China Manned Space Project with No.CMS-CSST-2021-B06.We acknowledge support from the general grants U2031202,11903083 and 11973004 of the National Natural Science Foundation of China.This research has made use of data provided by the Yaoan High Precision Telescope at Purple Mountain Observatory.This work has made use of data from the European Space Agency (ESA) mission Gaia(https://www.cosmos.esa.int/gaia),processed by the Gaia Data Processing and Analysis Consortium (DPAC;https://www.cosmos.esa.int/web/gaia/dpac/consortium).Funding for the DPAC has been provided by national institutions,in particular the institutions participating in the Gaia Multilateral Agreement.
Appendix A The Conversions between Photometric Systems
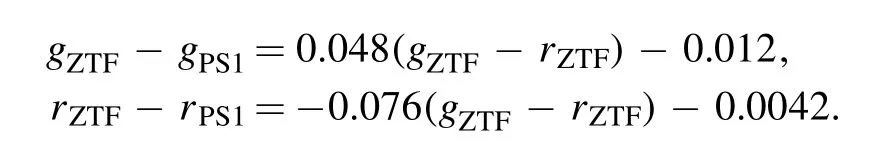
Since the mass lines and isochrones in ZTF photometric system were not provided by CMD 3.5 (Marigo et al.2017;Pastorelli et al.2019),those in PS1 (Chambers et al.2016)photometric system provided by CMD 3.5 are used in Section 4.1.To correct the stellar magnitudes from ZTF to PS1 photometric systems,the conversions between the two photometric systems derived from Medford et al.(2020) are used.The conversions are as follows:
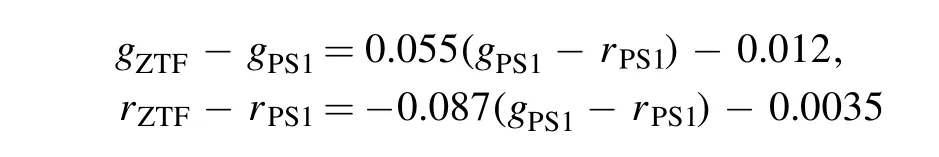
and were converted to:
Appendix B The PHOEBE Model Result
The posteriors and uncertainties for the physical parameters of sources 1 and 2 are presented in Figures A1 and A2,respectively.
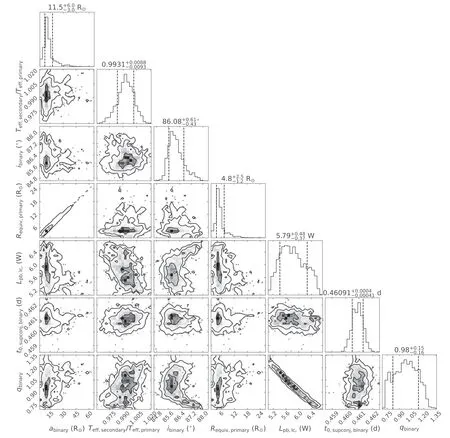
Figure A1.The posterior distributions for the physical parameters of source 1.The dashed lines in histogram plots denote 68%(1σ)confidence ranges.The contours in the probability density correspond to 1.0,2.0,and 3.0σ confidence intervals.
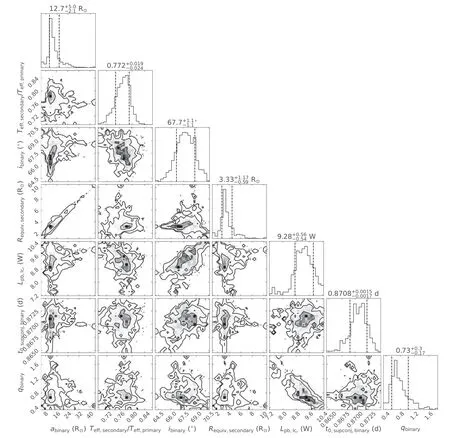
Figure A2.Same as Figure A1,but for the parameters of source 2.
ORCID iDs
杂志排行

Research in Astronomy and Astrophysics的其它文章
- The Precision Analysis of the Chinese VLBI Network in Probe Delay Measurement
- The Origin of The Soft X-Ray Excess in the Seyfert 1.5 Galaxy ESO 362-G18
- FAST Continuum Mapping of the SNR VRO 42.05.01
- Fast Radio Bursts as Crustal Dynamical Events Induced by Magnetic Field Evolution in Young Magnetars
- Is TOL 1326–379 a Prototype of γ-Ray Emitting FR0 Radio Galaxy?
- Precise Positions of Triton in 2010–2014 based on Gaia-DR2