Investigation of the compact torus plasma motion in the KTX-CTI device based on circuit analyses
2022-03-10QilongDONG董期龙DefengKONG孔德峰XiaoheWU邬潇河YangYE叶扬KunYANG杨坤TaoLAN兰涛ChenCHEN陈晨JieWU吴捷SenZHANG张森WenzheMAO毛文哲ZhihaoZHAO赵志豪FanweiMENG孟凡卫XiaohuiZHANG张小辉YanqingHUANG黄艳清WeiBAI白伟DezhengYANG杨德正FeiWEN文斐PengfeiZI訾鹏飞Le
Qilong DONG(董期龙),Defeng KONG(孔德峰),Xiaohe WU(邬潇河),Yang YE(叶扬),Kun YANG(杨坤),Tao LAN(兰涛),Chen CHEN(陈晨),Jie WU(吴捷),Sen ZHANG(张森),Wenzhe MAO(毛文哲),Zhihao ZHAO(赵志豪),Fanwei MENG(孟凡卫),Xiaohui ZHANG(张小辉),Yanqing HUANG(黄艳清),Wei BAI(白伟),Dezheng YANG(杨德正),Fei WEN(文斐),Pengfei ZI(訾鹏飞),Lei LI(李磊),Guanghai HU(胡广海),Shoubiao ZHANG(张寿彪) and Ge ZHUANG(庄革)
1 School of Science,Shihezi University,Shihezi 832003,People’s Republic of China
2 Institute of Energy,Hefei Comprehensive National Science Center,Hefei 230031,People’s Republic of China
3 Institute of Plasma Physics,Chinese Academy of Sciences,Hefei 230031,People’s Republic of China
4 Department of Plasma Physics and Fusion Engineering,University of Science and Technology of China,Hefei 230026,People’s Republic of China
5 School of Computer Science and Information Engineering,Hefei University of Technology,Hefei 230009,People’s Republic of China
6 College of Physics and Electronic Engineering,Hengyang Normal University,Hengyang 421008,People’s Republic of China
7 College of Electrical and Power Engineering,Taiyuan University of Technology,Taiyuan 030024,People’s Republic of China
Abstract Compact torus(CT)injection is one of the most promising methods for the central fuelling of next-generation reactor-grade fusion devices due to its high density,high velocity,and selfcontained magnetised structure.A newly compact torus injector(CTI)device in Keda Torus eXperiment(KTX),named KTX-CTI,was successfully developed and tested at the University of Science and Technology in China.In this study,first,we briefly introduce the basic principles and structure of KTX-CTI,and then,present an accurate circuit model that relies on nonlinear regression analysis(NRA)for studying the current waveform of the formation region.The current waveform,displacement,and velocity of CT plasma in the acceleration region are calculated using this NRA-based one-dimensional point model.The model results were in good agreement with the experiments.The next-step upgrading reference scheme of the KTX-CTI device is preliminarily investigated using this NRA-based point model.This research can provide insights for the development of experiments and future upgrades of the device.
Keywords:compact torus(CT),circuit modelling,nonlinear regression analysis(NRA),point model
1.Introduction
As a key target of next-step fusion devices,the China Fusion Engineering Test Reactor(CFETR)should achieve self-sufficiency in case of tritium,that is,a tritium breeding ratio(TBR)>1,for which,the tritium burn-up fraction(fburn-up)should be>3%[1,2].The latest results of the one-modelling framework for integrated tasks model show that as the fuelling(deuterium and tritium)peak location changes fromr/a=0.9 to 0.7,fburn-upincreases by approximately 70%,when density is fixed.With a fuelling deposition deeper thanr/a=0.75 and thermal diffusivity is fixed at 0.35,the energy confinement time is significantly prolonged andfburn-upcan exceed 3%,satisfying the TBR requirement for the self-sufficient operation of CFETR[3,4].Thus,central fuelling has become a key technical requirement for burning plasma.Conventional fuelling methods,such as gas puffing and cryogenic pellet injection,are considered inadequate for this purpose in future devices because the high temperature and density of core region lead to premature ionisation[5,6].CT injection based on the magnetised coaxial plasma guns principle can be used to overcome the penetration problem;however,it is currently a rare technology with potential for central fuelling in reactorgrade fusion devices[7-9].The schematic of the device structures and the basic principles of CT are depicted in figure 1.A solenoid is used to prepare a bias magnetic field(stuffing magnetic field),and the gas is puffed into the coaxial cylindrical electrode through valves.The formation bank capacitor discharges across the electrodes,ionizing the gas to form plasma and creates a toroidal magnetic field for CT.The radial currentcomponent,,passing through the CT plasma,interactswith the toroi dal field,being present in CT toproduce the Lorentz f orce,and then pushes the plasma down the formation electrodes[10].Simultaneously,the magnetic field lines are stretched and reconnected behind the plasma,forming the CT poloidal magnetic field.In the subsequent compression and acceleration regions,the CT is reaccelerated by a strong Lorentz force to reach an extremely high injection velocity.In addition,during the acceleration process,radial expansion is prevented due to a radial equilibrium force generated by the image current in the conducting walls[11].
Alfvén,Lindberg,and Mitlidet alfirst proposed CT technology as a fusion concept in 1960[12].In 1988,in the Ring ACcelerator Experiment(RACE)device of the Lawrence Livermore National Laboratory(LLNL),Hammeret aldeveloped a simple one-dimensional point model to describe the trajectory of the CT in the acceleration region;the model results were in good agreement with the experiments[13].In the same year,Parks and Perkinset alproposed the use of CT injection to fuel a reactor-grade tokamak[14,15].Thereafter,studies have attempted to validate the feasibility of CT injection and investigate the interactions between CT plasma and tokamak plasma.In 1992,the first tokamak fuelling experiment through CT injection was performed on Caltech’s ENCORE tokamak with CT density of approximately 1021m-3and velocity of approximately30 km s-1[16].However,in the initial experiments,CT injections usually introduced large amounts of impurities,especially high-Zimpurities,which inevitably led to radiative cooling,magnetohydrodynamic instabilities excitation,fuel loss,and even more serious plasma disruption[17].In 1994,the first nondisruptive experiment was performed in Tokamak de Varennes(TdeV)with the compact torusfueller[18,19].Compact Torus injection experiments with high-confinement mode(H-mode)plasma were carried out for the first time at the JFT-2M(Jaeri Fusion Torus 2M)tokamak in 1999[20].A novel L-H transition with almost no change in the radial electric field profiles due to CT injection was observed on the STOR-M tokamak in 2002[21].The magnetically accelerated ring to achieve ultra-high directed energy and radiation device of the Phillips laboratory has attained the highest parameters so far with CT plasma mass up to milligrams and velocity up to 1000 km s-1[22].The main conclusions in the CT injection researches in the past decades can be briefly summarized as follows:(1)the feasibility of the tokamak as a central fuelling method is demonstrated[23];(2)the possibility of using an additional means to control plasma flow and transport is observed[24];(3)the importance of maintaining high-β,improving confinement,and stabilising the operation of tokamak plasma is emphasised[25,26];and(4)the impact of CT tangential injection on momentum transfer is examined[27-29].Recently,for use in the reversed-field pinch device of the Keda Torus eXperiment(KTX)project,a CTI device is developed(KTX-CTI)[30]at the University of Science and Technology in China(USTC).In this paper,we briefly introduce the bench test results of this device in section 2 and use nonlinear regression analysis(NRA)to calculate the circuit parameters of the formation bank discharge circuit in section 3.In section 4,the current waveform,displacement,and velocity of CT plasma in the acceleration region are calculated using this NRA-based point model,and then,the experimental pre-setting parameters and device upgrade are also predicted using this model.Finally,a brief summary is provided in section 5.10.2 cm,Lcom=15.2 cm,andLacc=35 cm).In the com-
2.Experimental setup
The KTX-CTI device presented herein comprises a host system,a gas delivery system,a vacuum chamber,four power supply units,and various diagnostics systems.The overall length of the host system is approximately 2 m,and it includes the formation,compression,and acceleration regions,as shown in figure 2.The inner electrodes of the formation and acceleration regions are separate,while the outer electrodes are shared.Furthermore,the host system has a coaxial configuration,and the length of the formation region is shorter than that of the acceleration region(Lform=pression region,the diameters of the inner/outer electrodes decrease from 17/25 cm to 7/14 cm,respectively.The gas delivery system is composed of eight gas valves,and the test gas is hydrogen,which is also used in this study.In the acceleration region,two sets of fibre optical interferometers are constructed(specific positions shown in figure 2)to monitor local plasma density[31].Beyond that,the Rogowski coils,which are mainly covered on the cables,are used to measure the current in the formation and acceleration bank circuits.
3.KTX-CTI bench results
The formation and acceleration bank currents play an important role in the performance of the CT plasma.The discharge voltage of the formation and acceleration bank capacitors in a typical shot is4.5 kV,and the peak currents are approximately74 kA and 63 kA(figures 3(a)and(b))respectively.The current waveforms of these two regions exhibit sinusoidal oscillating characteristics accompanied by a decreasing peak amplitude and a nearly fixed oscillation period.Figures 3(c)and(d)show the CT density at different locations in the acceleration region with a peak value of approximately 1.21 ×10²¹m-3at point-1 and9.36×1020m-3at point-2 respectively.The corresponding particle number(NCT)as well as the mass(mCT)of the CT plasma decrease from 1.02 1019×(~16.9μg,for hydrogen)to

Figure 1.Schematic diagram of the KTX-CTI device.Red part represents the outer electrode of the entire system,blue part represents the inner electrode of the formation region,purple part represents the inner electrodes of the compression and acceleration regions,and the red ring on the right side represents the magnetic field structure of CT.
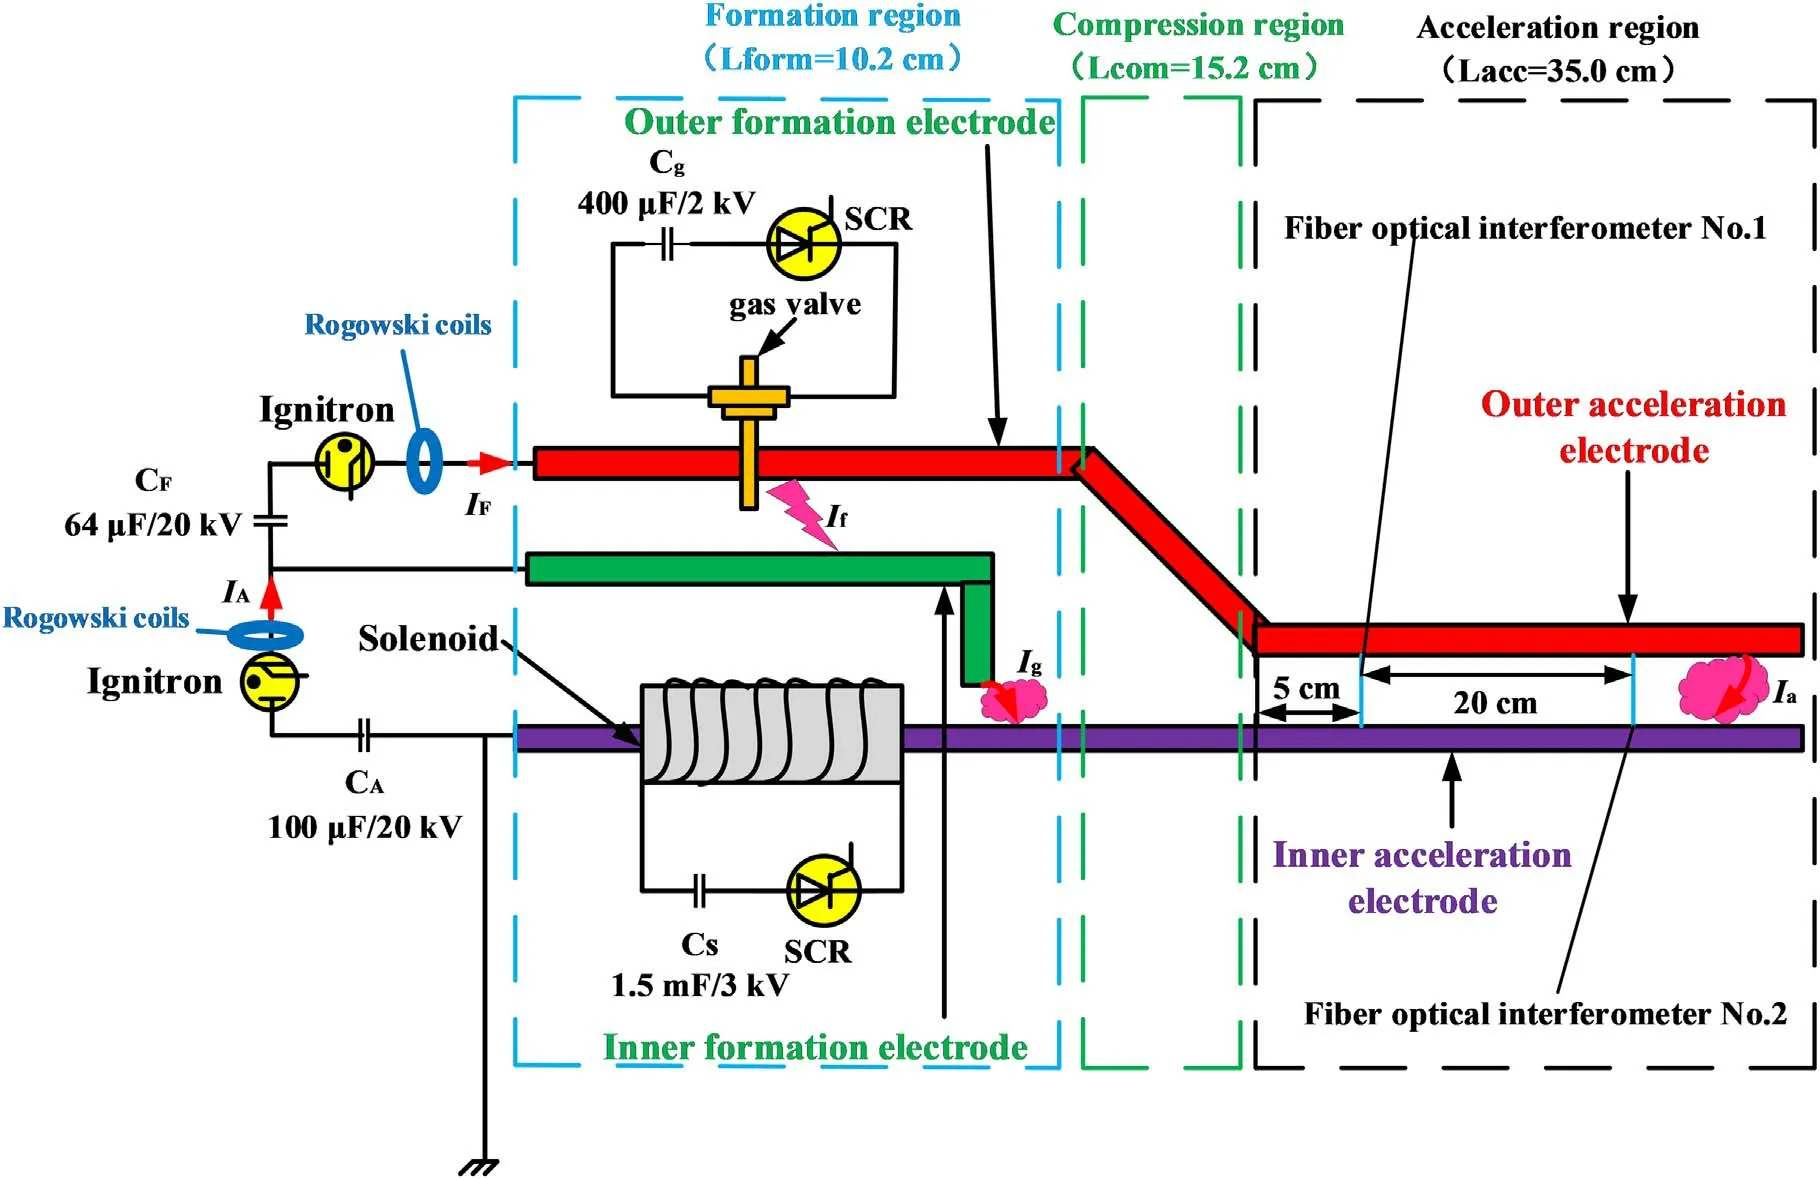
Figure 2.Circuit diagram of the KTX-CTI device.Purple part represents the inner electrode in the compression and acceleration regions,green part represents the inner electrode in the formation region,and red part represents the overall outer electrode.The power supply parameters of the formation,acceleration,solenoid,and the gas valve are marked in this plot.
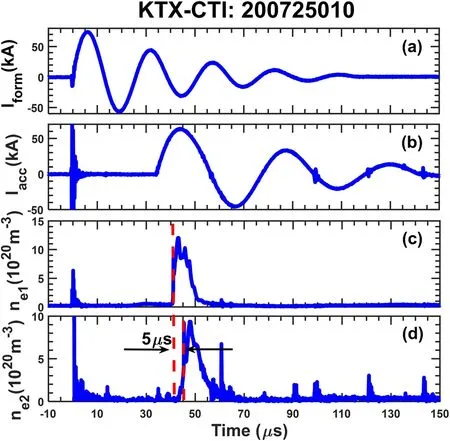
Figure 3.Typical discharge waveform of KTX-CTI.(a)and(b)plasma current at formation and acceleration banks measured by the Rogowski coils;(c)and(d)CT density measured by the fibre optical interferometers(viewing positions are indicated by the blue lines in figure 2).
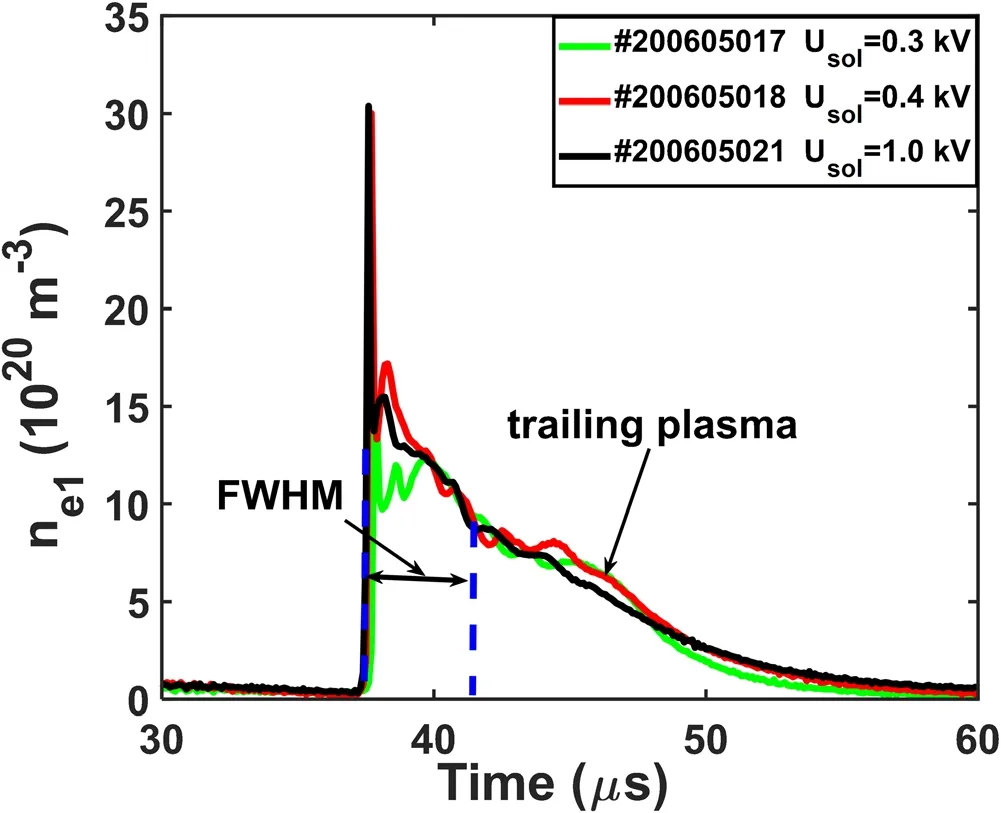
Figure 4.CT plasma density for different solenoid voltages with the same formation and acceleration bank voltages(4.5 kV).

Figure 5.Superimposed waveform of the CT formation bank current for different CT masses with a fixed formation bank voltage of 4.5 kV.

Figure 6.Simplified RLC circuit for the formation bank power supply system,where IF represents the formation bank current.
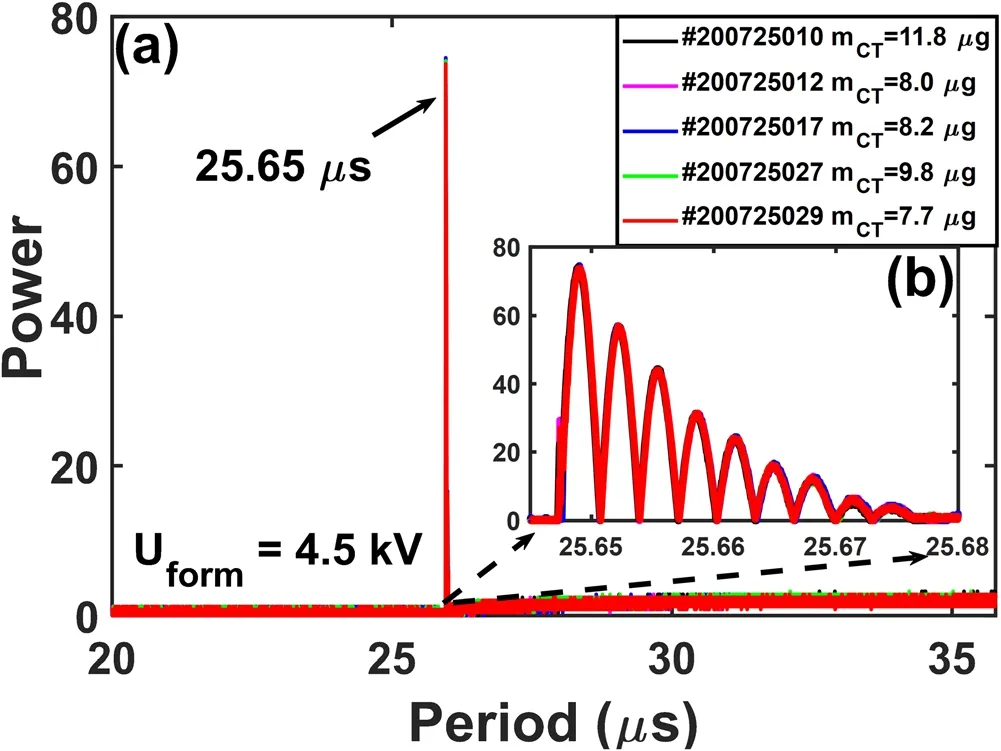
Figure 7.FFT results of the current waveforms of the formation bank under different CT masses with fixed formation bank voltage(Uform=4.5 kV).The X- and Y-axes are the period and power spectra,respectively.

Figure 8.Experimental and fitted current waveforms of the CT plasma in the formation region.

Figure 9.Comparison of the experimentally measured current waveforms with the simulation results of the NRA or RLF-based point models in the acceleration region.

Figure 10.Time evolution of the displacements and velocities of CT plasma in experiment and simulation.Here, x=0 represents the initial position of the acceleration region.
8.37 1018
×(~13.9μg)during the acceleration,which is attributed to the loss of nonionized gas and nontrapped particles[10].Here,the particle number is estimated using equation(1):

whereSCTis the cross-sectional area of CT plasma,and the full-width integration of the density waveform is performed[30].According to the time-of-flight method[31],the calculated average velocity of the CT plasma between point-1 and point-2 of the acceleration region is approximately.
To verify the stability of KTX-CTI,CT density of multishots with different solenoid voltages and the same formation and acceleration bank voltages are overlaid in figure 4.The electron density exhibits a rapid increase(~1μs)and a relatively slow decrease(~10μs)trend,which is mainly due to the trailing effect of the fast moving plasma[32].However,the generated plasma has high repeatability,and the density of CT seems to be independent of the solenoid voltage.
The resistance and inductance of the CT plasma are considered to be very small because the current waveforms of the formation bank under different CT masses are approximately the same,as shown in figure 5.Therefore,only the impacts of the host system,cables,ignitions,and capacitors are considered in the circuit parameters estimation.The basic calculation equations are as follows:
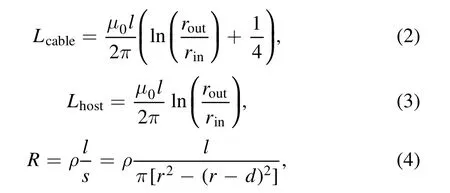
wherel,rin,androutrepresent the length,inner radius,and outer radius,respectively,of the host system and cable;dis the skin depth,andρandμ0are the resistivity and permeability of the vacuum respectively.The inductance calculation equations of the host system and the cable are different because of their different structures,i.e.the cable is a solid structure and the host system is a hollow structure.The calculation equations of the inductance can be found in[33].According to the device size and materials used,the resistance and inductance of the host system and cables areRhost=7.42 m Ω ,Lhost=213.27 nH andRcable=0.09 m Ω ,Lcable=40.12 nH,respectively.The inductance of the ignitrons is obtained according to the product manual,and the resistance of the coaxial capacitors is measured using an LCR digital bridge system.The resistance of the ignitrons and the inductance of the coaxial capacitors are very small and ignored in the circuit estimation.The total resistance and inductance of the circuit in the formation region calculated by the above-mentioned resistance/inductance formula(RLF)method are approximately 9.45mΩ and 258.39nH,respectively,as shown in table 1.However,the disadvantage of this method is that it does not consider the impacts of contact resistance and skin effect(especially for the inductance).
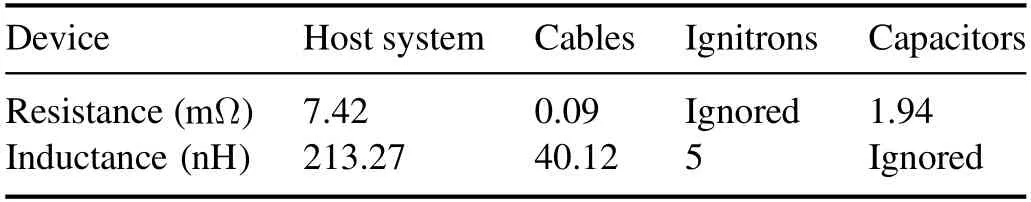
Table 1.The circuit parameters of the formation bank estimated by the RLF method.
To ensure accuracy in the above estimation,we start from the circuit model,solve the ordinary differential equation of the circuit and obtain the mathematical form of the current in the formation region,and then perform NRA on the current to reverse the circuit parameters.The detailed derivation process is as follows.
Based on Kirchhoff’s law and the basic principle of RLC circuit(figure 6),the loop equation of the circuit can be written as follows:
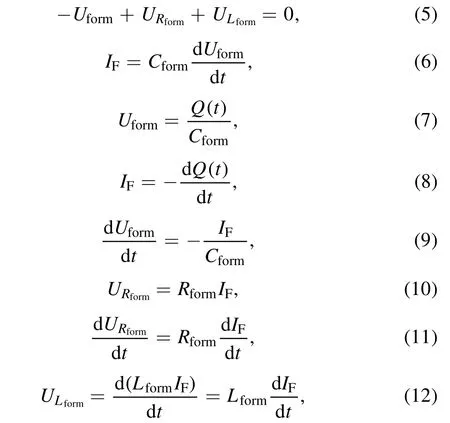
whereQ(t)refers to the amount of charge of the formation bank capacitor with respect to time.
The second derivative of equation(5)can be simplified according to equations(6)-(12)as follows:
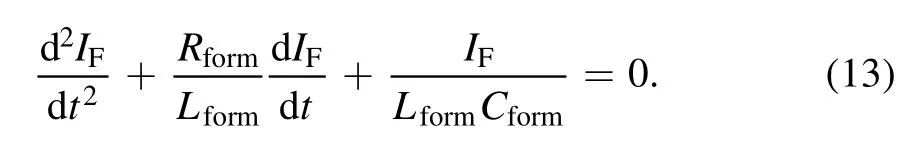
Furthermore,the mathematical form of the current of the formation region,IF,can be written as follows:

whereC1is the constant.Considering the boundary condition that the current at the zero-time point should also be zero,equation(14)can be further simplified as follows:
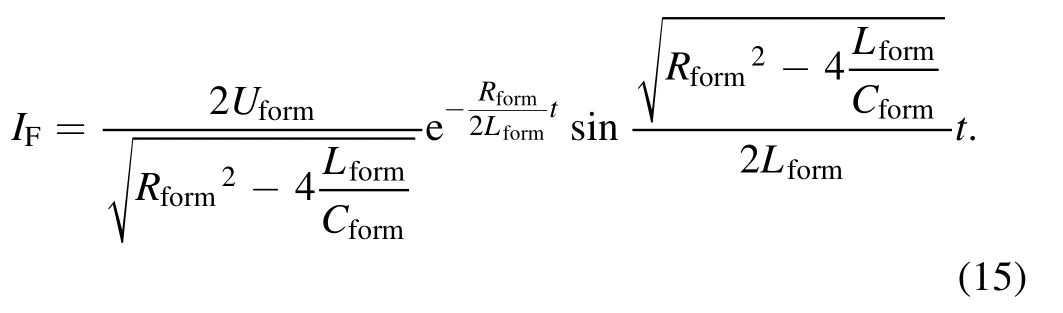
The circuit parameters can be estimated more accurately from equation(15)and by employing nonlinear regression fitting on the actual measured current waveform.Fast Fourier transform is performed on the current waveform to obtain the period information,as shown in figure 7.All the oscillation periods under different CT masses are ~25.65 μs(± 0.03 μs).Furthermore,it is evident from the enlarged view of figure 7(b)that when the resonance amplitude decreases,the period slightly increases,which is consistent with the characteristics of the RLC circuit.However,this slight change has little effect on the subsequent estimation of the circuit parameters.Subsequently,the resonance period and capacitance of the formation bank were fixed and the current waveform was fitted according to equation(15)with the NRA method.The fitting results were found to be in good agreement with the experimental results(figure 8),with the goodness of fit indexR2exceeding 0.91 in the first four cycleswhereyiis the experimental data,¯yis the mean value,andyl^ is the fitted value.On this basis,the overall resistance and inductance of the formation bank of the CT device can be calculated by substituting the fitting parameters,oscillation period,and fitting errors into equation(15).The values obtained areRform=9.50±0.50 mΩ andLform=198.13 ±4 nH.The comparison of the circuit parameters calculated using these two methods is drawn in table 2.The values of resistance obtained from the two methods were similar.However,there was a marked difference between the values of inductance;the value of inductance calculated by the RLF method is larger than that of the NRA method,since the influence of the skin effect and stray inductance on the inductance is ignored in the RLF method(the skin effect can reduce the inductance,as demonstrated in[34,35]).However,in explanation of the exceedingly close resistance values,the skin effect is considered in the RLF method(the formula is clear),as shown in equation(4).
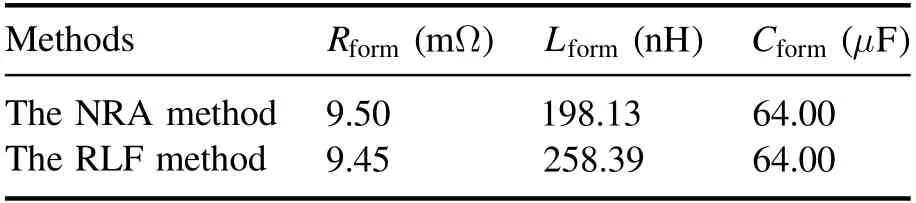
Table 2.Comparison of the circuit parameters calculated by the NRA and RLF methods.

Table 3.External input parameters of the point model.
4.Point model simulation results
The point model is generally used to describe the motion of CT in the acceleration region,and the basic equations are as follows:

Here,Laccis the inductance per unit length of the host system in the acceleration region,mCTis the CT mass,x(t)is the CT axial position,andrinandroutare the inner and outer radii of the acceleration region,respectively.‘Ext’ refers to the external input parameters,including the formation and compression region circuits.As the acceleration region is made of copper,its resistivity is significantly lower than that of the stainless steel.Thus,the resistance of this region is ignored in the above equations[36].TheFdrag,which represents the resistive drag of the metal acceleration electrode,is also ignored in the simulation because the resistance of CT is significantly smaller than that of the external circuit[36].In addition,for the convenience of calculation,two approximations are considered in the simulation,which have previously been employed in the[13,36].The first approximation is that the initial velocity of CT in the acceleration region is set to zero with the consideration that the CT plasma would experience a deceleration process in the compression region.The second is that the time point when CT enters the acceleration region is ahead of the time when the power supply system of this region is turned on.
For comparison,we substitute the external input parameters calculated by the NRA and RLF methods(as shown in table 3)into the point model,respectively,and use the fourthorder Runge-Kutta method to numerically solve the above equations system(equations(16)-(19)).The circuit parameters in tables 2 and 3 are different,since the circuit loop changes when the CT enters the acceleration region.The parameters in table 3 are obtained after deducting the inner formation electrode and adding the electrode connectors of the acceleration and the compression regions on the basis of table 2.Figure 9 presents the comparison of the current waveforms in the acceleration region in the point model calculation and the experimental measurement(shot#200605024).Here,approximately only the first 1/4 cycle of the simulated data is covered,owing to the limited length of the acceleration region.At about 40μs,the CT leaves the acceleration region and enters the test platform.The red curve calculated by the NRA-based point model is closer to the measured waveform(black curve)in the current ramping-up phase than it is to the RLF method(blue dash curve).
Figure 10 further presents the comparison of the differences in the displacement and velocity calculated using the point model based on these two methods.The black diamonds show the experimental data(shot#200605030 with the CT massmCT~25.6μg and the voltage of the acceleration bankUacc=5.5 kV).The CT velocity in the experiment is measured by fibre optical interferometers using the time-of-flight method,which is the average velocity[31].The first point is the average velocity between the entrance of the acceleration region and the first interferometer,while the second is the value between the first and second interferometers.For the displacement,the RLF method appears to be better than the NRA method(figure 10(a)).However,for the velocity calculation,which is the prime focus of this study,the NRA method is obviously more accurate,especially for the later stages of acceleration(~43μs,figure 10(b)).This can potentially provide a basis for the subsequent experimental development and upgrade of the device.
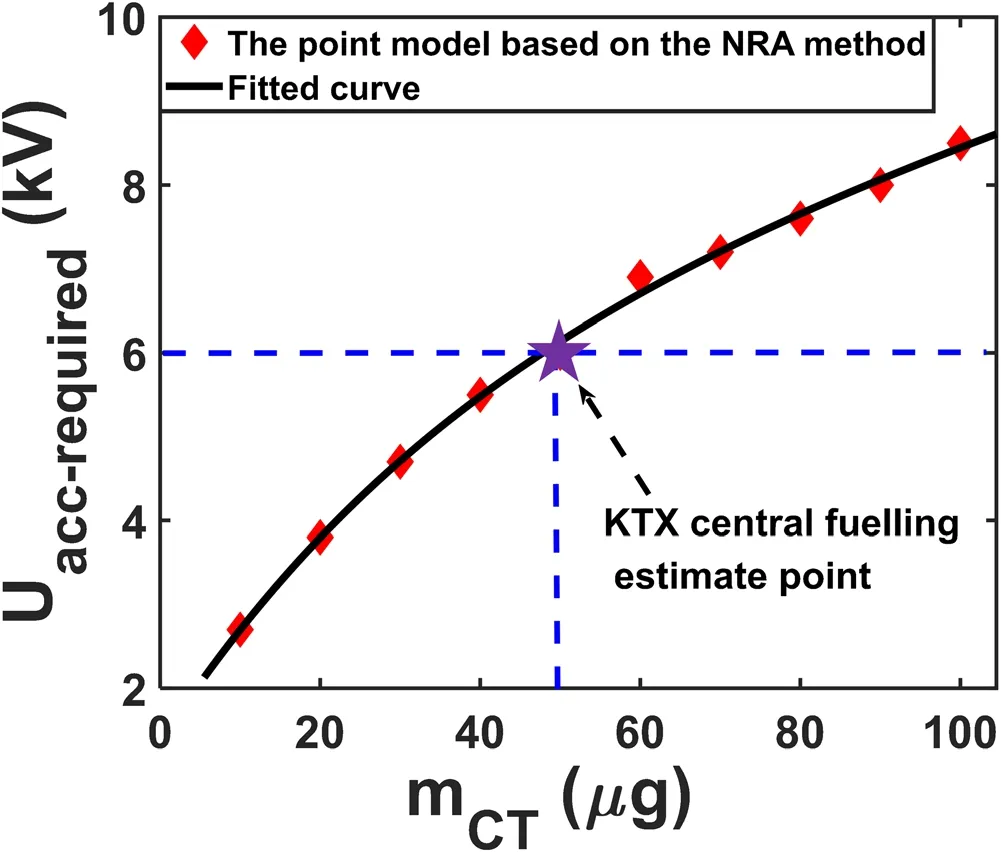
Figure 11.Relationship between the required acceleration bank voltage and CT mass with the fixed KTX-CTI acceleration region length x=33.6 cm and the final injection velocity vCT=100 km s-1.

Figure 12.Relationship between the ratio of the outer and inner radii of the acceleration region and the acceleration efficiency in KTX.
According to the more accurate NRA-based point model,the CT plasma behaviour,especially the velocity simulation,can be predicted more accurately.This will aid in broadening the scope of research and device upgrades.For example,for the central fuelling requirements of a KTX device,the required CT velocity,vCT,is approximately 100 km s-1,the particle numberNCTis approximately 3 ×10¹⁹m-3(for hydrogen),and the correspondingmCTis close to50μg[30].The relationship between the CT mass and the required acceleration bank voltage is obtained based on the NRAbased point model,by fixing the length of the acceleration region(36.3 cm)and the final injection velocity(100 km s-1)(figure 11).It is evident that to meet the central fuelling requirements of a KTX device,the minimum requirement of acceleration voltage is 6 kV,as shown by the purple star.This setting parameter is consistent with the current KTX experimental results,as demonstrated in[30].
In figure 12,the acceleration efficiency of the KTX-CTI system has been further investigated by the NRA-based point model.Here,the abscissa is the ratio of the inner and outer radii of the acceleration region,while the ordinate is the acceleration efficiency,defined as follows:

Here,CaccandUaccare the capacitance and voltage of the power supply system of the acceleration bank,respectively.It is evident from this rough calculation that the acceleration efficiency of KTX-CTI is relatively low and only reaches up to 8.4%,represented by the black square.Generally,the easiest way to improve the acceleration efficiency is to increase the length of the acceleration region;however,it has the drawback of not only increasing the construction cost but also the loss of the CT plasma.Therefore,optimising the ratio of the inner and outer radii of the accelerating region is a viable and economical solution.The acceleration efficiency improves significantly with the increase in the radius ratio;this is mainly attributed to the increase in inductance,as indicated by equations(17)and(19).However,one may notice that when the radius ratio reaches a certain level,there is a deceleration in the increase rate ofη.This is attributed to the increase ofLacc,which will cause a decrease inIacc(as shown in equation(18));these two acceleration terms,LaccandIacc,restrict each other to modulate the velocity of the CT plasma.In addition,an excessively large radius ratio may lead to density dilution and uneven distribution of the CT plasma,resulting in asymmetricity of the toroidal magnetic field strength,thus further limiting the lifetime of CT plasma.Considering the acceleration efficiency,the lifetime,and the density uniformity of CT plasma,the acceleration electrodes of KTX-CTI devices are redesigned with the radius ratio of 6(rout=6 cm andrin=1 cm)in the next-step.Under this design,the acceleration efficiency can reach 20%,as shown below,which is a large improvement in the current condition.
5.Summary
The KTX-CTI system in USTC was successfully constructed and tested.The maximum parameters that this system can achieve are an electron density of 1022m3-and a velocity of 100 km s-1under typical values of magnetic field strength and temperature of approximately0.14 T and 10 eV,respectively.In this study,we conducted a detailed analysis of the current waveform in the formation bank and obtained the mathematical expression of this waveform by assuming that the circuit in this bank is a simple RLC oscillator circuit.Moreover,the NRA method was used to calculate the inductance and resistance of the formation bank circuit.The current waveform,displacement,and CT plasma velocity in the acceleration region are calculated using the NRA-based onedimensional point model and further compared with the experimental measurements.The simulated results are in an agreement with the experimental results and are superior to those obtained by the previously employed RLF method.Finally,the point model based on the NRA method is used to simulate the influence of the radius ratio of the acceleration region on the acceleration efficiency.The results of this study are crucial to better understand and control the CT plasma,and also provide a certain reference for device upgrade in the future.
Acknowledgments
This work is supported by the National Key Research and Development Program of China(Nos.2017YFE0300500,2017YFE0300501),the Institute of Energy,Hefei Comprehensive National Science Center(Nos.19KZS205 and 21KZS202),the International Partnership Program of Chinese Academy of Sciences(No.Y16YZ17271).National Natural Science Foundation of China(Nos.11905143 and 12105088)and Users with Excellence Program of Hefei Science Center CAS(No.2020HSC-UE008).The University Synergy Innovation Program of Anhui Province(Nos.GXXT-2021-014,GXXT-2021-029).
ORCID iDs
猜你喜欢
杂志排行

Plasma Science and Technology的其它文章
- Investigation of short-channel design on performance optimization effect of Hall thruster with large height-radius ratio
- Multi-layer structure formation of relativistic electron beams in plasmas
- Mode structure symmetry breaking of reversed shear Alfvén eigenmodes and its impact on the generation of parallel velocity asymmetries in energetic particle distribution
- Interaction between energetic-ions and internal kink modes in a weak shear tokamak plasma
- Anomalous transport driven by ion temperature gradient instability in an anisotropic deuterium-tritium plasma
- Nonlinear excitation of a geodesic acoustic mode by reversed shear Alfvén eignemodes