Dynamic monitoring of carcinoembryonic antigen, CA19-9 and inflammation-based indices in patients with advanced colorectal cancer undergoing chemotherapy
2022-03-07ManojlovicSavicNikolicRancic
INTRODUCTION
Colorectal cancer (CRC) is the second leading cause of cancer morbidity in men, and the third leading cause in women[1]. Approximately 20%-30% of patients present with advanced cancer, and during the course of disease approximately 50% of patients develop metastases[2]. The goal of treatment for stage IV cancer is to control tumour growth, relieve symptoms caused by the tumour, and prolong patient survival times.Chemotherapy is the main-line treatment for patients with metastatic disease. Careful response evaluation during chemotherapy treatment is critical to prevent toxicity and the continuation of expensive treatments with ineffective regimens, and to save time for attempting therapies with other drugs that may be more effective. The guidelines for treatment monitoring are based on imaging evaluations conducted every 2 or 3 mo using standardized criteria[3]. In general, treatment response is evaluated by imaging,and the Response Evaluation Criteria in Solid Tumors (RECIST) are based on the World Health Organization (WHO) criteria for evaluating tumour response[4]. The main challenge is to identify disease progression at an early stage using a simple method to allow for treatment modification for patients with unresectable metastatic CRC (mCRC) treated with chemotherapy. Although the RECIST are the most widely accepted method for assessing tumour response in recent decades, limitations of the RECIST have become increasingly apparent, especially with recent advances in precision-medicine approaches to cancer therapy[5].
Carcinoembryonic antigen (CEA) is a complex glycoprotein of the membrane surface, that belongs to the immunoglobulin superfamily of cell adhesion proteins, and is the most commonly used tumour marker for the diagnosis of CRC and for the evaluation of patient prognosis or disease recurrence after treatment[6]. However, no consensus has yet been reached on the role of CEA in the assessment of tumour responses to chemotherapy, although some researchers have examined the efficacy of CEA monitoring for the evaluation of tumour response in palliative chemotherapy.CEA is recommended for monitoring advanced disease, especially if metastasis is difficult to measure by other means[7]. Currently, only limited data are available that indicate a correlation between CEA evolution and chemotherapy response on computed tomography (CT) imaging in patients with advanced CRC. CEA influences the biology of tumour cells through autocrine mechanisms, leading to an increase in cell survival and an inhibition of tumour cell differentiation, and by paracrine regulation, with activation of endothelial cells and tumour angiogenesis, inhibition of apoptosis[8-15], and promotion of tumour proliferation[16], eventually triggering or promoting a favourable state for tumour growth or immunosuppression[17,18].
Carbohydrate antigen (CA19-9) is a monoclonal antibody generated against a colon carcinoma cell line and is used to detect a monosialoganglioside found in patients with gastrointestinal adenocarcinoma. CA19-9 is elevated in 21%-42% of gastric cancer patients, 20%-40% of colon cancer patients, and 71%-93% of pancreatic cancer patients[19]. Some studies have revealed that in addition to the CEA level, the CA19-9 level is also related to the curative effect of chemotherapy[20,21]. In contrast to CEA,insufficient data are available to recommend the use of CA19-9 for evaluating treatment responses. The methodology of the published studies is heterogeneous, as several tumour marker cut-off levels and criteria for response assessment in mCRC patients have been used.
Serbia
二维码支付是指用户使用第三方支付APP在售票设备上购票,或是用地铁APP绑定银联或第三方支付账户在地铁进出站刷码过闸。
The inflammatory indices neutrophil-to-lymphocyte ratio (NLR), lymphocyte-tomonocyte ratio (LMR), platelet-to-lymphocyte ratio, and systemic immune-inflammation index (SII) have been investigated as prognostic factors in many cancers,including mCRC[22-26]. The results of these studies suggest that the systemic inflammatory response is a more potent stimulator of cancer progression in patients with established disease.
采用彩色多普勒超声诊断仪(型号:飞利浦CV350),选用线阵探头,频率为10~13MHz。指导患者采取仰卧位,将颈部暴露,垫高肩部,后仰头颈部,尽可能的偏向检测对侧。详细检查患者斑块大小、范围、明确斑块位置、内径、内膜、颈动脉血管走形、起点以及起源等。根据斑块的回声情况判断斑块的性质。以彩色多普勒技术显示出血流方向,判断有无充盈,血流信号有无逆转,以PW(脉冲多普勒)检查各节段血流频谱,测量PSV(收缩期峰值流速)、EDV(舒张期峰值流速)、Vm(平均流速)、RI(阻力指数)。局部狭窄的地方,需要测量该部位舒张末期最大峰值、收缩期最大峰值、狭窄处管腔内径,对狭窄程度进行全面评估。
The primary endpoint of this study was to evaluate the concordance and correlation of dynamic changes in the tumour markers CEA and CA19-9, with response evaluation estimated by the RECIST 1.1, to find representative cut-off values for progressive disease (PD) and disease control (DC) and to evaluate the diagnostic characteristics of these markers.
近年来,随着勘探开发的深化,国内油田加大了对水平井的部署力度,且应用先进的地质导向技术,有效提高了单井原油产量。在水平井钻探过程中,目前主要使用远钻头随钻测井设备,但资料数据的延迟性,大大地削弱了其及时性,而气测录井资料恰恰可作为其有效补充,通过现场气测综合评价快速识别油气和避开低渗层,二者结合可更好地完成优质水平井。
At the start of this study, tumour progression appeared to be the most relevant parameter for tumour response evaluation because typical clinical practice is to continue cytotoxic treatment until progression or unacceptable toxicity arises.
MATERIALS AND METHODS
The study was performed at the Department of Digestive Oncology of the Military Medical Academy, where we enrolled 102 patients with CRC and unresectable mCRC.Approval in concordance with the Declaration of Helsinki was obtained from the local ethics committee, and informed consent was obtained from the patients. The inclusion criteria were age > 18, histopathologically proven adenocarcinoma of the colon and rectum, confirmed unresectable metastatic disease with measurable metastases suitable for RECIST 1.1 evaluation with CT of the chest, abdomen and pelvis, Eastern Cooperative Oncology Group performance status (ECOG PS) ≤ 2, positivity in at least one measurement of CEA or CA19-9 during evaluation, absence of contraindication for chemotherapy treatment, absence of concomitant infection, autoimmune disease,steroid treatment and any recognizable inflammatory condition, concomitant malignant tumour, no granulocyte colony-stimulating factor (GCSF) stimulation at least 2 wk before blood analysis, written informed consent, and the decision of a local multidisciplinary team to provide treatment with systemic chemotherapy. The exclusion criteria were age < 18, resectable metastatic disease, patients unsuitable for RECIST 1.1 evaluation, absence of both increased tumour markers during treatment,absence of regular CEA and CA19-9 monitoring, absence of complete blood count(CBC) monitoring, and absence of regular radiological monitoring according to the RECIST 1.1.
超导磁场储能技术在微网中的功率调控包括两种模式即内环控制和外环控制,为保障超导磁场储能技术可预测并控制现有微网中的电网运转模式,因而需解释微网的有功与无功功率需求。超导磁场储能技术预测控制系统的输出的有功功率为PSMES,无功功率为QSMES,P为设定有功功率,Q为设定无功功率。Ub与Ik为超导磁场储能技术下的基波电位与电流幅值,微网的各相电流与电压间的相位差为θ,K为所调控信息的幅值,Ik1为所调控信息的电流,通过三角等式变化如式(3)和式(4)。
Assessment of tumour response to chemotherapy and progression by radiology
Response rates were estimated according to the RECIST 1.1. PD was defined as an increase in the sum of the maximal longitudinal diameter > 20% in comparison with that at baseline or nadir, appearance of new non-target lesions, or unequivocal progression of non-target lesions. Complete response (CR) was defined as the absence of the tumour mass on CT imaging. Partial response (PR) was defined as a decrease in the sum of the maximal longitudinal diameter of at least 30%. Stable disease (SD) was defined as disease that met neither the PD or PR criteria. CT-evaluated response estimated by the RECIST 1.1 served as the gold standard of the response evaluation.All the CT images were examined by two radiologists with experience in abdominal image interpretation at the Institute for Radiology of the Military Medical Academy.The radiologists were blinded to each patient’s prognosis, tumour marker and inflammatory index data and chemotherapy schedule but were aware that the patients had been pathologically diagnosed with mCRC.
Determination of CEA and CA19-9 values and inflammatory indices and assessment of their change
All blood sampling procedures for CBC, and blood chemistry CEA and CA19-9 testing were performed up to 3 d before beginning the treatment, and each planned CT examination was performed after full recovery from the chemotherapy cycle. No GCSF was administered during the 14 d before blood sampling and response evaluation. We took at least 5 mL of blood from the peripheral vein and sent it to the Institute for Biochemistry of the Military Medical Academy. Serum CEA levels were measured using the Siemens Advia Centaur XP Direct Chemiluminescent Immunoassay DCL method (normal < 2.5 ng/L) and CA19-9 levels were measured with an Access GI Monitor assay using the Beckman Coulter UniCel DXI Indirect Chemiluminescent Immunoassay DCLIA method (normal < 31 U/mL).
Blood samples for CBC were collected in BD Vacutainer K2 EDTA tubes and analysed within 2 h of venepuncture. The CBC was determined by the Siemens Advia 120 haematology system, which is a flow cytometry-based system. Differentiation of white blood cells was performed by peroxidase and basophil channels. The peroxidase method is a primary differential method on Advia 120. Peroxidase in the granules of white blood cells reacts with hydrogen peroxide from reagent and forms dark precipitates within the cells. After measuring the light scatter, which represents the size of the cell and absorption showing the level of staining, the analyser separates populations of neutrophils, monocytes, eosinophils, and large unstained cells, while lymphocytes and basophils appear as one cluster. These cells require a further method for differentiation. The basophil method uses the resistance of basophils to acid lysis and differentiates them from the rest of the white blood cell population. The Advia 120 analyser method of counting platelets is based on two-dimensional laser light scattering. The laser optics low- angle and high -angle scatter is used to determine the platelet count simultaneously with the red blood cells. The NLR, MLR, PLR and SII[(Ne*Pt)/Ly] were calculated as ratios of circulating neutrophil, monocyte,lymphocyte, and platelet counts, respectively. Normal ranges for these cell counts are as follows: Leukocytes 4-10.8 × 10⁹/L; neutrophils 1.9-8 × 10⁹/L; lymphocytes 0.9-5.2× 10⁹/L; monocytes 0-1 × 10⁹/L; and platelets 130.0-400.0 × 10⁹/L (data from our laboratory).
The response indicated by tumour markers was estimated according to the change in the percent from the baseline value or at nadir calculated as ΔCEA1 = [(CEA2-CEA1)/CEA 1] × 100, ΔCEA2 = [(CEA 3- CEA nadir or 2)/CEA nadir or 2] × 100. The same formula was used for the CA19-9 and inflammatory indices.
Statistical analysis
Statistical analyses were conducted using IBM SPSS Statistics, version 26.0 (SPSS,Chicago, IL, United States), and statistical significance was defined as< 0.05 for all comparisons. Categorical variables are presented as frequencies and were analysed using the chi-squared test. All continuous variables are presented as the mean ± SD for normally distributed data or the median [interquartile range (IQR): 25-75 percentile]for nonnormally distributed data. The Kolmogorov-Smirnov test was used to test the normality of the data distribution. For intergroup comparisons, an independent-test was used for parametric variables, and the Mann-Whitneytest was used for nonparametric variables. The relationship between variables was evaluated using Pearson’s coefficient correlation. The association between potential risk factors and disease progression was evaluated using binary logistic regression, expressing the strength of association by crude and adjusted odds ratios with 95% confidence intervals.
The Sensitivity (Se), specificity (Sp), negative predictive value (NPV), positive predictive value(PPV), efficiency and confidence intervals for each set of screening criteria for PD (CEA, CA19-9, NLR, PLR, LMR and SII) were obtained. Comparisons of receiver operating characteristic (ROC) curves were carried out to verify variations in the Se and false-positive fraction (1 - specificity) of different sets of markers using overall cut-off values. The accuracy and discriminative ability of tumour markers and inflammatory indices for the outcome of chemotherapy treatment were estimated with the Se, Sp, PPV, NPV, fraction correct (FC) and clinical utility index in the form of the case-finding utility or positive utility index (CUI Ve+) and screening utility or negative utility index [CUI- (Ve-)]. CUI- (Ve+) = Se × PPV and CUI- (Ve-) = Sp × NPV represents important indices for clinicians and estimates both the accuracy and discriminative ability of the test[27,28].
RESULTS
Patient characteristics
A total of 102 mCRC patients participated in this study from 2014 to 2019. All the patients were treated with chemotherapy as the first-line treatment. The baseline or at least one of three determined levels of CEA or CA19-9 for all patients included in the study were above normal (≥ 2.5 ng/mL, ≥ 31 ng/mL). CEA was present in all 102 patients, and 65 patients were positive for CA19-9 (63.7%). Inflammatory indices were recorded in 58 (55.8%) consecutive patients. The population of this study consisted of 71 men (69.6%) and 31 women (30.4%), and the average age was 63.37 years. In 42 patients (41.2%), the primary tumour was located in the rectum, in 44 (43.1%) the primary tumour was located in the left side of the colon, and in 16 (15,7%), the primary tumour was located in the right side of the colon. The localization of metastases was as follows: Liver 91 patients (89.2%), lung 38 (37.3%), peritoneum 13 (12.7%), and lymph nodes 38 (37.3%). The tumour histological grade was HG1- (low grade) in 51 patients(50.0%), HG2- (intermediate grade) in 45 patients (44.1%), and HG3- (high grade) in 6 patients (5.9%). Fluoropyrimidine-oxaliplatin-based chemotherapy was administered to 61 patients (59.8%), fluoropyrimidine-irinotecan to 21 patients (20.6%), bevacizumab to 20 patients (19.6%), and EGFR inhibitors to 4 (6.9%) patients before the first response evaluation, and in 53 (52.0%), 21 (20.6%), 15 (14.7%) and 13 (12.7%) patients,before the second response evaluation (Table 1).
Radiological response evaluation- RECIST
We performed radiological response evaluation according to the previously described RECIST 1.1, but in the analysis, we mainly differentiated PD from DC (CR + PR + SD)based on the findings in the literature and personal experience indicating that the role of tumour markers could be useful for this purpose. We recorded 63 patients with PD(31%) and 141 patients with (69%) DC, including 0 patients who achieved CR, 31 patients who achieved PR (15%), and 110 patients who had SD (54%).
CEA, CA19-9, and the inflammatory indices
The values of the tumour markers CEA and CA19-9 were expressed as × upper normal limit (UNL) and absolute values of the inflammatory indices NLR, PLR, LMR and SII were expressed as the median (IQR) before beginning the treatment as a baseline measurement, and at the 1st and 2evaluation of chemotherapy response (Table 2).
An increase in CEA was recorded in 82% and 12% of patients with PD and DC,respectively, while a decrease was noticed in 18% of patients with PD and 72% of patients with DC. After applying the cut-off obtained with the ROC analysis, there was no significant difference in concordance between the kinetics of CEA and the RECISTestimated response. There was a significant difference in the direction of CEA change between patients with PD and those with DC. CA19-9 showed similar results to CEA,with a significant difference in the direction of change between patients with PD and those with DC, and no significant change was observed when the cut-off obtained by ROC analysis was applied (Table 3).
The situation with the inflammatory indices was different. None of the inflammatory indices had a significant difference in kinetic direction between patients with PD and those with DC, when increases and decreases were analysed. In contrast to the previously mentioned cut-off based on the ROC analysis, the direction of change in the NLR was significantly altered in patients with DC (< 0.05), leading to a significant difference in the CEA value direction of change between patients with PD and those with DC (< 0.01). The PLR demonstrated no statistically significant change between patients with PD and those with DC after the application of the ROC analysis-based cut-off in separate analyses; however, this small change led to an ultimately significant difference in the PLR direction of change between patients with PD and those with DC(< 0.05). The SII underwent a major change when we applied the cut-off value,leading to a dramatic turnover of the kinetics in patients with PD (< 0.01) and an overall significant difference in the kinetics between patients with PD and those with DC (< 0.01). The LMR was the only inflammatory index without any concordance with the RECIST-estimated response irrespective of the applied cut-off (Table 3).
Weibull计数模型下索赔频率的Bühlmann-starb信度估计…………曾欢琴 吴黎军 (3-76)
Correlation between the RECIST response, and CEA, CA19-9, and inflammatory index changes
The relationship between variables was evaluated using Pearson’s coefficient correlation. CEA was significantly correlated (< 0.001) with tumour response according to the RECIST 1.1 with a moderately strong correlation coefficient (r) (0.42 for the RECIST1.1, and 0.412 for the dichotomous RECIST 1.1 of PDDC). CA19-9 had a low r strength (= 0.256 for the RECIST 1.1 and 0.27 for the dichotomous RECIST1.1 outcome) but a significant correlation with the RECIST 1.1 response (<0.05). The NLR had a moderately strong correlation with both the RECIST 1.1 and dichotomous RECIST 1.1 outcome (0.306 and 0.338,< 0.01). The PLR had a low r strength (= 0.205) but a significant correlation (< 0.05) only with the dichotomous RECIST 1.1 outcome of PDDC. The SII had a low correlation with the RECIST 1.1 (= 0.285,< 0.05) and a moderate correlation with the dichotomous RECIST 1.1 outcome (= 0.309,= 0.001).
The change in CEA had a moderately strong correlation with CA19-9 (= 0.406,<0.01) and a low r strength but a significant correlation with the NLR (= 0.277,<0.05), PLR (= 0.204,< 0.05) and SII (= 0.263,< 0.05).
Unlike CEA and MSCT, CA19-9 had a moderately strong correlation with only the PLR (= 0.417,< 0.001).
The LMR did not have any significant correlation with the other variables.
The best cut-off value for CEA, CA19-9 and inflammatory index changes for predicting tumour response
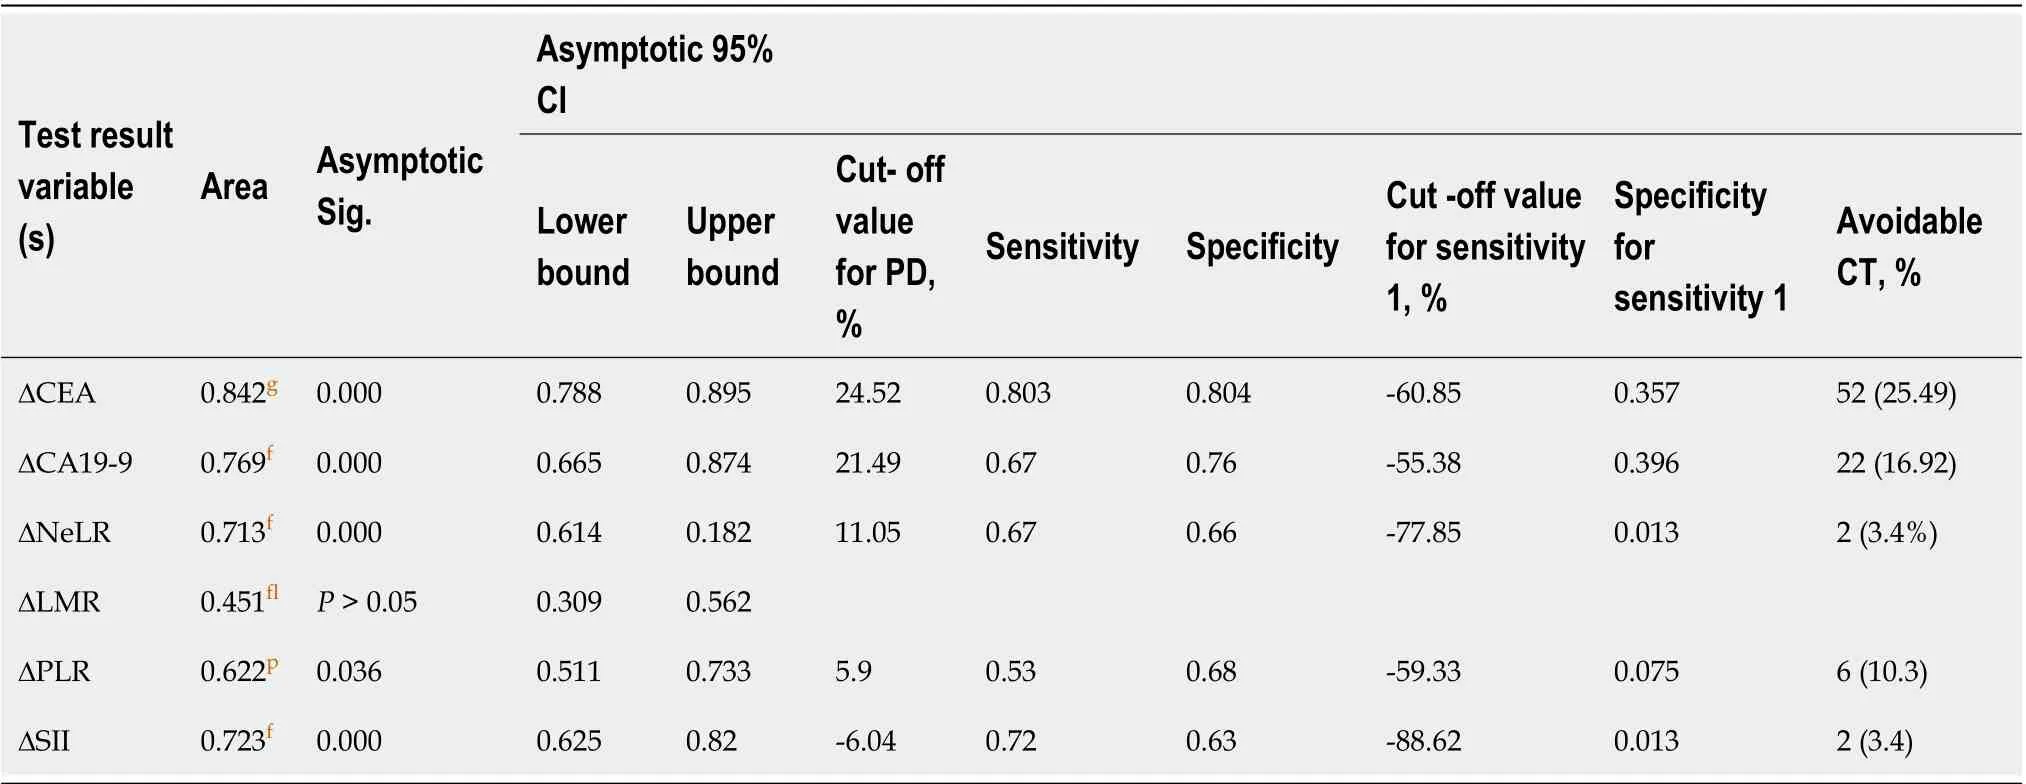
We constructed ROC curves to determine the best cut-off value for changes in the patients’ CEA, CA19-9, NLR, PLR, LMR and SII values during the first and secondtumour response evaluations. The dependent variable of the ROC curve was categorized by the response as determined from a radiological scan and assessed using the RECIST 1.1 using PD and DC as variables. The best area under the curve (AUC),categorized as good, was obtained for CEA (0.842,< 0.01), which suggests that a significant change in the CEA levels is a variable that can be used to predict the tumour response. CA19-9 (0.769), the NLR (0.713) and the SII (0.723) had AUC values categorized as acceptable (< 0.01). The PLR had a poor but nevertheless statistically significant AUC value (0.62,< 0.05), while the LMR AUC analysis was considered to have failed and was nonsignificant (Table 4, Figure 1).

The best PD cut-off value for CEA was 24.52%, with an Se of 80.3% and an Sp of 80.4%. The a CA19-9 best cut-off value was 21.49% with an Se of 67% and an Sp of 76%. For the NLR, the best cut-off value was 11.05% with an Se of 67% and an Sp of 66%; for the PLR, the best cut-off value was 5.9% with an Se of 53% and an Sp of 68%,and for the SII, the best cut-off value was -6.04% with an Se of 77% and an Sp of 63%.The cut-off with maximal Se (100%) for excluding PD without CT analysis with a maximal Sp of 35.7% was -60.85% for CEA, allowing for the safe avoidance of 25.49%of CT scans; for CA19-9 this optimal cut-off was -55.38% with an Sp of 39.6% and could be used to avoid 16.92% of CT control examinations (Table 4, Figure 1).


Binary logistic regression, and univariate and multivariate analyses. Dynamic change in markers and the dichotomous RECIST 1.1 outcome of PD vs DC
Univariate and multivariate binary logistic regression analyses were performed to explore the significance of the investigated markers as predictors of the outcome ofchemotherapy response according to the dichotomous RECIST 1.1 outcome. In the univariate analysis, CEA was a significant predictor (< 0.001), as was CA19-9 and all the inflammatory indices except the LMR (< 0.05). In the multivariate analysis, only CEA was a significant predictor of outcome (< 0.05), suggesting its robustness for monitoring response (Table 5).

Clinical utility index and fraction correct
CEA, CA19-9 and the inflammatory indices NLR, PLR and SII were analysed for diagnostic characteristics Se, Sp, PPV, NPV and CUI (Ve +) and CUI (Ve-) and FC for the differentiation of PD from DC.
CEA had the best Se (86.9%), NPV (93.4%), satisfactory case finding CUI (Ve+), good screening CUI (Ve-), and good overall utility FC. The Sp and PPV for CEA were the second best among the investigated markers and indices, and overall, CEA was found to be the best marker for monitoring tumour response.

CA19-9 had the second highest Se (80.6%) and NPV (89.2%), a good CUI (Ve-) value and a satisfactory overall utility FC.
The Inflammatory indices NLR, PLR and SII had poorer diagnostic characteristics than the tumour markers, with higher Se and NPV values for the NLR and SII than the PLR, but lower Sp and PPV values, leading to a satisfactory CUI (Ve-) value for all the indices, but poor overall utility (Table 6, Figure 2).
Discrepancies between the evolution of tumour markers and the radiologically assessed response to chemotherapy: Increase in tumour markers and anticipation of progression
Sequential follow-up of patients with three CT scans and two RECIST evaluations allowed us to record tumour marker flares, which are increases in tumour markers with subsequent decreases, followed by tumour regression or stabilization. Tumour marker prediction of PD manifests as an increase in tumour markers without supporting RECIST PD on the corresponding CT evaluation but with a further tumour marker increase and ultimately confirmed PD on the following CT evaluation.
CEA was expressed in flares in 11/102 (10.78%) patients and predicted PD in 8/102(7.84%) patients. CA19-9 yielded similar results and was expressed in flares in 6/65(9.23%) patients and predicted PD in 4/65 (6.15%) patients. The inflammatory indices NLR and PLR were expressed in flares in 3/58 (5.1%) and 4/58 (6.9%) patients, and predicted PD in 4/58 (6.9%) and 2/58 (3.4%) patients, respectively, while the SII was expressed in flares in 5/58(8.6%) patients and predicted PD in 2/58(3.4%) patients.
DISCUSSION
CEA could replace CT evaluation if a reliable cut-off for DC can be identified.Trillet-Lenoir[44] found that CT could be avoided in 13% of cases when progression was defined as a > 200% rise in CEA. Petrioli[46] found that a CEA increase of more than 50% identified PD with an Sp of 96.4%. According to Hermunen[32]’s study, increasing CEA levels could identify all patients with PD [(Se) = 1.0],and in 50%-74% of these patients, an increasing CEA level predicted PD earlier than CT. It was possible to replace CT with CEA monitoring in all patients with decreasing CEA levels, meaning that 23%-47% of CT scans could have been avoided at any given time point[32]. Gulhatiet al[53] reported that with a 99% NPV, the clinical cut-off (for chemotherapy alone, -79.4; AUC 0.79, Se 97%, Sp 22.4%; for VEGFR, -88.7, AUC 0.72,Se 96.3%, Sp 16.7%) for the prediction of non-PD could avoid CT scans at the first response evaluation in 21.0% (chemotherapy alone) and 16.2% (chemotherapy with anti-VEGF antibody–treated) of patients. In all the studies, the cut-off value that could help to avoid at least some of the CT examinations was different from the best cut-off value. The value used to replace CT evaluation should be maximally sensitive and able to detect all PD. In our study, a CEA cut-off value of 60.85% with an Se of 100% Se and an Sp of 35.7% avoided 25% of CT control examinations in unresectable mCRC patients undergoing chemotherapy. We obtained different cut-off values but similar percentages of spared CT examinations as those reported by Hermunen[32] and Gulhati[53].
四川农村居民生活水平提高,2016年四川省农村居民人均可支配收入为11203元,比2015年农村居民人均消费支出10192元同比增长9.33%,增速比上年降低0.3个百分点,比全国平均水平高1.1个百分点。2012-2016年四川城镇居民与农村居民人均纯收入不断增加(见图1)。
In our study, both the tumour markers CEA and CA19-9 expressed significant concordance in the direction of change along with the RECIST 1.1-estimated outcomes of PD and DC. One of the most important factors in the analysis of tumour marker utilization for monitoring response, the cut-off value, did not influence concordance with radiology-based response evaluation. The importance of any change in the CEA value, as reported by Hermunen[32], appears overly optimistic, as CEA values fluctuate for several reasons unrelated to the tumour response and many different cutoff values have been obtained using several methods[30-33,39-55], which can lead to significant differences in the statistical analysis. The question of how to interpret tumour marker changes in practice remains unresolved. Inflammatory indices have been investigated less often for this purpose; however, there are several different criteria and methods for differentiating between PD and DC. Any increase or decreasein absolute value does not seem to be a prospective measure for evaluating tumour response in our study. However, while applying the cut-off value did not change the concordance of tumour markers and radiology-based evaluation of the response, it almost completely changed the possibility of using the inflammatory indices for this purpose, in our study (Table 3).


We performed a linear correlation method to evaluate the relationship between the RECIST response and changes in tumour markers and inflammatory indices. Several studies have published data about the correlation between tumour response and CEA kinetics[31,32,33] indicating a significant correlation, while Hermunen[32]separately analysed the correlation coefficient every 2 mo of treatment, showing variation from 0.37-0.47. In our study, there was a significant moderate correlation between CEA kinetics and both the RECIST 1.1 and the dichotomous RECIST 1.1 outcomes (PD, DC). In addition to correlating with the response according to the RECIST 1.1, CEA had a significant moderately strong correlation with CA19-9 and a low correlation with the inflammatory indices NLR, PLR and SII, while CA19-9 had a moderately strong correlation only with the PLR. The association between the CA19-9 change and platelet kinetics was previously described in pancreatic cancer[34].
Among the inflammatory indices, ΔNLR and ΔSII had moderate correlation strength with radiological evaluation, while ΔPLR had low correlation strength only with the dichotomous RECIST outcome. According to our results, the LMR had no correlation with the RECIST response or tumour markers, contrary to the published data about the significant prognostic importance of the LMR in mCRC[35,36,37].
“三严三实”专题教育要求突出问题导向,着力解决一部分领导干部中存在的理想信念动摇、信仰迷茫、精神迷失,宗旨意识淡薄、忽视群众利益、漠视群众疾苦,党性修养缺失、不讲党的原则等问题;着力解决一部分领导干部中滥用权力、设租寻租,官商勾结、利益输送,不直面问题、不负责任、不敢担当,顶风违纪还在搞“四风”(即形式主义、官僚主义、享乐主义、奢靡之风),不收敛不收手等问题;着力解决一部分领导干部中无视党的政治纪律和政治规矩,对党不忠诚、做人不老实,阳奉阴违、自行其是,心中无党纪、眼里无国法等问题。
For all patients, we performed CT before beginning the treatment for the baseline CT scan, after 10-12 wk (three or four cycles of chemotherapy depending on the protocol) for the first control, and after another three of four cycles of chemotherapy or another 10-12 wk for the second control (third CT examination). Before the beginning of the first cycle of chemotherapy and at the time of each control radiological examination, we measured CEA and CA19-9 levels. In the second phase of the study,in the last 58 included patients, inflammatory indices were also measured, consisting of the NLR (Ne/Ly), LMR (Ly/Mo), PLR (Pt/Ly) ratio and SII [(Ne* Pt)/Ly].
The kinetics of changes in the CEA during chemotherapy treatment have been evaluated with three disease outcome measures: The objective response rate (RR), the progression-free survival (PFS) rate, and the overall survival (OS) rate in several studies. According to a published meta-analysis, the CEA response is highly correlated with the ORR (OR, 9.03), but the studies are extremely heterogeneous (, 72%) and influenced by publication bias (Egger’s test of 2.67;value, 0.004)[39].
The secondary endpoints were to evaluate the correlation of dynamic changes in inflammatory indices with the RECIST1.1 response and tumour marker kinetics and to test the diagnostic characteristics of these indices for monitoring the chemotherapy response in mCRC patients.
We found 20 studies comparing CT and CEA for response evaluation in mCRC[30-33,39-55]. The setting differed slightly among these studies, as did their endpoints.CEA measurement and CT scans were repeated every 2 mo in all but three studies that used 1.5- and 3-mo CT intervals, respectively. There was no consensus on the cut-off values for CEA to define the response, PD or (SD). The definition of CEA progression varied between a 2.7 and 200% increase from baseline and between a 0 and 50% CEA decrease compared with that at baseline for the response. SD was defined as between these variable cut-offs.
The optimal cut-off value of CEA change was frequently determined arbitrarily on the basis of radiology-based criteria (WHO or RECIST), categorizing patients as “CEA responders” or “nonresponders”, or on the basis of ROC analysis[30-33,38,39-55].
In addition to the arbitrarily chosen cut-off, eight studies conducted from 2012 to 2020 determined the best cut-off for the response with ROC analysis[31,43,45,47,49,51,52,53]. All these studies used the RECIST 1.1. The cut-off for PD varied from 2.7%-62%among these studies, while in the same population, the cut-off depended on the line of chemotherapy, ranging from 7.5% to 51.3% (median 31%) and the type of treatment(for VEGFR treatment, the cut-off value is 62%)[52]. The AUC of the ROC analysis varied from 0.65 to 0.83 depending on the line of treatment and VEGFR use. Therefore,the Se, Sp, PPV, NPV and accuracy among the studies also varied.
In our study, the kinetics of tumour marker and inflammatory index changes were evaluated with the ORR estimated by the RECIST 1.1 using the dichotomous outcomes PD and DC. The AUC of the ROC analysis for CEA was 0.842, which is categorized as good and is the highest AUC value for CEA published to date. The CEA cut-off value of 24.52% with the best Se of 80.2% and Sp of 80.4% is similar to that reported in published data. In our study, we considered all monitoring data together without stratification based on the 1or 2line of chemotherapy or the use of biologics.
Information about CA19-9 and the best cut-off is sparse. To the best of our knowledge, only 3 papers have published the best CA19-9 cut-off value for PD using ROC analysis[43,45,49]. The published data were similar in the studies of Petrioli[46] (AUC 0.80, CA19-9 > 22%), Jia[50] (AUC 0.82, Ca 19-9 > 28%), and Trilletlenoir (AUC 0.69, CA19-9 > 20%); the first two analyses yielded good AUCs and the third analysis yielded poor AUCs[43]. In our ROC analysis with an acceptable AUC level, the best cut-off value of CA19-9 for PD was 21.49%, which is similar to the value reported in the published data, with a lower Se and Sp than those of CEA in the same analysis.
The inflammatory indices NLR, PLR, MLR and SII have been widely investigated and confirmed to be important prognostic factors in several cancers, including CRC and mCRC. The majority of studies are retrospective and devoted to the preoperative or perioperative values of the inflammatory indices, exploring the prognostic importance of these indices for the PFS, DFS or OS rate[35,36,37,56,57]. However,several articles have addressed the importance of changes in the inflammatory indices in patients with mCRC, gastric cancer, breast cancer, and lung cancer undergoing chemotherapy and their relationship with the PFS, OS and RR rates. The NLR has been suggested to be a prognostic marker in several solid tumours[57-61]. As with the tumour markers, the main question is how to find the optimal cut-off value for the differentiation of PD from DC. Nemoto[62] investigated the importance of increaseddecreased values of the inflammatory indices NLR, LMR, PLR, CEA and CA19-9 in patients with mCRC undergoing chemotherapy. All the inflammatory indices and both tumour markers, except for the LMR, significantly changed during chemotherapy, but the only NLR was a significant predictor of the OS and PFS rates[62]. Inflammation promotes tissue repair responses that induce the proliferation of premalignant cells, increase cell viability and stimulate angiogenesis, immunosuppression, inhibition of apoptosis, and DNA damage, ultimately contributing to metastatic spread[63,64]. Neutrophils are a factor related to systemic inflammation,which is associated with cancer growth, producing vascular endothelial growth factor and various matrix proteases and contributing to metastatic spread[65]. A high NLR indicates a relatively elevated neutrophil count and depressed lymphocyte count.
On the other hand, Shibutani[66] confirmed the prognostic importance of the pretreatment value of the NLR for the OS rate in mCRC patients undergoing chemotherapy, but the posttreatment value was not predictive of response, making the NLR unsuitable for monitoring the chemotherapy response. Interestingly, contrary to the results obtained in a previous study, another study examined NLR changes in mCRC patients before and after two cycles of chemotherapy (FOLFIRI + bevacizumab)and revealed that an increased NLR led to significantly longer OS times than a decreased NLR in patients with SD[67]. In discussing determination of the optimal cutoff value for the NLR, Nemoto was against the construction of ROC curves, instead favouring cut-off determination of goodpoor prognoses based on the median value.In our study, we used ROC analysis to determine the best cut-off value, as Guo analysed perioperative changes in NLR and ΔNLR and reported their association with the OS rate but not the PFS rate[68]. ROC analysis used for cut-off determination has been reported in gastric cancer patients undergoing chemotherapy[69] and in breast cancer patients[70,71].
Kim[71] published a study with the largest number of patients (503) with mCRC undergoing chemotherapy and analysed the outcome of patients with different NLR dynamics, reporting that high prechemotherapy NLR, Glasgow prognostic score and CEA levels independently predicted poor survival and low chemotherapy response. In contrast, NLR reduction was an independent predictor of good prognosis and chemotherapy response. The cut-off for NLR was chosen on the basis of the median value. The authors concluded that the change patterns in NLR could be used to predict chemotherapy response and prognosis. Based on these results, they suggested that chemotherapy resistance is indicated by a continuously high NLR or a post-chemotherapy change to a high NLR, which indicates a persistent systemic inflammatory state. Moreover, NLR monitoring has been suggested to identify patients who will experience a low response to chemotherapy[72]. In another study,the PLR along with the NLR were correlated with DC but not the ORR, and the PLR was a significant independent predictor of the PFS rate but not the OS rate in patients with mCRC and confined metastases to the liver in patients undergoing fluoropyrimidine-oxaliplatin chemotherapy[73].
The mechanism of the PLR in tumorigenesis might be derived from the role of platelets in promoting angiogenesis, adhesion, and invasion by increasing the production of vascular epidermal growth factor and transforming growth factors[74].
Our ROC curve analysis at the acceptable AUC level for the NLR and SII and the poor level for the PLR is one of the first to show the best cut-off of percent change in the NLR, PLR and SII values.
In patients receiving palliative therapy, DC is clinically meaningful and does not need to be characterized meticulously by radiology at short intervals. The main reason to develop good tumour markers for response is to at least partially replace expensive and toxic CT examinations.
Response evaluation based on imaging is not always feasible because patients may have a disease that is difficult to measure by CT or MRI, such as diffuse peritoneal dissemination, or imaging results may be misleading early in the course of treatment,as is the case for immunotherapy. However, radiological imaging does not consider functional changes or tumour biology[29,30]. In addition, radiological imaging exposes patients to radiation and increases treatment costs. Therefore, the ideal follow-up strategy for mCRC patients undergoing systemic therapy uses a method that is accurate, reliable, simple, fast and inexpensive[31].
The cut-off value of CA19-9, which could be a candidate to replace CT examinations, was investigated by Petrioli[46], who reported that a CA19.9 increase of more than 50% identified PD with an Sp of 92.6% and could be used to replace 25%-30% of CT evaluations; Trillet-Lenoir[44] reported that an increase of 200% could be used to substitute CT evaluation, avoiding 13% of CT scans. In our study, with an acceptable AUC value, a CA19-9 decrease of 55.38%, with and Se of 100% and an Sp of 39.6%, could be used to avoid 16% of CT examinations.
Our report is the first regarding the cut-off values of the NLR, PLR and SII with Se 1 and maximal Sp for PD; however, the number of CT scans that could be avoided with these values was negligible.
The association between potential risk factors and disease progression was evaluated using binary logistic regression and univariate analysis, which showed that both the markers and the all indices except for the LMR were significant predictors of PD. In the multivariate analysis, only CEA was a significant predictor of PD,confirming its independence from the other evaluated factors. On the other hand, the main problem in monitoring advanced disease treatment with chemotherapy is assuming that CEA value fluctuation during treatment is important and it is necessary to differentiate significant CEA value changes that represent disease progression, from so-called “physiological variation”, drug effects, liver damage, surges as pseudoprogression indicators and the influence of other nonmalignant conditions that can coexist with mCRC[75,76].
In our analysis, we were not satisfied with the significance obtained with classical statistical tests concerning increasing and decreasing values of tumour markers and inflammatory indices in patients with PDDC; instead, we tested for practicability and diagnostic features important for clinical use.
CUI, a practical multiattribute approach, appears to be useful for evaluating new diagnostic tests[77]. To the best of our knowledge, no other studies have estimated the value of CEA, CA19-9 and the inflammatory indices in monitoring mCRC patients undergoing chemotherapy with the CUI. According to our data, CEA was good for screening PD, and acceptable for identifying patients, and its overall utility was good,confirming its robustness for monitoring unresectable mCRC and preventing a significant number of CT examinations. CA19-9 was good for screening PD, poor at identifying cases, and had satisfactory overall utility, making it acceptable in some circumstances, particularly when CEA is not expressed. The Inflammatory indices NLR, PLR and SII investigated under the conditions of our study yielded a positive signal with an acceptable level of screening for PD, justifying further investigation into their value for this purpose.
Tumour markers and inflammatory indices cannot completely substitute for CT monitoring of the response. Apart from true false elevation, there are two situations in which self-correction of tumour markers and correction of the CT-estimated response can occur during follow-up. The first is a surge in tumour markers; after temporary elevation, the value decreases, indicating patients who will benefit from chemotherapy with response or at least achieve DC. Our results indicating the surge in CEA and CA19-9 values are similar to those in other published studies, while we are the first to report surges in the inflammatory indices[78-81]. From a practical point of view,surges are not a substantial problem and could be resolved with earlier unscheduled CT examination. The other problem with measuring tumour marker increases is that PD without confirmation on corresponding CT examination can be indicated and tumour markers may subsequently continue to rise with later confirmation of PD on subsequent CT, which represents true anticipation of PD. It is accepted that a continuous rise in tumour markers without corroborating CT could be considered PD[7]. This situation demands frequent tumour marker measurement and it should be kept in mind that surges can sometimes persist for up to 4 mo and unscheduled CT examination may be required. It would be interesting to explore whether the synergistic action of tumour markers and inflammatory indices could help us solve this problem more easily. Fast increase and fast decrease in tumour markers also do not indicate the ultimate success or failure of chemotherapy, but rather dynamic change, which may be more informative regarding response and prognosis[48].
The limitation of our study is the small number of analysed patients, particularly those with inflammatory indices, and the lack of analysis of PFS and OS outcomes.Additionally, we used the same model for the evaluation of tumour markers and inflammatory indices. There are more options for analysing tumour marker kinetics,and the dynamics of changes[47] and calculating the level of change[82], including construction of the slope[83], which could also influence the results of the study.
CONCLUSION
CEA is a useful marker for monitoring the chemotherapy response in unresectable mCRC patients and could replace a quarter of CT examinations. CA19-9 has poorer diagnostic characteristics than CEA but could be useful in some clinical circumstances,particularly when CEA values are not increased. Dynamic changes in the inflammatory indices NLR, PLR and SII could be promising for further investigation into their use for this purpose. A large, well-designed, multicentric, prospective study could help us define the role of tumour markers and inflammatory indices in monitoring patients with unresectable mCRC undergoing chemotherapy. Scepticism regarding the possibility of conducting such a study has existed for a long time[49],but it is necessary to overcome this to rationalize and improve our approach to monitoring mCRC patients undergoing chemotherapy.

CEA is useful in monitoring of the chemotherapy response in patients with mCRC and can substitute a quarter of CT control examinations. CA19-9 could be useful in certain circumstances. The inflammatory indices NLR, PLR and SII should be further investigated into their use in chemotherapy monitoring for patients with mCRC.
Future research should investigate potential of the combinations of the tumor markers and the inflammatory indices in monitoring chemotherapy response in mCRC.
We thank Professor Dubravko Bokonjic, who significantly contributed to the design,analysis and interpretation of the data but suddenly died during the statistical analysis phase of this study. We thank Dr. Zoran Djordjevic, who contributed to the improvement of radiological evaluation of response but died during the data acquisition phase of this study. Physician Dr. Zoran Petrovic and nurses Biljana Debelnogic, Nevenka Mitov and Marina Kostic of the Department of Digestive Oncology, Military Medical Academy contributed to our study as part of their routine work with patients as staff of the Institute for Biochemistry and Institute for Radiology, Military Medical Academy.
猜你喜欢
杂志排行

World Journal of Clinical Cases的其它文章
- Lung injury after cardiopulmonary bypass: Alternative treatment prospects
- Acute myocardial injury in patients with COVID-19: Possible mechanisms and clinical implications
- Anemia in cirrhosis: An underestimated entity
- High tumor mutation burden indicates a poor prognosis in patients with intrahepatic cholangiocarcinoma
- Does delaying ureteral stent placement lead to higher rates of preoperative acute pyelonephritis during pregnancy?
- Management of retroperitoneal sarcoma involving the iliac artery: Single-center surgical experience