Evolution of superconductivity and charge order in pressurized RbV3Sb5
2022-01-23FengDu杜锋ShuaishuaiLuo罗帅帅RuiLi李蕊BrendenOrtizYeChen陈晔StephenWilsonYuSong宋宇andHuiqiuYuan袁辉球
Feng Du(杜锋) Shuaishuai Luo(罗帅帅) Rui Li(李蕊) Brenden R.Ortiz Ye Chen(陈晔)Stephen D.Wilson Yu Song(宋宇) and Huiqiu Yuan(袁辉球)
1Center for Correlated Matter and Department of Physics,Zhejiang University,Hangzhou 310058,China
2Zhejiang Province Key Laboratory of Quantum Technology and Device,Department of Physics,Zhejiang University,Hangzhou 310058,China
3Materials Department and California Nanosystems Institute,University of California Santa Barbara,Santa Barbara,CA 93106,United States
4State Key Laboratory of Silicon Materials,Zhejiang University,Hangzhou 310058,China
Keywords: kagome superconductor,temperature-pressure phase diagram,superconducting dome,hydrostatic pressure
1. Introduction
The kagome metalsAV3Sb5(A= K, Rb, Cs)[1-4]have drawn significant interest recently,with focus on(1)superconductivity with topological surfaces states,[2]which raises the prospects of realizing topological superconductivity and Majorana zero modes;[5,6](2)a large anomalous Hall effect in the absence of local moments,[7-9]which possibly results from a charge order that breaks time-reversal symmetry;[10-13](3)the nature of the superconducting pairing,with evidence for nodeless superconducting gaps,[14-16]as well as indications for nematic superconductivity;[17]and (4) the sensitivity of superconductivity and charge order to pressure-tuning,[18-26]likely related to the presence of competing instabilities on the kagome lattice.[27-31]
With the application of pressure, the charge order becomes quickly suppressed and superconductivity is enhanced,forming a superconducting dome with maximalTcnear the pressure at which the charge order disappears.[18-24,26]While this superconducting dome can be understood to result from the competition between superconductivity and charge order, a second superconducting dome is found inAV3Sb5at higher pressures,[18,21-24]whose origin remains unclear.Factors that may be relevant for the formation of the second superconducting dome include a pressure-induced Lifshitz transition,[22]magnetism suppressing superconductivity in the region between the two superconducting domes,[32]reconstruction of the Sb bands due to the formation of interlayer Sb-Sb bonds,[33]and a distinct high-pressure phase revealed through resistivity anomalies.[21]While two-dome superconductivity is found in allAV3Sb5materials via resistivity measurements,[24]studies of the corresponding normal state from which superconductivity emerges has been limited.[21,22]In particular, it remains unclear whether resistivity anomalies associated with the second superconducting dome in KV3Sb5[21]are also present in RbV3Sb5and CsV3Sb5.
In addition, single crystal diffraction revealed a highly anisotropic compression under hydrostatic pressure, with theclattice parameter reducing significantly more than the inplane lattice parameters,[33]which suggests hydrostaticity of measurements under pressure may strongly affect experimental results and the determined phase diagrams. Therefore, to compare results on theAV3Sb5series obtained using different experimental techniques, it is important to reproduce the corresponding experimental hydrostaticity.
In this work, we systematically investigated the temperature-pressure phase diagram of RbV3Sb5via measurements of electrical resistance, applying pressure using a liquid pressure medium. It is found that the superconducting transition temperatureTcin RbV3Sb5increases from 0.9 K under ambient pressure to about 4.5 K at 1.2 GPa, with the charge order disappearing abovepc, which occurs between 1.4 GPa and 1.6 GPa.Tcis then gradually suppressed with increasing pressure and reaches a minimum of about 0.4 K around 14.3 GPa. With further increase of pressure, anotherTcmaximum of about 1.2 K is observed around 22.8 GPa,indicating the presence of a second superconducting dome. For pressures22.8 GPa,Tcin the second superconducting dome is suppressed with increasing pressure, and distinct features are detected in the normal state resistance,possibly related to a high-pressure phase. These behaviors are similar to pressurized KV3Sb5,[21]suggesting that they are common in theAV3Sb5series under high pressure,and are closely related to the suppression of superconductivity in the second dome.
2. Experimental details
Single crystals of RbV3Sb5were grownusing a self-flux method.[1,2]Electrical resistance measurements under pressure were carried out using a diamond anvil cell(DAC),with silicon oil as the pressure medium,which allows for better hydrostaticity compared to solid pressure media. Single crystals of RbV3Sb5were polished and cut into square pieces,and then loaded into a Be-Cu diamond anvil cell with a 400-µmdiameter culet. The ruby fluorescence method was used to determine the values of pressure inside the DAC at room temperature,before and after the measurements. All electrical resistance measurements from room temperature down to 0.3 K were performed in a Teslatron-PT system with an Oxford3He insert. For measurements with an applied magnetic field, the field was applied along thec-axis.
3. Results
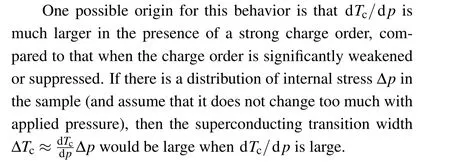
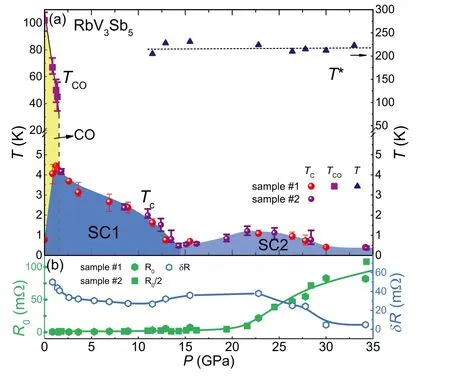
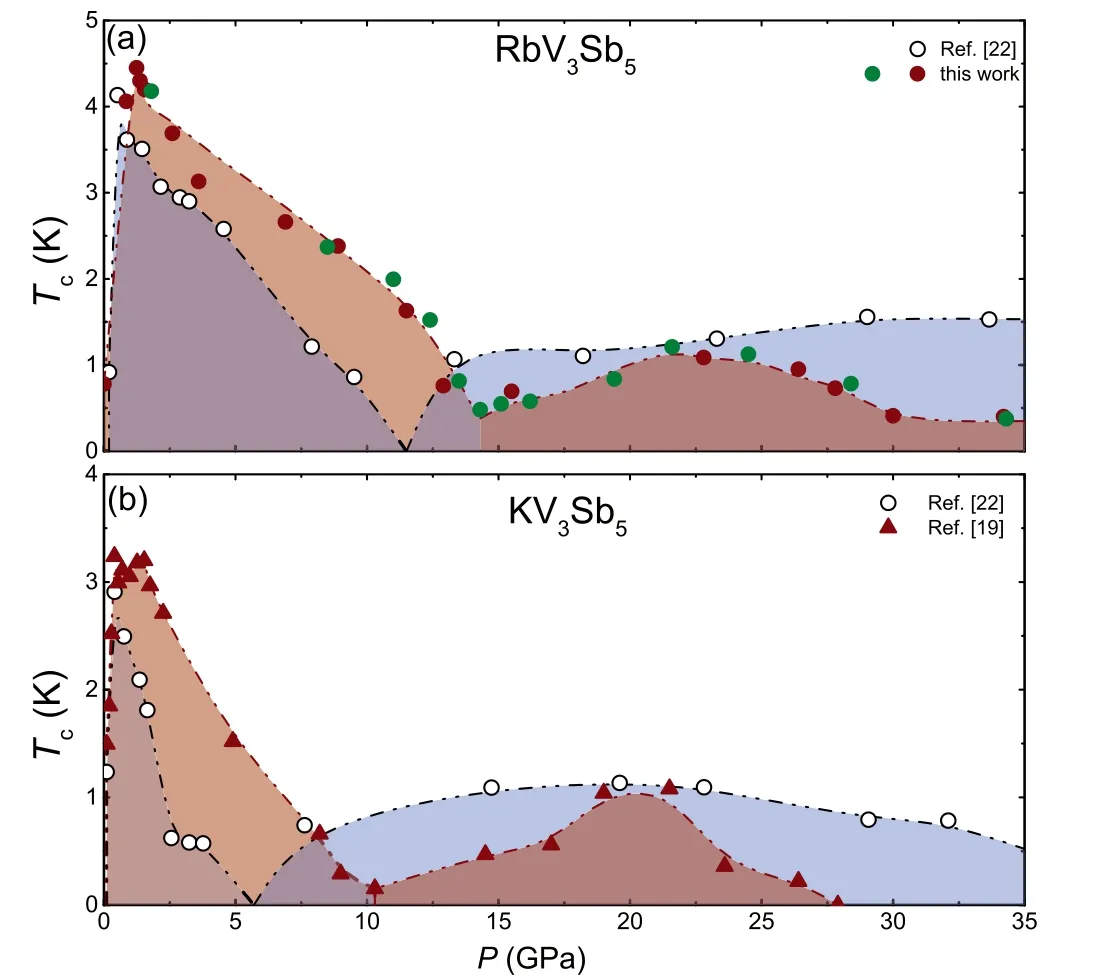
The measured electrical resistanceR(T) for sample #1 with pressures from 0.9 GPa up to 34.2 GPa is shown in Figs.1(a)-1(d),with the corresponding dR/dTcurves shown in Figs.1(e)-1(g). Examining the behavior ofR(T)in the normal state,clear anomalies associated with the charge ordering temperatureTCOcan be seen up to 1.4 GPa,withTCOdecreasing with increasing pressure [Fig. 1(a)]. The values ofTCOcan be determined from the anomaly in the dR/dTcurves,as shown in Fig. 1(e), which becomes indiscernible at 1.6 GPa.These results suggest that the charge order disappears at a critical pressurepcbetween 1.4 GPa and 1.6 GPa.pcin RbV3Sb5is larger than that in KV3Sb5(≈0.5 GPa),[21]consistent with the idea that larger alkaline metal ions exert negative chemical pressure,although it should be noted that additional effects may also be at play,as suggested by the complex evolution ofTcwith pressure in CsV3Sb5and RbV3Sb5forp In the pressure range from 2.6 GPa to 8.9 GPa,R(T) in the normal state is largely unchanged with increasing pressure [Fig. 1(b)]. In contrast, in the pressure range from 11.5 GPa to 27.8 GPa, the values ofR(T) increase with increasing pressure,with the increase particularly prominent forp22.8 GPa[Fig.1(c)]. This difference between the results in Figs. 1(b)and 1(c) is largely due to the residual resistanceR0,which is the value ofR(T)just before the onset of superconductivity. On the other hand, the variation ofR(T) with temperature,which can be captured byδR=R(300 K)-R0,stays nearly unchanged from 2.6 GPa to 22.8 GPa,but starts to decrease dramatically whenp22.8 GPa. Clear anomalies in dR/dT,with a minimum atT*~220 K[Figs.1(f)and 1(b)],are detected forp11.5 GPa. It should be noted that since dR/dTexhibits multiple anomalies aroundT*,with possible additional features above room temperature,T*should be considered as a characteristic temperature rather than a transition temperature. Fig. 1. (a)-(d) Electrical resistance R(T) of RbV3Sb5 sample #1 in various pressure ranges. (e)-(g) The corresponding dR/dT curves, shifted vertically for clarity. TCO is the onset temperature of the charge order,and T* corresponds to a minimum in dR/dT. For even higher pressures of 30.0 GPa and 34.2 GPa,the normal stateR(T) becomes qualitatively different: compared to lower pressure values,δRis much smaller,R0becomes much larger[Fig.1(d)],and a subtle upturn inR(T)is observed forT20 K. In addition, the dR/dTanomaly associated withT*becomes more dominant forp30.0 GPa,due to the dramatic decrease ofδR(and thus the magnitude of dR/dT) at these pressures. These behaviors are similar to KV3Sb5at high pressures,[21]and can be collectively attributed to the formation of a high-pressure phase. Since the high-pressure phase exhibits a smallδRand a largeR0, the observation thatδRbegins to drop whileR0begins to increase forp22.8 GPa suggests that the highpressure phase onsets around 22.8 GPa. On the other hand,signatures ofT*already appear for 11.5 GPa, a significantly lower pressure compared to that whenδRbegins to drop andR0begins to increase, suggesting that is not unique to the high-pressure phase. More work is needed to definitively pin down the phase boundary of the high-pressure phase in the temperature-pressure phase diagram and elucidate the origin of the resistance anomalies aroundT*. Figure 2 zooms into low temperatures to examine the evolution of superconductivity in RbV3Sb5sample#1,as a function of the applied pressure. For pressures from 0.9 GPa to 2.6 GPa [Fig. 2(a)],Tcis bunched around 4 K, significantly higher thanTc< 1 K under ambient pressure.[3]A prominent feature is that the superconducting transition is significantly broader for 0.9 GPa, compared to those from 1.2 GPa to 2.6 GPa,which suggests that a broad superconducting transition is correlated with the presence of a strong charge order. It should be noted that while signatures of the charge order are also detected for 1.2 GPa and 1.4 GPa, the corresponding dip in dR/dTis significantly weakened compared to that at 0.9 GPa, which indicates that the magnitude of the charge order parameter becomes significantly reduced. A similar sharpening of the superconducting transition with weakening of the charge order upon applying pressure is also observed in KV3Sb5,[21]suggesting that it is a common feature of theAV3Sb5series. Fig.2. Zoomed-in electrical resistance R(T)of RbV3Sb5 sample#1 under various pressures to show the evolution of superconductivity with pressure. Alternatively, domain boundaries of a period-2 charge order could exhibit enhanced filamentary superconductivity,leading to a broad superconducting transition inR(T). Such a picture was invoked to account for enhanced superconductivity seen in the period-2 charge order phase of Ba1-xSrxNi2As2,while such an effect was absent for the period-3 charge order phase in the same material series.[34]Given the charge order inAV3Sb5is period-2 in theab-plane,[2]such a mechanism may also contribute to its broadened superconducting transition under ambient and low pressures,where the charge order is substantial. In the pressure range from 3.6 GPa to 11.5 GPa[Fig. 2(b)],Tcgradually reduces with increasing pressure, which in combination with results in Fig. 2(a), evidences a superconducting dome with maximalTcaroundpc.Such a behavior was previously reported for theAV3Sb5materials,[18-21,24]and likely results from a competition between charge order and superconductivity, without a prominent role of quantum criticality.[21] Upon further increasing pressure,Tcfurther drops for 12.9 GPa and 15.5 GPa, but becomes enhanced again at 22.8 GPa[Fig.2(c)].This suggests the presence of a minimum inTcbetween 12.9 GPa and 22.8 GPa,and signifies the appearance of a second superconducting dome. For pressures in the range from 26.4 GPa to 34.2 GPa[Fig.2(d)],Tcdecreases with increasing pressure,indicating that the maximalTcof the second superconducting dome appears atp<26.4 GPa. Moreover, the superconducting transition becomes sharpened for 30.0 GPa and 34.2 GPa, possibly related to the high-pressure phase,with clear signatures in the normal state.It is interesting to note that the suppression of superconductivity in RbV3Sb5is less significant compared to that in KV3Sb5, as the highpressure phase appears. Compared to superconducting transitions forp ≤2.6 GPa, those forp ≥3.6 GPa are generally broader and less smooth,possibly related to a larger distribution of stress or pressure-induced defects in the crystal. To clarify the evolution ofTcnear the boundary of the two superconducting domes, we measuredR(T) nearTcfor RbV3Sb5sample #2, with results shown in Fig. 3. Upon increasing pressure from 1.8 GPa up to 14.3 GPa [Fig. 3(a)],Tcmonotonically decreases with increasing pressure,with the value ofTc(determined through the midpoint of the superconducting transition) reaching a minimum of about 0.4 K at 14.3 GPa. With further increase of pressure,Tcbecomes slightly enhanced at 15.1 GPa,and furthers increases with increasing pressure up to 21.6 GPa [Fig. 3]. Upon further increase of pressure,Tcagain reduces with increasing pressure[Fig.3].These measurements on sample#2 are consistent with those for sample #1 [Fig. 2] in establishing the presence of two superconducting domes,and further clarifies that the minimum inTcbetween the two domes occurs around 14.3 GPa. To probe the superconducting state under various pressures, we chose three representative pressures and measured the resistance for sample #1 under an applied magnetic field along thec-axis,with results shown in Fig.4. The three pressures correspond to states with coexisting charge order and superconductivity[0.9 GPa,Fig.4(a)],without charge order and inside the first superconducting dome[2.6 GPa,Fig.4(b)],and inside the second superconducting dome[27.8 GPa,Fig.4(c)].As can be seen,superconductivity is gradually suppressed with applied field in all cases,which allows us to extract the upper critical fieldµ0Hc2(T)for various pressures. The upper critical fieldsµ0Hc2(T) are determined as whenR(T) drops toR0/2, and are summarized in Fig.4(d).µ0Hc2(T)could be fit with the Werthamer-Helfand-Hohenberg(WHH)model[35]for the three pressures,with fits shown as dashed lines in Fig. 4(d). Previously, it was shown in KV3Sb5that a much largerµ0Hc2(T=0) (for field along thec-axis)is observed for the second superconducting dome,even when theTcis lower compared to the first superconducting dome.[21]For RbV3Sb5, the values ofT2c/µ0Hc2(T=0)are respectively found to be 13.3, 15.2 and 1.9 (K2/T), for 0.9 GPa,2.6 GPa and 27.8 GPa.The significantly smaller ratio at 27.8 GPa points toµ0Hc2(T=0)also becoming enhanced relative toTcin the second superconducting dome, similar to KV3Sb5. Fig. 3. Electrical resistance R(T) of RbV3Sb5 sample #2 near the superconducting transition under various pressures, showing the evolution of superconductivity with pressure. Fig.4. Low-temperature electrical resistance R(T)of RbV3Sb5 sample#1 under various c-axis magnetic fields,for applied pressures(a)0.9 GPa,(b) 2.6 GPa, and (c) 27.8 GPa. (d) The upper critical fields of RbV3Sb5, as a function of temperature under pressures of 0.9 GPa, 2.6 GPa, and 27.8 GPa. Fits to the WHH model are shown as dashed lines. The phase diagram obtained from electrical resistance measurements under pressure is shown in Fig.5(a).Tcis determined as whenR(T)drops toR0/2,T*from a minimum in dR/dT[Fig.1(g)],andTCOfrom the dip in dR/dT[Fig.1(e)].In KV3Sb5, it was shown that the decrease ofTcabovepcis much more gradual,compared to the enhancement ofTcbelowpc, resulting in the first superconducting dome being highly asymmetric.[21]In the case of RbV3Sb5,it can be seen that the same qualitative behavior is observed. Various regimes in the phase diagram can be identified through the presence of a resistivity anomaly atT*[Fig.5(a)]and signatures inδRandR0[Fig. 5(b)]. The anomaly in dR/dTassociated withT*first appears at 11.5 GPa, just before superconductivity crossovers from the first dome into the second.R0increases slowly with increasing pressure up to~22.8 GPa,above which it increases at a much faster rate up to~30 GPa,and finally plateaus forp30 GPa.δRexhibits a gradual decrease with increasing pressure up to 1.4 GPa(≈pc),then evolves slowly up to~22.8 GPa,before dropping precipitously forp22.8 GPa. SinceTcin the second superconducting dome begins to decrease with increasing pressure forp22.8 GPa,a largeR0and a smallδR,which are signatures of a possible high-pressure phase,appear to be correlated with suppression ofTcin the second superconducting dome.A similar large drop ofδRand an increase inR0are also observed in KV3Sb5, and are also associated with the suppression ofTcin the second superconducting dome.[21] Fig.5. (a)The temperature-pressure phase diagram of RbV3Sb5. Two superconducting regions(SC1 and SC2)and a charge-ordered phase(CO)are identified. Points under ambient pressure are from Ref.[3]. TCO is the onset temperature of the charge order, Tc is the superconducting transition temperature,and T* is a characteristic temperature associated with a minimum in dR/dT. The errors bars for TCO are determined from the half width at half minimum of the dip in dR/dT. The errors bars for Tc characterize the width of the superconducting transition,with values corresponding to 20%and 80% of R0, where R0 is the resistance just before the onset of superconductivity. In cases where R(T)does not drop to 20%of R0 at the lowest measured temperature,R(T)is extrapolated to obtain an estimate. (b)Pressure dependence of the residual resistance R0 and the electrical resistance change δR=R(300 K)-R0. R0 for sample#2 is divided by 2,and plotted together with R0 for sample#1. δR was only measured for sample#1. The solid lines are guides-to-the-eyes. Our observation of two-dome superconductivity is similar to previous works onAV3Sb5,[18,21-24]and suggests that such a feature is qualitatively robust,both with regard to variations of the alkaline metal and experimental hydrostaticity.On the other hand, the additional modulation ofTcforp Despite the qualitative agreement on the presence of twodome superconductivity in the literature, directly comparing phase diagrams for RbV3Sb5from this work and Ref. [24][Fig.6(a)],and for KV3Sb5from Refs.[21,24][Fig.6(b)],reveals clear differences. The differences likely originate from hydrostaticity of the experiments, which either used silicon oil as a liquid pressure medium(solid symbols,this work and Ref. [21]), or cubic boron nitride as a solid pressure medium(open symbols, Ref. [24]), with the former typically associated with better hydrostatcity. As can be seen,in the phase diagrams of both RbV3Sb5and KV3Sb5obtained using a liquid pressure medium,a larger pressure is required to suppress the first superconducting dome (and induce the onset of the second dome), compared to experiments using a solid pressure medium. On the other hand, superconductivity in the second dome appears more easily suppressed using a liquid medium,while it is more persistent when using a solid medium. While the origin for these systematic differences remains unclear, a key factor is the strongly anisotropic compression revealed under pressure, with thec-axis lattice parameter reduced by a staggering~20% under 20 GPa in CsV3Sb5.[33]Since typical studies on layered materials in a DAC apply force along thec-axis, nonideal hydrostaticity could lead to larger-thannominal compressive pressure on theab-plane. This may contribute to the smaller nominal pressures in experiments using a solid pressure medium, which are needed to access, for example,the dip inTcbetween the two superconducting domes.These observations point to the importance of hydrostaticity for experimentally determined phase diagrams, which should be taken into consideration when comparing experimental results onAV3Sb5obtained under high-pressures. Comparing the present results on RbV3Sb5with previous work on KV3Sb5[21][solid symbols in Figs. 6(a) and 6(b)], it can be seen a higher suppress of the first superconducting dome in RbV3Sb5, consistent with the notion that a larger atomic radius corresponds to negative chemical pressure. More importantly, clear changes in the normal state transport (R0andδR), which can be attributed to a highpressure phase, are seen under pressures associated with the suppression ofTcin the second superconducting dome, for both RbV3Sb5and KV3Sb5.[21]With increasing pressure,the dR/dTanomaly nearT*first appears at the edge of the first superconducting dome, and persists across the second superconducting dome. Previous work on KV3Sb5[21]also associated the resistance anomalies aroundT*with the high-pressure phase and the suppression ofTcin the second superconducting dome. Examination of the published data reveals that these anomalies in KV3Sb5also extend to lower pressures,suggesting that they are not unique to the high-pressure phase,similar to the present results on RbV3Sb5. Fig. 6. (a) Comparison between superconducting phase diagrams of RbV3Sb5 from this work and Ref. [24]. The maroon symbols are from RbV3Sb5 sample #1, and the green symbols are from sample #2.(b)Comparison between superconducting phase diagrams of KV3Sb5 from Refs.[21,24]. Tc in this work and Ref.[21]is defined as when the resistance(resistivity) drops to R0/2 (ρ0/2), whereas it is determined from 0.9ρ0 in Ref.[24]. The dashed lines are guides-to-the-eyes. It is interesting to note that for pressures associated with the second superconducting dome in CsV3Sb5,Raman spectroscopy detected distinct signatures in the phonon spectrum,[22]and first-principles calculations found a structural instability[32]and a reconstruction of the Fermi surface,[33]suggesting that the normal state from which superconductivity emerges in the second dome of CsV3Sb5is distinct from that at lower pressures, similar to the present findings for RbV3Sb5. Further work is needed to understand the nature of high-pressure phases inAV3Sb5, as well as clarify how they are related to the second superconducting dome. In conclusion, we have systematically studied the electrical resistance of RbV3Sb5by applying hydrostatic pressure via a liquid pressure medium,revealing the presence of two superconducting domes and distinct features in the normal state transport associated with the second dome,similar to KV3Sb5.In both systems,the shape of the first superconducting dome is highly asymmetric,with maximalTcnear the border of the ambient pressure charge order. With increasing pressure,anomalies in dR/dTnearT*~220 K appear at the edge of the first superconducting dome and persist across the second dome.The suppression of superconductivity in the second superconducting dome is associated with significant changes in the normal state transport,which can be attributed to a high-pressure phase. The commonality of a second superconducting dome at high pressures and behaviors in the normal state resistance for both RbV3Sb5and KV3Sb5suggests a link between these phenomena. Acknowledgments This work was supported by the National Key R&D Program of China (Grant Nos. 2017YFA0303100 and 2016YFA0300202), the Key R&D Program of Zhejiang Province, China (Grant No. 2021C01002), the National Natural Science Foundation of China (Grant Nos. 11974306 and 12034017),and the Fundamental Research Funds for the Central Universities of China. S.D.W. and B.R.O. gratefully acknowledge support via the UC Santa Barbara NSF Quantum Foundry funded via the Q-AMASE-i program under award DMR-1906325. B.R.O. also acknowledges support from the California NanoSystems Institute through the Elings fellowship program.


4. Discussion and conclusion
杂志排行
Chinese Physics B的其它文章
- Superconductivity in octagraphene
- Soliton molecules and asymmetric solitons of the extended Lax equation via velocity resonance
- Theoretical study of(e,2e)triple differential cross sections of pyrimidine and tetrahydrofurfuryl alcohol molecules using multi-center distorted-wave method
- Protection of entanglement between two V-atoms in a multi-cavity coupling system
- Semi-quantum private comparison protocol of size relation with d-dimensional GHZ states
- Probing the magnetization switching with in-plane magnetic anisotropy through field-modified magnetoresistance measurement