Pressure-and temperature-dependent luminescence from Tm3+ions doped in GdYTaO4
2022-01-23PengYuZhou周鹏宇XiuMingDou窦秀明BaoQuanSun孙宝权RenQinDou窦仁琴
Peng-Yu Zhou(周鹏宇) Xiu-Ming Dou(窦秀明) Bao-Quan Sun(孙宝权) Ren-Qin Dou(窦仁琴)
Qing-Li Zhang(张庆礼)3, Bao Liu(刘鲍)1, Pu-Geng Hou(侯朴赓)1, Kai-Lin Chi(迟凯粼)1, and Kun Ding(丁琨)2
1School of Science,Northeast Electric Power University,Jilin 132012,China
2State Key Laboratory of Superlattices and Microstructures,Institute of Semiconductors,Chinese Academy of Sciences,Beijing 100083,China
3Key Laboratory of Photonic Devices and Materials,Anhui Institute of Optics and Fine Mechanics,Chinese Academy of Sciences,Hefei 230031,China
Keywords: rare-earth tantalate,photoluminescence,high pressure,Raman
1. Introduction
In recent years, researches about the spectra of Tm3+-doped materials have been continually intensified for their potential applications. Owing to its rich energy levels, Tm3+ion exhibits outstanding up-conversion for near-infrared(NIR)excitations[1-3]and down-conversion for ultraviolet (UV)excitations.[4-6]With the up-conversion mechanism and the down-conversion mechanism,Tm3+-doped materials can generate UV emissions by1D2→3H6transition, blue emissions by1D2→3F4transition,blue-green emissions by1G4→3H6transition, red emissions by1G4→3H4and3F2,3→3H6transitions, NIR emissions by3H4→3H6and3F4→3H6transitions, making them valuable for applications in optical display,[1,4,6]optical sensing,[1,6]lighting,[1,4,6]biological labeling,[1-3,7]quantum efficiency enhancing for solar cells,[2,4,5]fiber optics,and medical surgery.[8]
Rare-earth tantalates withLnTaO4(Ln= Y, Gd, La,Sc, Lu) stoichiometry are promising host materials for rareearth activator ions,[9-12]which have high density and hardness values,[9,13,14]high x-ray and UV absorptions,[11-13]high chemical and physical stabilities.[9-14]Moreover,owing to the low symmetry and strong crystal field of this kind of host,activator ions doped can have a high photoluminescence (PL)efficiency.[9-12]Considering these advantages,LnTaO4could be promising hosts for Tm3+ions. The structural stability and thermodynamic properties ofLnTaO4were partially investigated.[9,10,13,14]Extensive studies still need to be performed on this kind of material,to understand the mechanical and structural properties and the luminescent properties of activator ions doped.
In this work, luminescent properties of Tm3+-doped GdYTaO4are studied with emphasis on its dependence of temperature and pressure to explore its potential applications.Moreover, to further understand the pressure-dependent behavior of PL intensity of the doped Tm3+ions and the structural stability of the host, high-pressure Raman spectra of GdYTaO4are measured and analyzed.
2. Experiment
The sample for PL measurements was cleaved from a Tm3+:GdYTaO4crystal[10]grown by the Czochralski method.In the corresponding precursor, molar ratio of metal ions Tm3+:Y3+:Gd3+:Ta5+was 1:10:39:50.[10]A GdYTaO4sample and two reference samplesLnTaO4(Ln=Gd,Y)were prepared by the solid-phase reaction method for Raman measurements. The precursor of GdYTaO4was a mixture of Y2O3,Gd2O3,and Ta2O5,with a molar ratio of 1:4:5. The precursor ofLnTaO4was a mixture of Ln2O3and Ta2O5, with a molar ratio of 1:1. All these precursors were thoroughly ground and sintered at 1550°C for 12 h, then naturally cooled down to room temperature. To facilitate the subsequent tests,all these samples were finely powdered by ball milling(Pulverisette 6,FRITSCH).Room temperature and low temperature structures of Tm3+:GdYTaO4were characterized using an x-ray diffractometer(TTR3,Rigaku),while room temperature structures of GdYTaO4,GdTaO4,and YTaO4were characterized using another x-ray diffractometer(DX-2700B,Haoyuan Instrument).
High pressure was generated using a diamond anvil cell(DAC). A 250-µm hole mechanically drilled in a stainless steel gasket was used as sample chamber. A little of a sample powder was loaded into the chamber by a needle.A 4:1 methanol-ethanol mixture was used as the pressuretransmitting medium,which was hydrostatic up to 10 GPa.[15]The pressure value was determined using the ruby luminescence technique.[16]
For PL measurements,a 454-nm diode laser was used as excitation source,and the incident power was 0.3 mW.For Raman measurements,a 632.8-nm He-Ne laser was used as excitation source,the incident power is 3 mW.All spectra were measured using a spectrometer consisting of a monochromator(HRS-500MS-NI, Princeton Instruments) with a focal length of 0.5 m and a Peltier-cooled silicon charge-coupled device(PIX-400BRX, Princeton Instruments). The corresponding spectral resolution was better than 2 cm-1. Moreover,a cryostat(Montana Instruments)was used for the varying temperature PL measurements.
For time-resolved PL measurements, an acousto-optical modulator (AOM) triggered by a signal generator with a frequency of 500 Hz was used to periodically switch the path of the exciting laser to realize a pulsed excitation. In each cycle,the sample was excited first by the laser as the AOM was on with a duration of 10 µs. Then the laser was switched to somewhere as the AOM was off with a duration of 990µs.The sample PL was selected using the monochromator and sent to a silicon avalanche photodiode(Si-APD).The Si-APD output was input into a multi-channel scaler triggered by the signal generator and synchronized with the pulsed excitation. The measuring time range was 2 ms, the width of each time bin was 0.5µs. Such a time resolution of the setup enabled us to study the PL dynamic of Tm3+:GdYTaO4.
3. Results and discussion
The x-ray diffraction(XRD)patterns of Tm3+:GdYTaO4at 300 K and 77 K,shown in Fig.1(a),are both consistent with the ICDD card file 24441, indicating that the sample studied has a monoclinic fergusonite structure belonging toI2/aspace group symmetry(or M-type phase for short)in a broad temperature range. Structure diagrams of M-type Tm3+:GdYTaO4are shown in Fig.1(b). In this structure,eachLn(Ln=Gd,Y,Tm)atom is coordinated by eight O atoms, forming anLnO8dodecahedron, while each Ta atom is coordinated by four O atoms, forming a TaO4tetrahedron. TheLnO8dodecahedra are arranged in edge-sharing zig-zag chains along both theaandcaxes. The zig-zag shift is directed along thebaxis. The TaO4tetrahedra are located in the space defined by the zigzag chains and share corners with four adjacentLnO8dodecahedra. The lattice parameters of Tm3+:GdYTaO4were obtained using the Rietveld refinement method:[9]a=5.39 ˚A,b=11.03 ˚A,c=5.08 ˚A,andβ=95.61°. More information about the structure can be found in Refs.[9,10].
Under the 454-nm excitation,the intense emissions from3H4→3H6transition of Tm3+[4,5,7]in GdYTaO4are observed(see Fig.1(c)). These emissions just lie in the first biological window 750 nm-950 nm, which allows for deep light penetration and producing a high biological labeling contrast.[3]Moreover, as the figure shows, a diode laser with a longer wavelength (such as 640 nm) can also be used as excitation source to obtain emission of3H4→3H6transition,indicating that the potential applications of Tm3+:GdYTaO4is flexible.

Fig.1. (a)XRD patterns of Tm3+:GdYTaO4 measured at 300 K and 77 K,under zero pressure. The standard XRD pattern of M-type GdTaO4 at ambient condition is also depicted. (b) Structural projections on {100}, {001}, and {010} planes for Tm3+:GdYTaO4. Purple spheres represent Ln(Ln=Gd,Y,Tm)atoms;green spheres represent Ta atoms;small red spheres denote O atoms. (c)PL spectra of Tm3+:GdYTaO4 under ambient condition,measured using 454-nm and 640-nm lasers as excitation source.
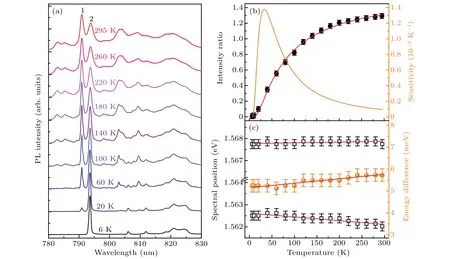
Fig. 2. (a) Normalized PL spectra of 3H4 →3H6 transition of Tm3+:GdYTaO4 at zero pressure and various temperatures. (b) Intensity ratio I1/I2 between peaks 1 and 2(solid black circles)and temperature sensitivity of I1/I2 (orange line)each as a function of temperature. (c)Spectral positions of peaks 1 and 2(open black squares)and their energy difference(solid orange balls)each as a function of temperature. Red lines in panels(b)and(c)represent fitting curves. Error bars in panels(b)and(c)denote the experimental uncertainties in the determination of the corresponding data.
Temperature-dependent PL of Tm3+:GdYTaO4is studied, some representative spectra recorded are shown in Fig.2(a). As temperature decreases,the intensity of the peak at~790 nm (peak 1) decreases, while intensity of the peak at~793 nm(peak 2)increases. The relative change of intensities of the two peaks indicates the population change of the higher and the lower Stark levels of3H4. The intensity ratiosI1/I2between peaks 1 and 2 at different temperatures are calculated(see Fig.2(b)),and then fitted using a Boltzmann-type population distribution function[17]
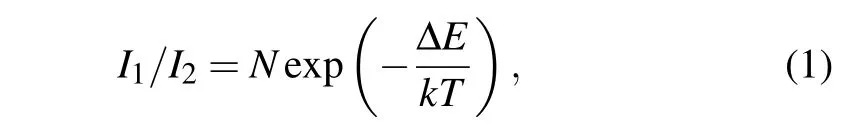
whereI1andI2are the maximum intensities of peaks 1 and 2, respectively;Nis a constant; ΔEis the energy gap of the thermally coupled levels;kis the Boltzmann constant;Tis the absolute temperature. The fitting result isI1/I2=(1.63±0.02)exp[-(64±2)/T]. The fitted ΔEvalue is 5.5±0.2 meV,which is consistent with the value 5.8 meV measured under ambient condition,and similar to that of Tm3+:Y3Al5O12.[18]Based on the fitting result,the temperature sensitivity ofI1/I2is calculated from the following equation:[17]

As figure 2(b) shows, the maximum sensitivity ofI1/I2is 0.014 K-1at 32 K. Moreover, thermal shifts of peaks 1 and 2 are also analyzed. As figure 2(c) shows, peak 1 shifts little, while peak 2 shifts toward the lower energy side slowly with temperature increasing. This leads the energy difference between the two peaks to increase linearly with temperature increasing at a rate of 2.0±0.2µeV/K.
PL spectra of Tm3+:GdYTaO4under high pressures up to~8 GPa are measured. As figure 3(a)shows, these emission peaks shift linearly with pressure increasing. Compared with the emission peaks in the shorter wavelength range,the emission peaks in the longer wavelength range exhibit more obvious red-shift,resulting in a broader emission band at a higher pressure. This indicates that the overall splitting of the corresponding Stark levels increases with pressure rising, which is due to pressure-induced decreases of Tm-O bond lengths enhancing the crystal-field strength around Tm3+ions.[19]Pressure coefficients of peaks 1 and 2 are obtained based on linear fitting for the spectral position data (see Fig. 3(b)),which are 0.18 meV/GPa and-0.21 meV/GPa. The absolute value of pressure coefficient of peak 2 is larger than that of Tm3+:Y3Al5O12[19]and less than that of Tm3+:LiNbO3.[7]However, in this spectral range, a relatively large pressureinduced blue-shift behavior, just like peak 1, is not observed for these two materials. The opposite shifts of peaks 1 and 2 make the energy difference between peaks 1 and 2 increase linearly with pressure increasing(see Fig.3(b)),which can be described as

where ΔEpis energy difference between peaks 1 and 2 in unit meV,Pis pressure in unit GPa. It should be noted that ΔEpcan be a good parameter for pressure sensing. Compared with the traditional method of optical pressure sensing based on spectral shift of a single emission peak of ruby,[16]the method based on ΔEphas a self-referencing feature and will be more convenient for use. Once a spectrum of Tm3+:GdYTaO4is obtained,the corresponding pressure value can be ascertained without needing any reference parameter value at ambient pressure. Moreover, the temperature sensitivity 2.0 µeV/K(~0.001 nm/K) of ΔEp(see Fig. 2(c)) is much less than that of ruby emission peaks(0.0068 nm/K[20]),indicating that the method proposed has a higher anti-interference capability for temperature fluctuation. The pressure sensitivity of ΔEpis 0.38 meV/GPa, which is less than that of ruby emission peaks (0.92 meV/GPa[20]), but it is good enough to use the Tm3+:GdYTaO4as an optical pressure sensor in the NIR range.

To gain an insight into the PL dynamics of the Tm3+:GdYTaO4under pressure, the time-resolved PL spectrum is also traced. The PL decay curves of peaks 1 and 2 measured at ambient pressure and 7.96 GPa are presented in Figs. 3(c1) and 3(c2), respectively. These decay curves are non-single-exponential, which is due to the cross relaxation(CR) among adjacent Tm3+ions.[4,5]The effective emission lifetimes at different pressures are calculated from the following equation:[4,5]
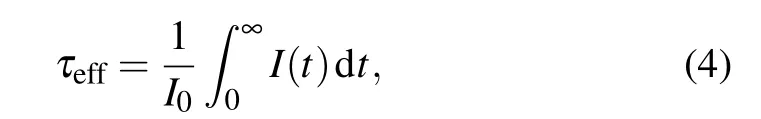
whereI(t) is the PL intensity as a function of timet,I0is the initial PL intensity. As figure 3(d) shows, the emission lifetimes of peaks 1 and 2 decrease with pressure increasing, the estimated pressure coefficients are-0.3 µs/GPa and-6.5 µs/GPa. The decreases of emission lifetime and PL intensity should be mainly due to the enhancement of CR process.[4,5,7,10]Specifically, the CR process is a process of energy transferring from a Tm3+ion in the excited state3H4to a nearby Tm3+ion in the ground state3H6,resulting in the two ions both populating the intermediate state3F4.[7,10]The probability of CR can be elevated by pressure mainly through reducing the Tm3+-Tm3+distances and increasing the overlap integral between3H4→3F4and3H6→3F4transitions.[7]Therefore, a more active CR process at a higher pressure can lead the population of3H4then the lifetime of3H4and the emission intensity of3H4→3H6to decrease. Moreover,the difference between the pressure coefficients of emission lifetimes of peaks 1 and 2 indicates that the corresponding Stark levels of3H4have different sensitivities to the pressureinduced enhancement of the CR process.
The pressure evolution ofI1/I2is also investigated. As figure 3(e) shows,I1/I2decreases in a pressure range up to 6 GPa,and increases with pressure increasing beyond 6 GPa.The discontinuity in the evolution ofI1/I2may indicate a phase transition for the host occurring at a pressure less than 6 GPa.
According to the non-monotonic evolution ofI1/I2, Raman measurements are conducted to explore the structure variation of GdYTaO4under pressure. The phases of GdYTaO4,GdTaO4,and YTaO4samples under ambient condition are ascertained using XRD measurements.As figure 4(a)shows,the XRD patterns of GdYTaO4and GdTaO4are consistent with the ICDD card file 24-441,and the XRD pattern of YTaO4is consistent with the ICDD card file 24-1415,indicating that the three samples are all of M-type phase. Raman spectra of the three samples are shown in Fig. 4(b). According to theoretical studies,[21,22]M-type GdTaO4and YTaO4both have 18 Raman-active modes in the center of the Brillouin zone:

where Agand Bgmodes represent parallel- and crosspolarized Raman scattering, respectively. By comparison,the Raman spectrum of GdYTaO4is more similar to that of GdTaO4than that of YTaO4. However, the Raman modes of GdYTaO4in 100 cm-1-200 cm-1are weaker and broader,which should be due to the increasing of the disorders of the external vibrations of TaO4tetrahedra,[21-23]induced by the portion of Y3+ions.
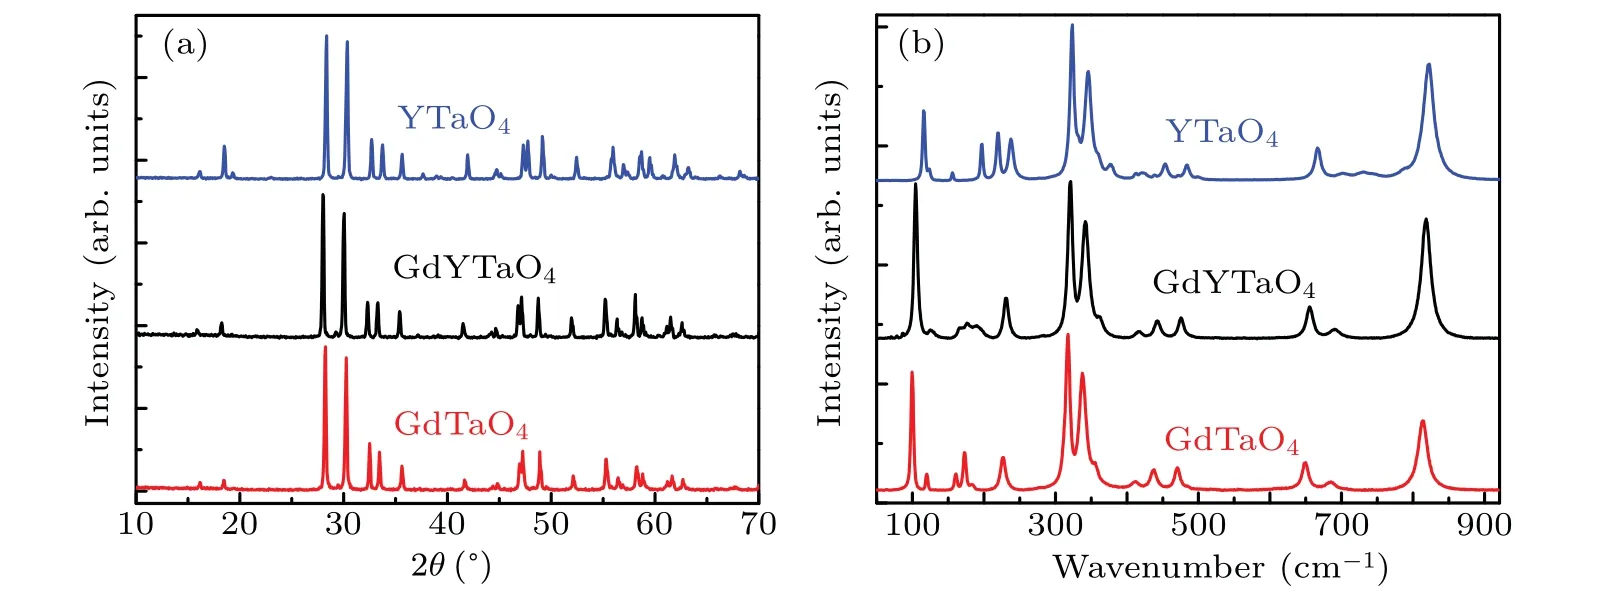
Fig.4. (a)XRD patterns and(b)Raman spectra of GdTaO4,GdYTaO4,and YTaO4 under ambient condition.
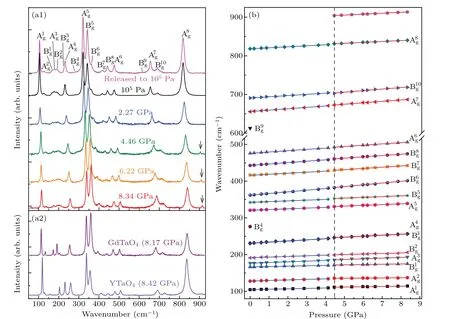
Fig.5. (a1)Raman spectra of GdYTaO4 at room temperature and various pressures. Raman modes are labeled according to Ref.[21]. Gray arrow indicates a peak appearing at the higher pressures. (a2)Raman spectra of GdTaO4 and YTaO4 at room temperature and pressures higher than 8 GPa. (b)Frequencies of Raman modes of GdYTaO4 versus pressure. Blue and red solid lines represent linear fitting curves for the data in the lower(105 Pa-4.14 GPa)and higher(4.46 GPa-8.34 GPa)pressure ranges,respectively. Black dashed line indicates 4.46-GPa pressure.
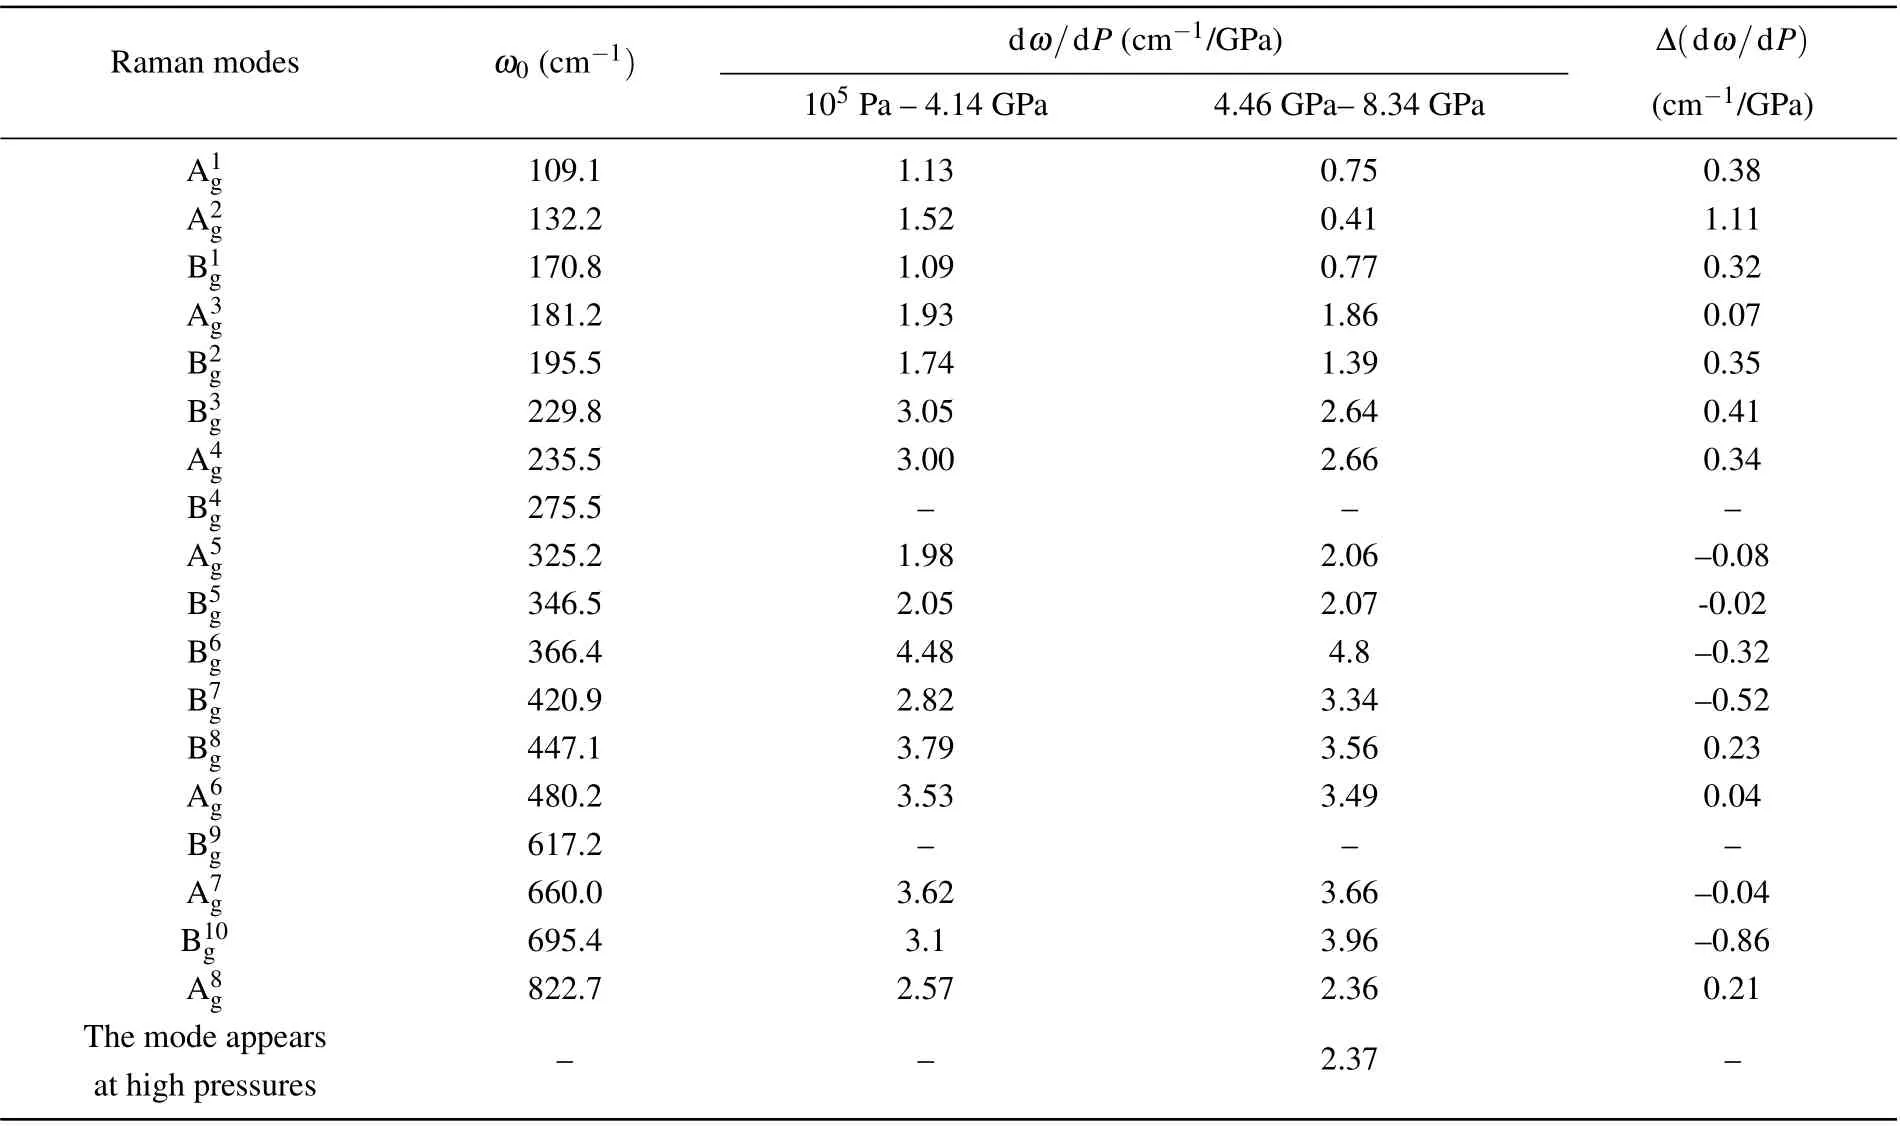
Table 1. Frequencies at ambient pressure ω0, pressure coefficients dω/dP, and pressure coefficient differences Δ(dω/dP) between lower(105 Pa-4.14 GPa)and higher(4.46 GPa-8.34 GPa)pressure ranges for Raman modes of GdYTaO4.
As the Raman spectra in Fig. 5(a1) show, all the Raman modes of GdYTaO4shift toward higher frequencies with pressure increasing, indicating that the force constants between atoms involved in these modes are becoming stronger, because the force constant is proportional to the second power of phonon frequency.[24]This phenomenon can be explained by the enhancement of interaction among atoms due to the pressure-induced lattice shrinking.[24-26]It should be noted that a new peak appears at~904 cm-1under 4.46 GPa, and becomes stronger with pressure increasing. However, no extra peak is found in Raman spectra of GdTaO4and YTaO4in a pressure range larger than 8 GPa (see Fig. 5(a2)). This indicates that a phase transition for GdYTaO4might occur at 4.46 GPa. Evolutions of frequencies of the Raman modes(except B4gand B9g,which are too weak to be traced)for GdYTaO4with pressure are analyzed.Slight discontinuities can be found in these evolutions at 4.46 GPa(see Fig.5(b)),resulting in differences between the pressure coefficients of 105Pa-4.14 GPa and those of 4.46 GPa-8.34 GPa for the Raman modes(see Table 1). This phenomenon coincides with the new Raman peak appearing and the discontinuity in theI1/I2evolution, which could be another evidence for the phase transition deduction.In the process of decompression down to the ambient pressure, the Raman spectrum of GdYTaO4returns to the initial pattern (see Fig. 5(a1)), indicating that the pressure-induced phase transition is reversible for the pressure range attained in this research.
The stability of M-type structure under high pressure was discussed in Refs. [25-27]. The experimental results indicate M-type GdNbO4and EuNbO4can remain stable up to 25 GPa[25]and 20 GPa,[26]respectively. The large pressure stability of M-type rare-earth orthoniobates was explained by the flexibility ofLnO8(Ln=Gd, Eu) polyhedra[25,26]which can accommodate the increasing repulsive and steric stresses induced by pressure, thereby avoiding the transformation to a high pressure phase.[25]This is useful for understanding why the Raman modes observed at ambient pressure for Mtype GdYTaO4can keep well at high pressures. However,the difference between compressibilities of GdO8and YO8polyhedron can complicate the structural evolution of GdYTaO4under pressure. The research of Ref. [27] indicates M-type GdNbO4doped with Eu3+undergoes a phase transition to M′-type structure (with a space group symmetry ofP2/a) at 6.2 GPa,which can be an example for exhibiting the influence of dopants on the pressure stability of M-type structure. As one of the main fingerprints for ascertaining phase transition,the new Raman peaks of Eu3+:GdNbO4found at high pressures are in a spectral range less than 300 cm-1,[27]which is much lower than the new Raman peak of GdYTaO4observed at high pressures. Therefore, the structure of GdYTaO4under pressures beyond 4.46 GPa should not be of M′-type, indicating the structural symmetry of GdYTaO4might not be changed much. The research of Ref.[28]reveals that a subtle phase transition could be triggered at a relatively low pressure for a solid solution(like the sample studied)which seems constituted by two materials with similar structures. This can also support the phase transition deduction for GdYTaO4under high pressure. Moreover, according to the research of Ref. [29] and the observed small difference between the Raman spectra of GdYTaO4measured under pressures below and above 4.46 GPa, the phase transition can be deduced to be isostructural further.
4. Conclusions
The temperature- and pressure-dependent luminescence from3H4→3H6transition of Tm3+:GdYTaO4are studied for the first time. Two main emission peaks at around 790 nm and 793 nm are observed. Their intensity ratioI1/I2evolves exponentially with temperature,showing a potential application in temperature sensing. The highest sensitivity ofI1/I2is found at 32 K to be a value of 0.014 K-1. The energy difference between the two emission peaks increases linearly with pressure rising in a rate of 0.38 meV/GPa, which will be useful for pressure sensing in NIR spectral range. The emission lifetimes of the two emission peaks decrease with pressure rising,which is due to the probability increasing of the CR process.TheI1/I2evolution with pressure is also investigated, and a non-monotonic behavior is revealed.The structural stability of M-type GdYTaO4under high pressures is discussed based on Raman measurements. The recorded Raman spectra indicate that an isostructural phase transition can occur at~4.46 GPa.
Acknowledgements
Project supported by the National Natural Science Foundation of China (Grant No. 11804047) and the Science and Technology Development Program of Jilin City,China(Grant No.201831733).
杂志排行

Chinese Physics B的其它文章
- Superconductivity in octagraphene
- Soliton molecules and asymmetric solitons of the extended Lax equation via velocity resonance
- Theoretical study of(e,2e)triple differential cross sections of pyrimidine and tetrahydrofurfuryl alcohol molecules using multi-center distorted-wave method
- Protection of entanglement between two V-atoms in a multi-cavity coupling system
- Semi-quantum private comparison protocol of size relation with d-dimensional GHZ states
- Probing the magnetization switching with in-plane magnetic anisotropy through field-modified magnetoresistance measurement