Research of NO2 vertical profiles with look-up table method based on MAX-DOAS
2022-01-23YingyingGuo郭映映SuwenLi李素文FushengMou牟福生HexiangQi齐贺香andQijinZhang张琦锦
Yingying Guo(郭映映), Suwen Li(李素文), Fusheng Mou(牟福生),Hexiang Qi(齐贺香), and Qijin Zhang(张琦锦)
Anhui Province Key Laboratory of Pollutant Sensitive Materials and Environmental Remediation,School of Physics and Electronic Information,Huaibei Normal University,Huaibei 235000,China
Keywords: multi-axis differential optical absorption spectroscopy, look-up table method, the cost function,NO2 vertical profile
1. Introduction
With the rapid development of industrialization and urbanization, the pollutants concentrations, such as NO2, have increased significantly in atmosphere, which lead to serious environmental pollution problems. The change in the proportion of air components will lead to a series of atmospheric environmental problems, holding a great influence on the survival and development of human beings.[1]Therefore, it is highly desired to obtain the tropospheric pollutants concentrations and vertical distribution through ground-based observation, which can benefit the pollution control and climate change research.
MAX-DOAS technology can be applied in remote sensing of multi-component air pollutants, in real-time, continuous, and non-contact conditions, which has been widely employed in the space of atmospheric environment monitoring.In recent years, different research groups have proposed various calculation methods for quantitative retrieval of aerosol and trace gas profiles based on MAX-DOAS technology. In general, there are two main methods: the optimal estimation method and the look-up table method. In 2004, Wagneret al.[2]put forward a method to retrieve aerosol extinction applying the absorption information of O4. In 2008,Irieet al.[3]studied the parameterized retrieval algorithm of aerosol and trace gas vertical distribution based on the optimal estimation method. In 2013, Wanget al.[4]have retrieved aerosol optical depth and extinction profiles by using MAX-DOAS and nonlinear optimal estimation method,and they found that the optimal estimation method depends on prior profile and singular values may appear in the retrieval procedure. In order to eliminate the influence of prior profile,Liet al.[5]and Wagneret al.[6]proposed the look-up table method to retrieve aerosol profiles.In 2013,Wuet al.[7]have employed the look-up table method of MAX-DOAS to retrieve aerosol extinction profiles,but just with the focus on the noon period (09:00-13:00). In 2019, Mouet al.[8]used the look-up table method to retrieve the aerosol extinction profiles from 08:00-16:00,but they did not retrieve the trace gas profiles. In this article, the groundbased MAX-DOAS was applied to carry out continuous observation experiments in Huaibei area. Both of the aerosol extinction profiles and trace gas profiles information in the period of 08:00-16:00 from September 26, 2019 to September 30,2019 were retrieved by applying the look-up table method,and the retrieved NO2vertical column densities are compared with the results of CAMS model.
2. Principles and methods
2.1. MAX-DOAS experimental instrument
The experimental instrument applied in this area is onedimensional MAX-DOAS.[9]The experimental instrument is composed of prism, telescope, baffle and its driving device, temperature control system, optical fiber, spectrometer(HR2000+),and control computer.[10]The structure diagram is shown in Fig. 1. The prism starts to rotate under the drive motor, and the scattered light from different angles is introduced into the receiving telescope, and it will gather into the spectrometer through the optical fiber. In order to decrease the retrieval error due to the spectral drift brought by temperature change, a temperature control system is employed to ensure that the spectrometer works at constant temperature (20°C).The measurement wavelength of the spectrometer is 290 nm-420 nm,and the spectral resolution is 0.54 nm.[11]The online monitoring platform automatically adjusts the integration time according to the intensity of the spectrum to obtain the spectrum with high signal-to-noise ratio. The elevation of the telescope changes with the rotation of the driving motor, and the elevation angle values are 1°, 2°, 3°, 4°, 5°, 6°, 8°, 15°, 30°,90°,and the measurement cycle period is 15 minutes.

Fig.1. Experimental setup of MAX-DOAS.
2.2. Retrieval principle of NO2 profile
In this study,MAX-DOAS instrument is applied to measure the O4DSCDαat different elevation angles. The O4VCD is constant in the troposphere, and we use O4DSCDαdivided by O4VCD to convert it into the O4DAMFα(Differential Air Mass Factor). Then the O4DAMFαand the look-up table method are applied to retrieve the aerosol profile information.[12,13]Finally the trace gas profile information is retrieved by the trace gas DSCDαand look-up table method. The look-up table method[5,6]employs finite parameters to represent the aerosol extinction profile and trace gas vertical profile,which include aerosol optical depth(trace gas is VCDs),the boundary layer height,the weight factor of NO2in the boundary layer,etc. Then,combining with Monte Carlo atmospheric radiation transfer inversion model(McArtim),we can simulate the observed values of aerosol and trace gas at different elevation angles under different atmospheric conditions and observation geometry conditions,and thus establish the look-up table database. After that, the retrieval speed of aerosol or trace gas profiles becomes much faster,and the obtained results exhibit high stability. When retrieving aerosol or trace gas profiles, the measured values and the simulated values under various cases in the database are iterated with the cost functionχ2for many times,to find the aerosol or trace gas parameters corresponding to the minimum value ofχ2.Due to the finite parameters of look-up table method,there is no need to assume the prior profiles in advance, which can eliminate the shortcomings of the optimal estimation method.
The trace gas profiles are assumed to be uniformly distributed near the ground (i.e., boundary layer), and the trace gas profiles above the boundary layer decrease exponentially with the increase of height. Therefore the trace gas profilesc(z)can be represented as two layers:
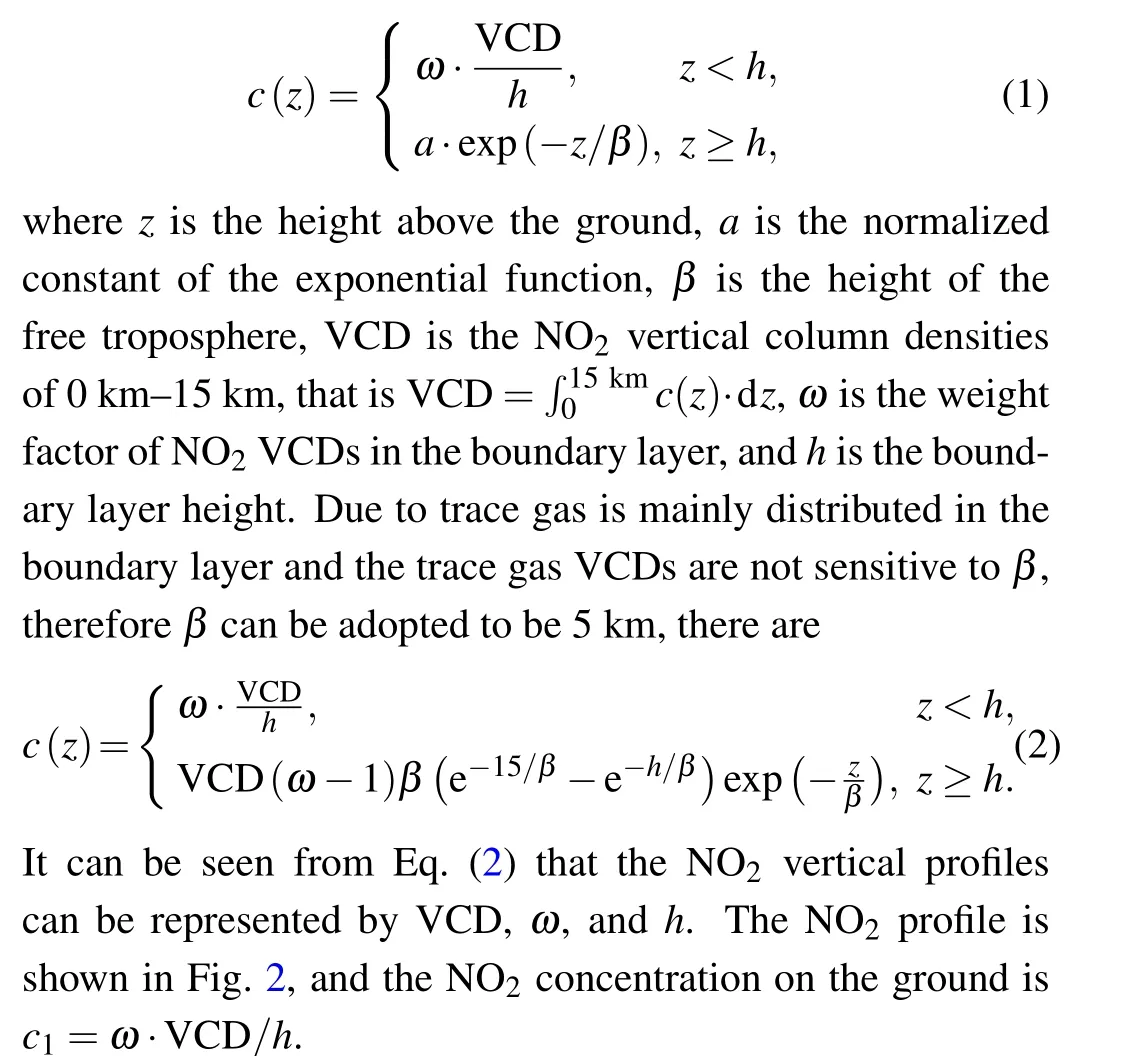
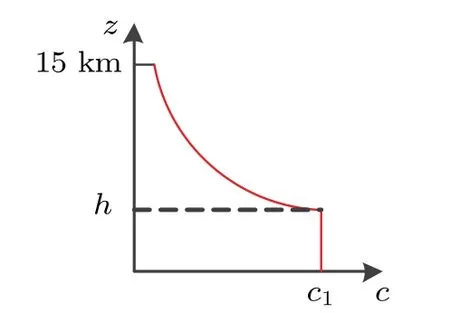
Fig.2. NO2 concentration profile.
The NO2profile is parameterized, and different shapes of NO2profile are obtained by setting different parameters of VCD,ωandh. These different NO2profiles and actual observation conditions are introduced into the atmospheric RTM to simulate and calculate the NO2DSCDs at different elevations with different NO2profiles. By minimizing the NO2DSCDs actually measured by MAX-DOAS and the NO2DSCDs simulated by look-up table method according to the cost functionχ2. The input parameter values corresponding to the current NO2vertical profiles can be reversed,including NO2VCD,ωandh.
The idea of retrieving aerosol extinction profiles by parameterized look-up table method is to get different aerosol extinction profiles by setting differentt(aerosol optical depth),ωandh. Combined with the actual observation conditions,different aerosol extinction profiles are brought into the RTM to simulate different O4DAMFs, and a look-up table is established using O4DAMFs under different aerosol conditions.Finally, the actual measured O4DAMF is compared with the simulated O4DAMF in the look-up table. After the minimization,the aerosol parameters(t,ω,h)can be retrieved.The flow chart of retrieving aerosol extinction profile and NO2profile by look-up table method are shown in Fig.3. The minimization process ofχ2is as follows:
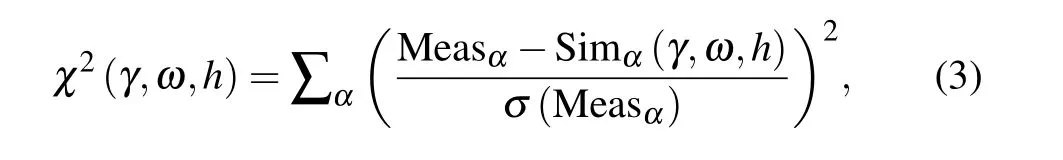
where Measαand Simαare the measured results and model results, respectively. Theσ(Measα)is the standard deviation of measured value. Theγrepresentstand NO2VCD in the different retrieval processes.
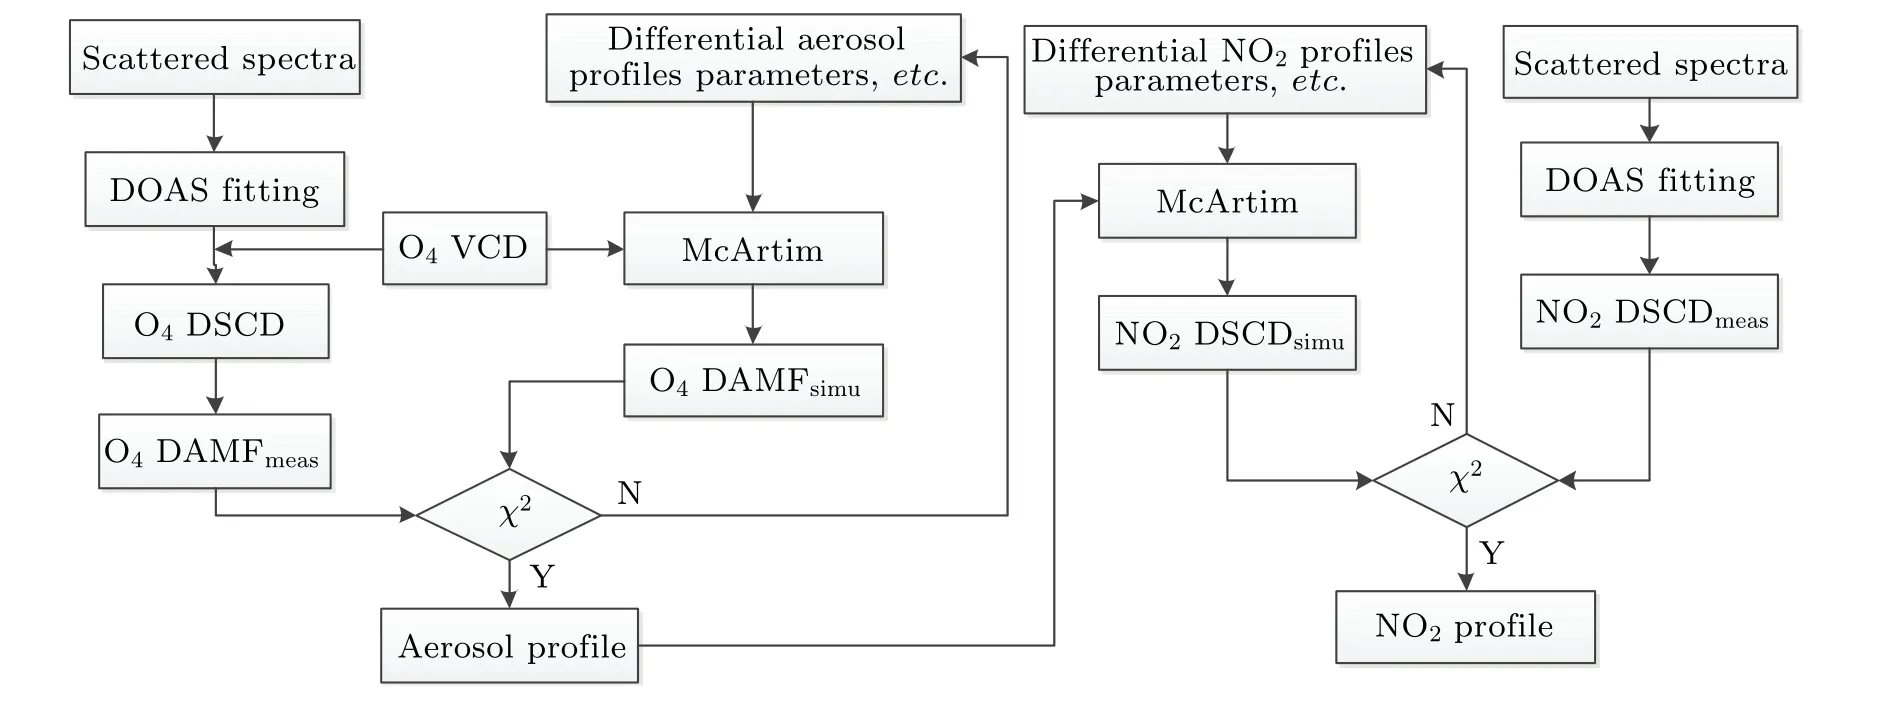
Fig.3. The flow chart of retrieving NO2 profile by look-up table method.
The tropospheric aerosol is complex when it is influenced by the emission of polluted gas, and the light transmission path is strongly affected by the scattering of particles and meters. Only when the aerosol state is accurately known, can the light transmission path in the troposphere be calculated.Therefore,the reconstructed aerosol profiles are input into the atmospheric RTM as the input to further retrieve the trace gas state.
2.3. The parameter setting of radiation transfer model
McArtim[14]model is based on Monte Carlo method and is adopted in this article.When McArtim model is adopted,the parameters such as solar zenith angle(SZA),temperature profile, humidity profile, pressure profile, solar relative azimuth angle (SRAA), trace gas profiles, and aerosol optical characteristics need to be input. Among the input parameters, the temperature, humidity, and pressure are calculated by using the American standard atmospheric profile, and the SZA and SRAA are calculated according to the measurement time and the longitude and latitude of the measurement point. A large number of studies have shown that,[4,5,15]asymmetric factor(AP) and single scattering albedo (SSA) with fixed values of 0.72 and 0.9, respectively, can well retrieve aerosol and trace gas profiles. The specific parameter settings are shown in Table 1.

Table 1. McArtim model parameters settings.
3. NO222 profile retrieval results
3.1. Spectral retrieval
The measured solar spectrum is retrieved with DOAS method,and the NO2DSCDs at different elevation angles are obtained. In the course of wavelength fitting, small wavelength drift or squeezing is allowed to compensate for the error caused by the instability of the spectrometer.[8]The fitting band of O4and NO2is 337 nm-370 nm, and the reference spectrum is set as a fixed reference spectrum. The gas cross sections involved in the fitting are NO2(Vandaeleet al.298 K), O4(Thalmanet al.296 K), O3(Serdyuchenkoet al.223 K) and Ring structure. Figure 4(a) is the fitting diagram of NO2under the 15°elevation measurement spectrum at 14:16 on September 26,2019,from which we can see the NO2dSCDα=15°is 1.47×10¹⁶molec./cm2, and the fitted residual is 1.49×10⁻³, which is mainly originated from unknown structure and system noise. The time series of tropospheric NO2DSCDs in the observation period are obtained by retrieving the measured spectra from September 26, 2019 to September 30, 2019(Fig.4(b)). In order to decreased the error caused by spectral analysis and atmospheric instability,the hourly average of the measurements are measured out at each elevation angle.[8]It can be seen from Fig.4(b)that the NO2concentration is basically high in the morning and evening,but low in the afternoon. In most cases, the high concentration is caused by traffic emissions during rush hours, while the low concentration is mainly concentrated at noon, which may be caused by the photolysis of atmospheric photochemical reaction.[9]
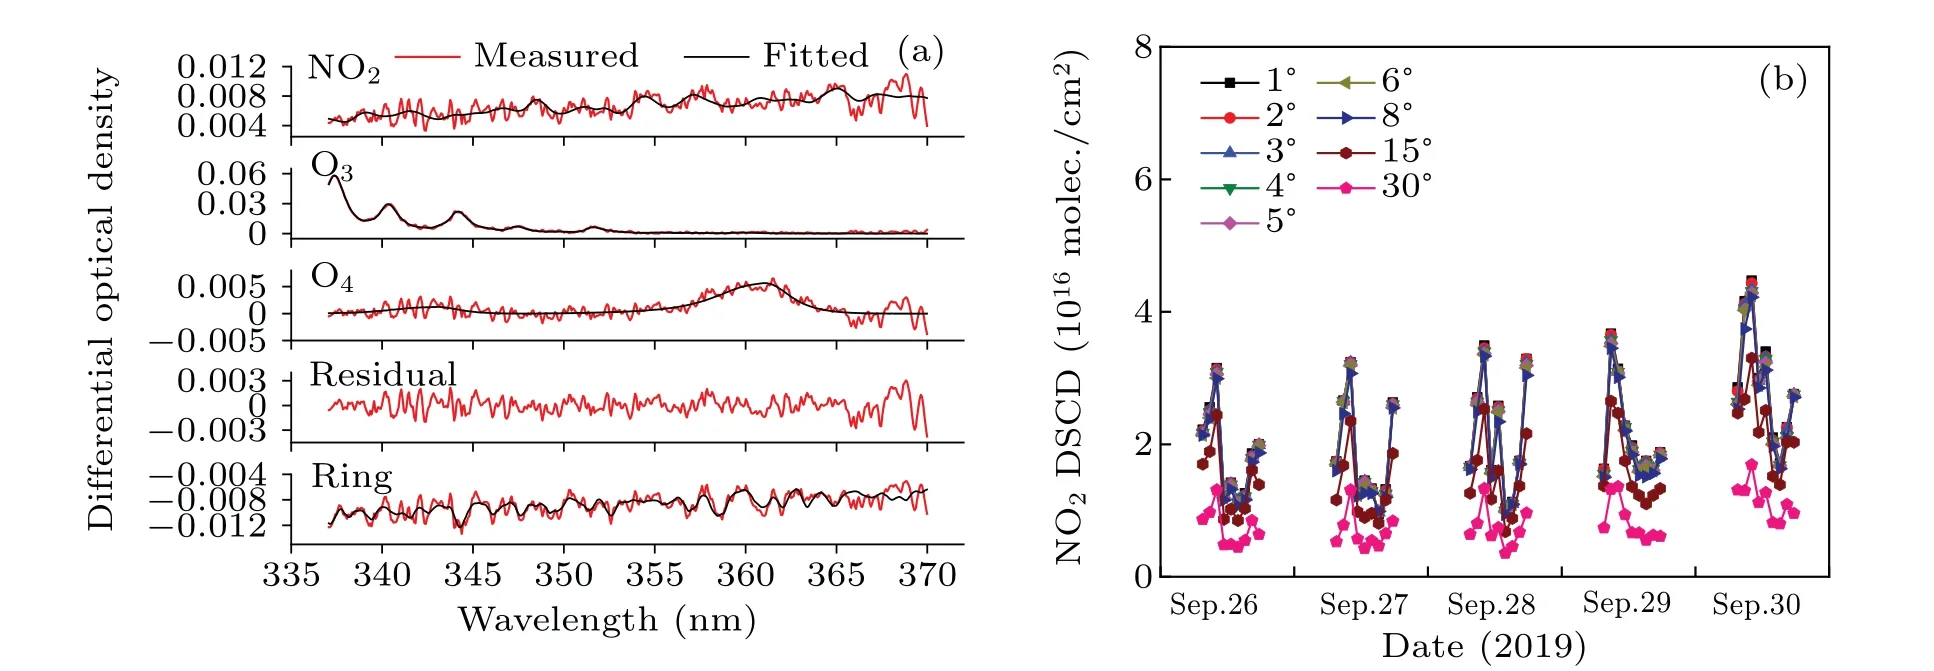
Fig.4. Example of spectral retrieve of 15° elevation measured at 14:16 on September 26,2019(a)and the time series of NO2 differential slant column densities at different elevation angles(b).

Fig. 5. Contrast between the measured and the modeled results of O4 DAMF (a), (c) and NO2 DSCD (b), (d) (September 30, 09:30-10:30,September 28,2019).
3.2. Retrieval results and discussion of NO222 profiles
The parameters settings in Table 1 are input into McArtim model,and the NO2DSCDs simulation values under nine different elevation angles are obtained through model simulation.By minimizing the cost functionχ2between the simulated NO2DSCDs and the measured NO2DSCDs, the NO2profile results that most conform to the real atmospheric state can be obtained. Figures 5(a) and 5(c) show the comparison between the measured and modeled results of O4DAMF,while figures 5(b) and 5(d) show the comparison between the measured and modeled results of NO2DSCDs.It can be seen from the figure that the smaller the difference between the measured and modeled results of O4DAMF,the closer the measured and modeled results of NO2DSCDs. Therefore, the more accurate the aerosol extinction profile in the input model is, the closer the NO2profile is to the real atmospheric state. In order to simultaneously obtain the aerosol profiles results of NO2measurement,the aerosol information is retrieved by using the spectrum in the same measurement cycle.
Figure 6 shows the correlation analysis between simulated and measured NO2DSCDs from September 26, 2019 to September 30,2019. It can be seen from the figure that the simulated NO2DSCDs are very close to the measure at different elevations,indicating the cost functionχ2is sufficiently minimized. There is a good correlation between the measured and simulated below 15°elevation(R2>0.96),the correlation decreases at 15°and 30°elevation (0.9>R2>0.8). Therefore,the low elevation observation results are more sensitive to the profile changes, and the low elevation observation should be added in the next research. In addition,it can be seen from the figure that the slope are between 0.77-1.00, so the simulated NO2DSCDs are slightly higher than the measured on the whole. This may be due to the errors of spectral fitting and model parameters.[7]
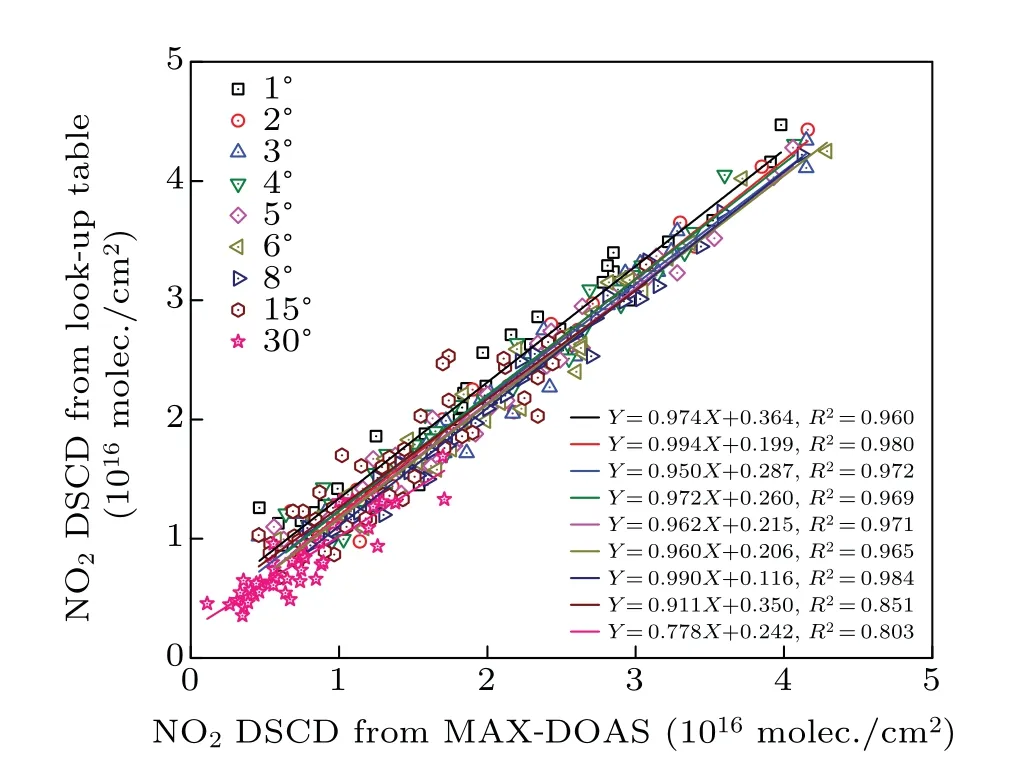
Fig.6. Correlation analysis between simulated and measured values of NO2 DSCDs.
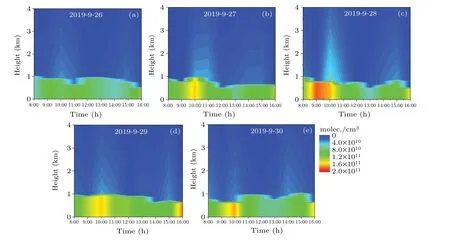
Fig.7. NO2 hourly mean profile and NO2 VCDs hourly mean series from September 26,2019 to September 30,2019(concentration unit: molec./cm3).
The tropospheric of NO2vertical profiles from 08:00-16:00 on September 26, 2019 to September 30, 2019 are retrieved according to the Section 2.2 (Fig. 7). It can be seen from the figure that NO2is mainly concentrated below 1 km,which indicates that during the observation period, NO2is mostly generated by the city’s own emissions, and the low boundary layer height is not conducive to diffusion, resulting in pollution accumulation.[16]The high NO2concentration is easy to appear from 09:00 to 10:00, which is mainly due to the raise of traffic emissions during the rush hour. After 10:00 with the decrease of traffic emission and the enhancement of photochemical reaction,NO2is decomposed in large amount.In the afternoon,photolysis is weakened and NO2concentration begin to increase.
3.3. Comparison with CAMS model data

Fig.8. Comparison of NO2 VCDs time series(a)and correlation(b)between the look-up table method and CAMS model.
The vertical column density is a key parameter in the retrieval of NO2profiles. In order to check the correctness of the NO2vertical profiles obtained by the look-up table method, the NO2VCDs retrieved by the profile are compared with the results of the CAMS model. The data achieved from the CAMS model are at 00:00, 06:00, 12:00, and 18:00 UTC,[17]and the grid resolutions are 0.125°×0.125°,0.25°×0.25°, and 0.5°×0.5°. The average values of NO2VCDs in 07:30-08:30 and 13:30-14:30 from September 26, 2019 to September 30, 2019 are retrieved by the lookup table method and compared with the results of CAMS model at 00:00 UTC (08:00 LT) and 06:00 UTC (14:00 LT). The results of the two methods are consistent from the Fig. 8(a), and their differences are found to be ignored between the different grids. Compared with the results of look-up table method, the CAMS model overestimated NO2VCDs by 0.68×10¹⁵molec./cm2-2.71×1015molec./cm2(0.125°× 0.125°),0.31×1015molec./cm2-2.05×1015molec./cm2(0.25°×0.25°)and 0.19×10¹⁵molec./cm2-3.86×1015molec./cm2(0.5°×0.5°) at 08:00 LT and 14:00 LT,respectively. The correlation coefficient(R2)between the CAMS model and the look-up table method are more than 0.86 (Fig. 8(b)). A comparison of the results show that the CAMS model and the look-up table method results are nearly consistent. In addition, the results show that the look-up table method based on MAX-DOAS can accurately retrieve the NO2profiles, and the error between the model and the measurement results may be brought by the limited number of input NO2profiles.
4. Conclusion and perspectives
In this article, a fast method for retrieving the tropospheric NO2vertical profiles have been established by lookup table method based on MAX-DOAS.Taking the measurement of MAX-DOAS instrument in Huaibei monitoring point as an example, the look-up table is established under nine different elevation angles. By minimizing the cost function,the optimal NO2vertical column densities and NO2vertical profiles are obtained. It is found that NO2is mainly concentrated below 1 km.The high NO2concentration appeared from 09:00 to 10:00 in the morning, and after 10:00 the NO2concentration decomposed in large amount. The look-up table method results are compared with different grid resolutions results in CAMS model. The error of two methods is less than 4.00×10¹⁵molec./cm2and the correlation coefficient is more than 0.86. However, in the application of look-up table method, in the face of complex air pollution, it is necessary to further study the profile shapes of NO2gas, such as further optimization of the profile shapes of NO2gas and further improvement of calculation efficiency.
Acknowledgements
Project supported by the National Natural Science Foundation of China (Grant No. 41875040), the Top-notch Talents Program in Universities of Anhui Province,China(Grant No. gxbjZD2020067), and the Natural Science Research Projects of Universities in Anhui Province, China (Grant No.KJ2020A0029).
We thank the Belgian Institute for Space Aeronomy(BIRA-IASB) in Brussels, Belgium, for the freely accessible WINDOAS software and the European Meteorology Center for providing free medium-range weather forecasts for CAMS real-time products of NO2. We also thank Huaibei Normal University for their support and assistance in the observation and support of essential data.
杂志排行

Chinese Physics B的其它文章
- Superconductivity in octagraphene
- Soliton molecules and asymmetric solitons of the extended Lax equation via velocity resonance
- Theoretical study of(e,2e)triple differential cross sections of pyrimidine and tetrahydrofurfuryl alcohol molecules using multi-center distorted-wave method
- Protection of entanglement between two V-atoms in a multi-cavity coupling system
- Semi-quantum private comparison protocol of size relation with d-dimensional GHZ states
- Probing the magnetization switching with in-plane magnetic anisotropy through field-modified magnetoresistance measurement