Microcrack localization using a collinear Lamb wave frequency-mixing technique in a thin plate
2022-01-23JiShuoWang王积硕CaiBinXu许才彬YouXuanZhao赵友选NingHu胡宁andMingXiDeng邓明晰
Ji-Shuo Wang(王积硕) Cai-Bin Xu(许才彬) You-Xuan Zhao(赵友选)Ning Hu(胡宁) and Ming-Xi Deng(邓明晰)
1College of Aerospace Engineering,Chongqing University,Chongqing,400044,China
2School of Mechanical Engineering,Hebei University of Technology,Tianjin 300401,China
Keywords: frequency-mixing of Lamb waves,contact acoustic nonlinearity,bilinear stress-strain constitutive model,microcrack localization
1. Introduction
Thin plate-like metallic structures are widely used in engineering fields, such as ship building, railway vehicle and aerospace.Failure in these structures under time-varying loads is often attributed to microcracks developed over time through fatigue. Therefore, the detection and localization of microcracks at an early stage of fracture is important to avoid catastrophic failures of engineering components and structures.Lamb waves have been widely used in the field of detecting and characterizing microcracks in thin plate-like metallic structures, since they can travel long distance and detect internal microcracks by interrogating the entire thickness of the said structures.[1,2]
The most common methods of measuring the nonlinearity in solids are those based on the acoustoelastic effect,[3]harmonic generation,[4-13]and wave mixing,[14-17]etc. The acoustoelastic method measures acoustic velocity variations induced by damage to structures. However, the approach is limited by the difficulty of measuring the small changes in acoustic velocity in practice. The most classical phenomenon employed in measuring nonlinearity is harmonic generation technique, where the waveform of an incident wave is distorted by the nonlinear response of the medium to finiteamplitude waves. However, practical implementation of the harmonic generation technique requires much effort to minimize nonlinear distortions in transmitting/receiving devices.This shortcoming poses a severe limitation for its application in engineering practice. The mixing of two primary waves offers a potential to overcome the said shortcoming of the harmonic generation based method,because the frequencies used in the wave mixing measurements can be selected to avoid the harmonics interference generated by the measurement system.
Compared with the conventional classical nonlinear ultrasonic technique, the frequency-mixing technique has been seen as a promising means in nondestructive testing field. It allows greater flexibility in selecting the frequencies, wave modes and propagation directions.[18-20]Up to now, the frequency-mixing technique has been used for interrogating the material nonlinearity,[15,17,21-27]plasticity damage[28,29]or the microcracks.[14,16,30,31]The mechanism between the mixing waves and the material nonlinearity has been widely investigated. Liet al. analyzed theoretically and observed experimentally the frequency-mixing response induced by the collinear interaction of two primary Lamb waves with different frequencies in an isotropic and homogenous plate.[15]However,only third-order combined harmonics were observed experimentally. Further, Liet al. proposed an experimental scheme to measure the second-order combined harmonics predicted theoretically and numerically,through which it was found that the experimental results agreed well with that of the theoretical and numerical predictions.[27]Zhaoet al. investigated frequency deviation under imperfect resonant conditions through FEM simulations and experimental measurement by using the one-way wave mixing technique.[23]Generally, the previous investigations were focusing on the waves mixing induced by the material nonlinearity,in which the resonant condition of mixing of primary waves should be met.
Another classical nonlinearity is the plasticity damage,which can be deemed as the degeneration of the materials.When ultrasonic waves interact with the materials with plasticity damage, the larger amplitude of resonant wave will be induced than that of the inherent nonlinearity of the intact material. Based on this, some researches had detected and localized the plasticity damage by comparing the resonant wave amplitude to that of the undamaged zone. Aslamet al. presented a nonlinear Lamb wave mixing technique for enhanced damage detection in thin plate structures,[28]where the analysis of the nonlinear interaction of primary Lamb wave modes propagating in the opposite direction was performed by using FE simulations and experiments. Yuanet al. reported an investigation for evaluating and locating material plasticity damage in a metallic material by using the collinear mixing wave technique.[29]
Compared with the intrinsic nonlinearity of the intact material,generally,the nonlinearity induced by the microdamage(e.g.,delamination and microcrack)is defined as non-classical nonlinearity as reviewed in reference.[32]In this case,the microdamage can be deemed as the secondary sound source(SSS) radiating wave components with frequencies different from that of primary waves.[33,34]So far, considerable efforts have been made on nondestructive testing of microdamage by using the wave mixing method. Dinget al. proposed a method for locating the microcrack region by calculating the start and end time of time-domain signals of the resonant waves.[16]Jiaoet al. detected the microcrack by using nonlinear Lamb wave mixing in numerical and experimental studies.[14,30]Blanloeuilet al. detected and characterized the closed cracks by using the non-collinear mixing technique.[19]Zhuet al. proposed a nonlinear ultrasonic technique by using the mixed-frequency signals to conduct micro-crack detection in thin plate structures.[31]The above investigations are studied based on the assumption that the resonance conditions of wave mixing need to be satisfied.
In the classical nonlinearity phenomenon induced by material nonlinearity or plasticity damage,the resonant condition of the generation of the high-order or combined harmonics is required. However, in the non-classical nonlinearity phenomenon, the microcrack examined can be deemed as a SSS that radiates the secondary waves with frequencies different from that of primary waves. In this point,the resonant condition is not necessary. In addition,the nonlinearity induced by the microdamage can be orders of magnitude larger than that induced by the plasticity damage in solid.[35]Thus,compared to the nonlinearity induced by the microcrack, the classical nonlinearity of material can be ignored. When two primary Lamb waves simultaneously impinge on a microcrack,the new generated Lamb waves at combined frequency associated with microcrack information can be extracted for detecting and locating itself. However, the frequency-mixing techniques reported are less suited for assessing spatial distribution of damage due to their relatively large mixing zone, as pointed out by Hasanianet al.[36]The shorter pulses are given for a higher spatial resolution to locate and size the damage zone with a loss of the signal to noise ratio(SNR),while the longer pulses are needed for a higher SNR to quantify the degree of damage with a loss of the spatial resolution. Even though shorter pulses are given,the damage location is approximately localized in a wide range,[16,17,29,37]which relies mainly on the spatial accumulation critically.
Unlike the nonlinear wave propagation/interaction approach outlined above,a novel frequency-mixing technique of Lamb waves is proposed to accurately detect and locate the microcrack examined just by using the time-domain response of combined harmonics generated.It is worth mentioning that the proposed method is free from the resonant condition of mixing of primary Lamb waves.Once the total time of flight of the generated A0 mode at difference frequency is determined,the microcrack can be detected and localized. This paper is structured as follows: Section 2 presents the theoretical fundamentals of the nonlinear interaction between two primary Lamb waves and the microcrack modeled by the bilinear stress-strain model,and the method for detecting and locating the microcracks. In Section 3, a finite element (FE) model is built. In Section 4, the simulation results are presented and discussed.Finally,conclusions are drawn in Section 5.
2. Theoretical fundamentals
2.1. The bilinear stress-strain model
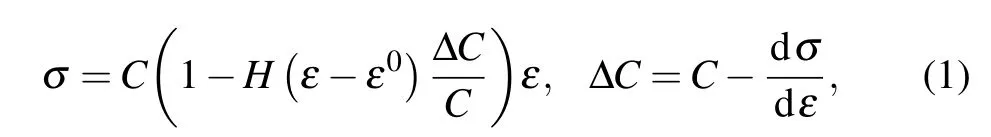
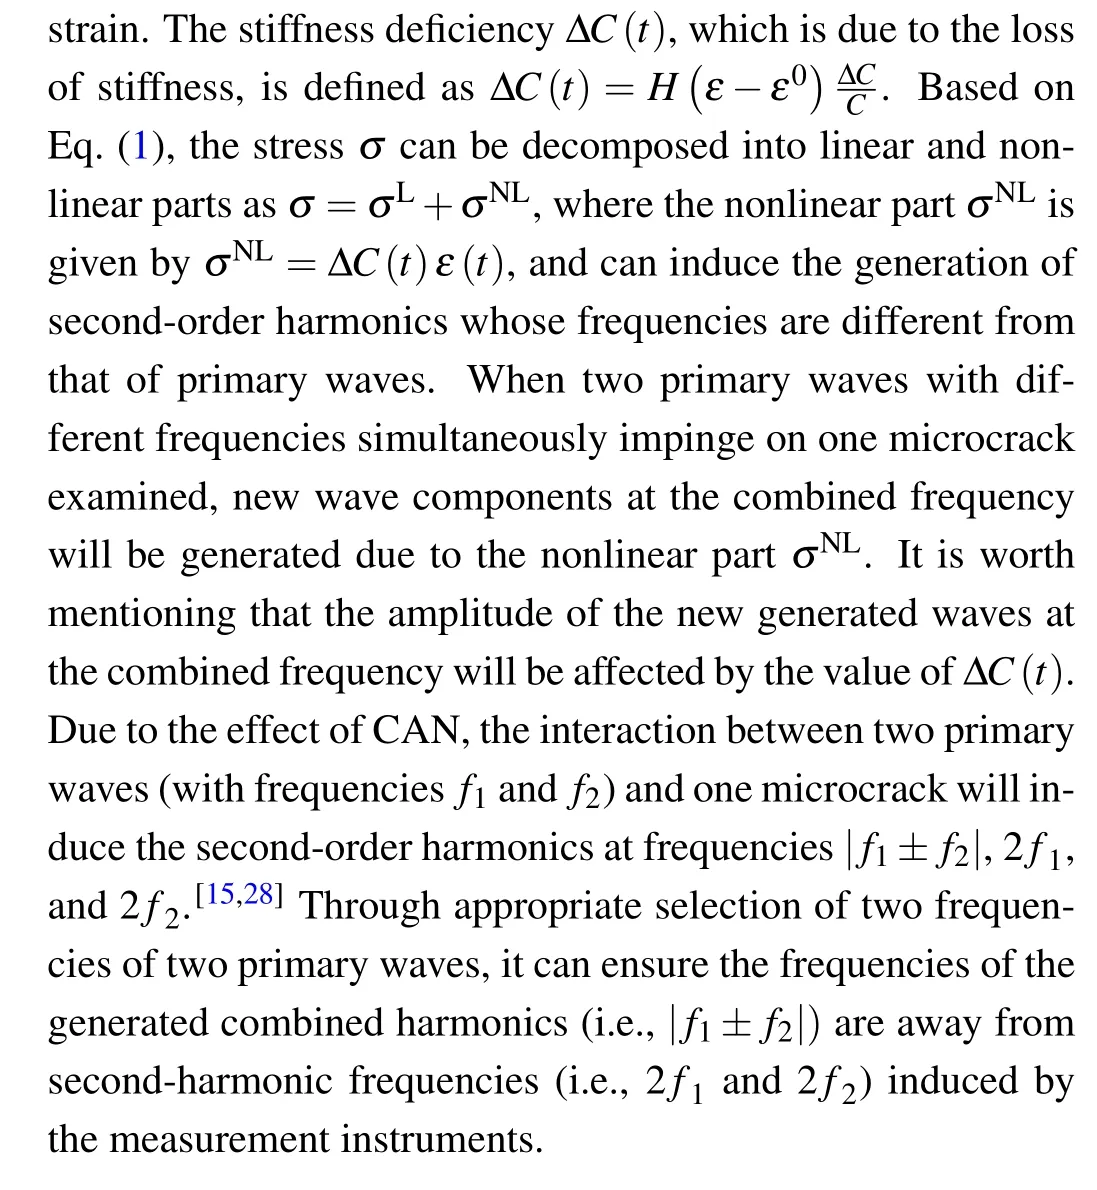
To characterize the features of the microcrack,an appropriate theoretical model describing the nonlinear interaction between primary waves and microcrack examined is needed.Due to the fact that the model of contact acoustic nonlinearity(CAN) is relatively intuitive, it has been widely used in analyzing the nonlinear interaction between primary waves and microcracks.[33]In the tensile phase of primary wave impinging on the microcrack, the microcrack is open and the local stiffness is reduced,while the local stiffness is the same as that of the intact material in the compressive phase. The bilinear stress-strain constitutive law of CAN is given by[33]

2.2. Interaction between two Lamb waves and one microcrack
Nonlinear Lamb wave frequency-mixing technique has been used for detecting and locating examined microcracks.[16,29]The nonlinear interaction between two primary Lamb waves and one microcrack examined can be depicted as following procedure. Generally, the duration of the wave-packet or the length of wave-train of the primary Lamb wave is finite. Thus, two primary Lamb waves will be mixing at a specific region through appropriately adjusting the time of their excitation sources.To avoid the generation of primary high-order Lamb wave modes(e.g.,A1,S1,A2,and S2,etc.) and meeting the resonant condition of two primary Lamb wave,a pair of primary A0 and S0 modes at lower frequency range are selected. As illustrated schematically in Fig.1,two dynamic displacements respectively applied to the left end of the model in the direction ofX- andY-axes can generate primary S0 and A0 modes, propagating toward the positiveX-axis direction. In this paper, it is required that the examined microcrack is always in the acoustic field of primary A0 mode, at least until primary S0 mode passes through it completely. During the wave mixing of primary A0 and S0 modes,the examined microcrack works as a SSS due to the effect of CAN.The said SSS will radiate the new generated symmetric and antisymmetric Lamb waves at the combined frequencies(combined harmonics), which propagate along the same and opposite directions of primary A0 and S0 modes.In this point,the resonant condition of wave mixing of primary modes is no longer required. For the case of several microcracks, when two primary Lamb waves (A0 and S0) simultaneously impinge on the first microcrack examined,under the modulation of CAN, it will radiate the combined harmonics for the first time. The same processes repeat to the second, third, and fourth microcracks, which will successively radiate the corresponding combined harmonics. For convenience, only the generated combined harmonics propagate along the opposite direction of primary Lamb waves are considered in this paper.

Fig.1. A two-dimensional model of wave mixing between two primary Lamb waves and one microcrack.
2.3. Method for locating microcrack
The proposed frequency-mixing technique for detecting and localizing a microcrack is based on the time-domain signals acquired from a single sensing point,which can be located at the left end of the plate.When primary A0 and S0 modes simultaneously impinge on the microcrack examined,the combined harmonics associated with the information of the examined microcrack will be generated. Here, it should be mentioned that the examined microcrack is always in the acoustic field of primary A0 mode until primary S0 mode passes through it completely. It should be noted that the combined harmonic (A0) at difference frequency is only considered in this paper. This is due to the fact that the energy of the generated A0 mode at difference frequency is dominant,which will be numerically demonstrated in Subsection 4.2.The generated A0 mode at difference frequency, propagating along the negativeX-axis direction,is used to locate the microcrack examined. Under the given parameters(including cycle,frequency,and time delay of excitation sources of primary A0 and S0 modes),once the total time of flight of the generated A0 mode at difference frequency is determined, the following analysis indicates that the microcrack examined can be accurately localized.
The total time of flight of the generated A0 mode, propagating along the negativeX-axis direction and received at a given sensing point,consists of two parts: (i)the time of flight of primary S0 mode from the excitation source position to the microcrack location(denoted bytS0),and(ii)the time of flight of the generated A0 mode from the microcrack location to the sensing point (denoted bytdiff). Therefore, the total time of flight,T,of the generated A0 mode can be expressed as

Thus, the microcrack location can be localized via a single sensing point in a thin plate,as expressed in Eq.(3). Since the time-domain displacement signal of the generated A0 mode[denoted byu(t)]can be mapped into the corresponding spatial domain signalu(x),its amplitude can be directly obtained in the spatial domain. In addition, the microcrack length can be ignorable when compared with the distance between the microcrack and the sensing point. Thus, the microcrack can be deemed as a point-like source radiating the A0 mode at difference frequency, and its position can be represented by its coordinatex. The position of the maximum magnitude ofu(x)in the spatial domain corresponds to the highest probability of the microcrack location. Further, a normalized amplitude index(NAI)is taken as an indicator of how the maximum magnitude ofu(x) intuitively visualizes the microcrack location.The magnitude value of the NAI represents the probability of the existence of the microcrack. Bigger the NAI is, the more probability the microcrack exists. The NAI is mathematically defined as

where max(u(x))is the maximum magnitude of the generated A0 mode at difference frequency. It is worth mentioning that several microcracks can be localized by judging the peak number in the spatial domain.
3. FE simulation
3.1. FE model
It is known that Lamb waves have dispersive and multimodal characteristics, which are associated with the product of frequency and plate thickness. Without the loss of generality, the 2.0 mm thick aluminum plate is chosen, and the dispersion curves of Lamb waves are calculated and shown in Fig. 2. It can be seen that the higher frequency, the more modes the Lamb waves have.Therefore,the A0 and S0 modes at lower frequency range are selected as the two primary waves for waves mixing interaction between the two primary waves and the microcrack. The new generated Lamb waves at difference frequency are selected to avoid the generation of the higher-order modes.

Fig. 2. Dispersion curves of Lamb waves in a 2-mm-thick aluminum plate: (a)phase and(b)group velocities.
As schematically illustrated in Fig.1,a two-dimensional model is built for investigating the frequency-mixing response of primary Lamb waves(A0 and S0)with the microcrack examined, where the solid plate is assumed to be an aluminum plate with a uniform thickness of 2.0 mm and a length of 2000 mm. The material parameters of the aluminum are listed in Table 1.
The origin of the coordinate system is located at the left center of the aluminum plate. A microcrack with a length of 2 mm in the vertical direction is positioned at a given location in the aluminum plate(see Fig.1). The dynamic displacement excitations

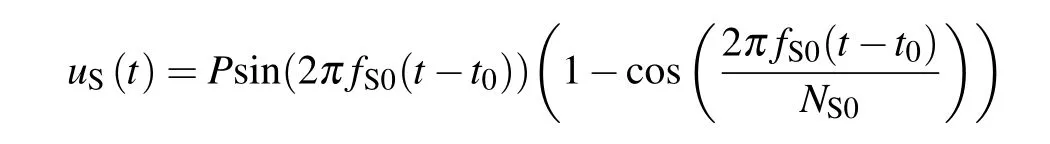
are,respectively,applied to the left end of the model along the directions of theYandXaxes,wheret0is the delay time;andfA0,fS0andNA0,NS0are,respectively,the carrier frequencies and cycle numbers ofuA(t) anduS(t). The excited dynamic displacementsuA(t)anduS(t),respectively,contain 30-cycle Hanning windowed tone burst signals with central frequencies of 0.5 MHz and 10-cycle Hanning windowed tone burst signals with central frequencies of 0.8 MHz. The amplitudePof two dynamic displacements is the same and its value is set to be 1.0×10⁻⁴mm. The time-domain signals ofuA(t) anduS(t),as well as their amplitude-frequency curvesuA(f)anduS(f),are shown in Fig.3.

Fig.3. Time-domain signals of uA(t)and uS(t)(a)and their amplitudefrequency curves(b).
A 2D FE model is constructed by using the four-node plane strain (CPE4R) elements in software ABAQUS (Version 6.14, Dassault Syst´emes Simulia Corp., Providence,RI, USA), where a VUMAT subroutine defining the bilinear stress-strain constitutive relation is implemented to update the stress tensor at every time step. Two-layer meshes are introduced to simulate the existence of the microcrack examined.The model is similar to the one reported in the authors’previous work,[34]with differences in terms of geometry and driving frequencies of primary waves.
Spatial discretization is essential in the FE simulation.The appropriate grid cell edges length (Le) and the integration time step (Δt) are adopted, which are based on the minimum wavelength (λmin) and the maximum frequency (fmax)of the Lamb wave desired. The maximum acceptable element size and time step are calculated according to the following equations:[38]

For the dynamic displacementuS(t)with the central frequency of 0.8 MHz,the maximum element is 0.27 mm and the smallest time step is 6.25×10⁻⁸s based on Eq.(5). To ensure the computational efficiency and accuracy of the FE simulation,the grid cell edge length is selected as 0.2 mm. At the same time,a time step of 1.0×10⁻⁸s is chosen.
3.2. Signal processing
When two primary Lamb waves (A0 and S0) simultaneously impinge on the microcrack examined, the new generated Lamb wave (A0) at difference frequency will carry the information of the microcrack location. Thus, extraction of the new generated A0 mode at difference frequency can be used for microcrack localization. Because of the multi-mode nature of Lamb wave propagation, an accurate determination of the difference frequency component(A0)generated from a time-domain signal containing multi-modes is difficult.
To solve the problem, the pulse inversion technique[7,39]and the bandpass filter processing[40]are adopted for extracting the new generated A0 mode at difference frequency,as illustrated schematically in Figs.4(a)-4(d). For the pulse inversion technique, as shown in Fig.4(b),it has been mathematically proved that when two time-domain signals excited by the pulse inversion technique propagate in a nonlinear medium,by summing the two time-domain signals, all of the odd-order harmonic components and the fundamental component will be canceled out while all the even-order harmonic components will be reserved.[39]Because the time-domain signals obtained still contains several frequency components after processing by the pulse inversion technique,as shown in Fig.4(c),the bandpass filter processing is applied to extract the desired time-domain signals at the specific frequency, as shown in Fig. 4(d). In this paper, the time-domain signal of the generated A0 mode at difference frequency is extracted and used for detecting and locating microcracks hereinafter.
The steps of the microcrack localization are illustrated in Fig.5.
Step 1 Two primary Lamb waves of the A0 mode at 0.5 MHz and the S0 mode at 0.8 MHz are excited on the same side of the plate, and the S0 mode is excited with a specific delay time to ensure that both primary modes simultaneously impinge on the examined microcracks,as shown in Fig.1.
Step 2 Extract the signals of the generated A0 mode at difference frequency based on pulse inversion technique and filter processing.
Step 3 Obtain the time of flight of the A0 mode at difference frequency generated by the interaction between the two primary Lamb waves and the examined microcracks.
Step 4 Locate the examined microcracks based on Eq.(3), and draw the NAI curve based on Eq.(4), and then intuitively visualize the position and the number of the examined microcracks.
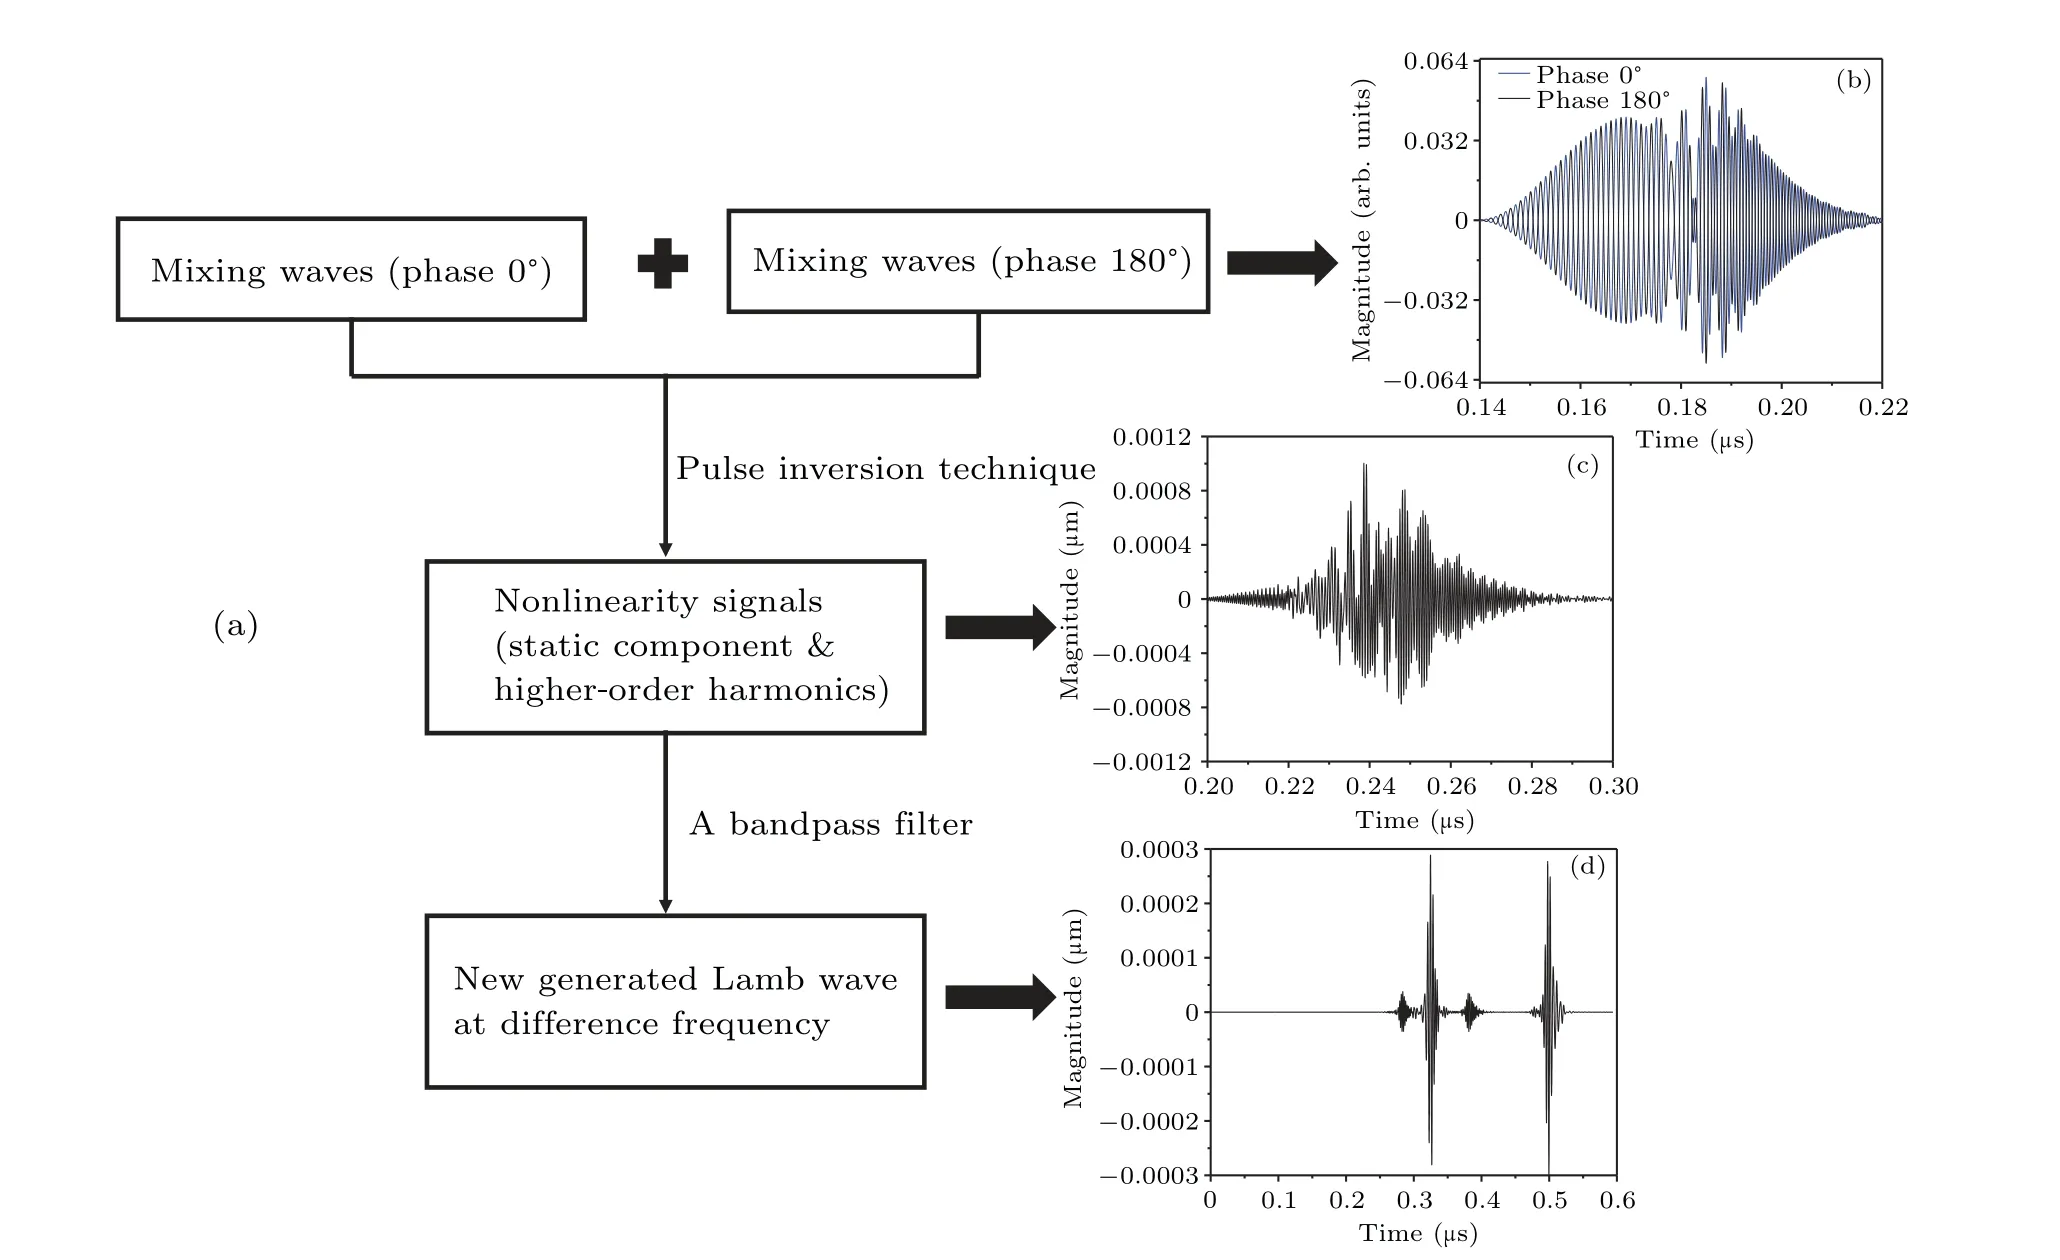
Fig.4. Flow chart of the extraction procedure of the generated Lamb waves at difference frequency(A0 mode): (a)flow chart,(b)two primary Lamb waves of different phases(0° and 180°),(c)nonlinearity signals containing static component and higher-order harmonics,and(d)new generated Lamb wave(A0)at difference frequency.

Fig.5. Layout of the microcrack localization using FE simulation.
4. Simulation results and discussion
4.1. Verification of the generated Lamb waves at difference frequency
To verify the modes of the new generated Lamb waves at difference frequency,the group velocity of each single wave packet is calculated. As shown in Fig.6, we assume that the microcrackm0is located atx=500 mm. The pulse inversion technique and the bandpass filter processing are adopted to extract the new generated Lamb waves induced by the interaction between the primary waves(A0 and S0)and the microcrack examined.Hereby,such a microcrack works as a SSS radiating the new generated Lamb waves due to the effect of CAN.
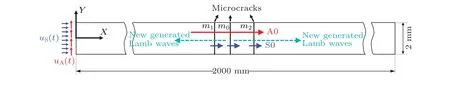
Fig.6. A two-dimensional model for analyzing the interaction between the two primary waves(A0 and S0)and the microcracks.

Fig. 7. Verification of the new generated Lamb wave modes at difference frequency.
As shown in Fig. 7, the time-domain signals of the horizontal displacementsU1of two arbitrary sensing points located at positionsxr1=101.8 mm andxr2=301.8 mm are selected to calculate the group velocity. For the sake of simplicity, we take the new generated Lamb waves at difference frequency(A0)as an example,and the group velocity of each wave packet can be obtained by
wheret1andt2are the time of flight of each wave packet receiving at the sensing pointsxr1andxr2, respectively. As shown in Fig. 7, the group velocity of the new generated A0 mode at difference frequency (0.3 MHz) is equal to 2919.7 m/s, which is in good agreement with the theoretical value 3005 m/s (see Fig. 2(b)). Similarly, the mode of the other wave packets can be confirmed in the same way. It is ascertained that the A0 and S0 modes at the difference frequency in Fig.7 are the modes radiated by the microcrackm0,while the A0′and S0′modes are the reflection signals of the said A0 and S0 modes reflected from the left end of the plate,respectively.Hereinafter,without special instructions,the new generated A0 mode at difference frequency is selected to locate the microcrack location since its energy is dominant.
4.2. Localization of one microcrack
Once the new generated A0 mode at difference frequency is confirmed,its group velocity is also known,through which the microcrack can be localized as described in Subsection 2.3.As shown in Fig.6,one microcrackm0located at the positionx=500 mm is introduced in FE simulation model. A sensing point located atxr=351.8 mm is picked up to locate the given microcrack. Similar to Fig.7,the time-domain signal of each mode generated by the SSS(i.e.,the microcrack itself)at difference frequency of 0.3 MHz can be confirmed as shown in Fig. 8(a). Figure 8(b) shows the corresponding NAI curve that represents the probability of the microcrack appearance.Through the peak of the NAI curve, it is shown that the microcrackm0is located atx=502.5 mm. Compared with the theoretical value of the microcrackm0located atx=500 mm,the localization error is 2.5 mm. It is demonstrated that the proposed frequency-mixing method is capable to locate the microcrack accurately.
Due to the dispersive nature of Lamb wave propagation,the smaller cycle number of Lamb wave tone burst, the more severe dispersion it has. Here,the influence of the cycle number of primary Lamb wave on the microcrack localization is investigated. For the proposed method, the microcrack is always in the acoustic field of primary A0 mode, at least until primary S0 mode passes through it completely. For simplicity,the cycle number of the tone burst of primary A0 mode can be regarded to be infinite. So interest focuses on analyzing the influence of the cycle number of primary S0 mode on the microcrack localization. Once the frequencies of two primary Lamb waves are given,the cycle number of the generated A0 mode at difference frequency is largely determined by the cycle number of the primary S0 mode.

Fig.8. (a)The time-domain signal of the new generated Lamb waves at difference frequency probed at the point (xr =351.8 mm), and (b) the NAI curve versus x for microcrack localization.
When the cycle number of the primary S0 mode are, respectively, set to be 5, 10 and 15, the corresponding NAI curves are shown in Fig. 9. Clearly, the accuracy of the microcrack localization under the condition of 10 and 15 cycles are almost same,while the localization error under the condition of 5 cycles is larger than the former. The reason is mainly due to the fact that the case of smaller cycle number corresponds to more severe wave packet dispersion of Lamb wave propagation. The FE simulation results show that under the condition of the primary S0 mode with more than 10 cycles,the microcrack localization is less influenced by the dispersion nature of Lamb waves.

Fig. 9. Microcrack localization by changing the cycle number of the primary S0 mode.
4.3. Localization of two microcracks
As described above in Subsection 2.3, by counting the peak number of the NAI curve versusx, the proposed frequency-mixing technique has a potential to locate one or more microcracks. As shown in Fig. 6, the given two microcracksm1andm2(respectively located atx=475 mm andx=550 mm) are introduced in the FE simulation model. A sensing point locating atxr=197.8 mm is picked up for locating the two microcracks. In order to decrease the influence of the dispersion on localization accuracy(see Fig.9), the cycle number of the primary S0 mode is set to be 10. The signal of each mode generated at difference frequency can be confirmed as shown in Fig.10(a),where the S0 and A0 modes are the modes radiating by two given microcracks (two SSSs) at difference frequency,while the two A0′modes are the reflection signals of the two A0 modes by the left end of the plate.Noteworthily, the reflection signals of the two S0 modes by the left end of the plate are mixed with the two A0 modes.

Fig.10. (a)The time-domain signal of the new generated Lamb waves at difference frequency probed at the point(xr=197.8 mm),and(b)the NAI curve versus x for microcrack localization.
Figure 10(b)shows the curve of the NAI representing the probability of the microcrack appearance. The FE simulation results show that the two peaks are located atx′1=480.5 mm andx′2=557.5 mm,which correspond to the positions of the two microcracksm1andm2,respectively. The localization errors of the two microcracks are 5.5 mm and 7.5 mm, respectively.The localization errors of the two microcracks are larger than that of the single one case.The reason is probably the fact that the reflection signals of the two S0 modes by the left end of the plate is mixed with the generated A0 mode,which leads to the peak shifting from the real position. Similarly, more microcracks can be localized in the same process. It demonstrates that the proposed frequency-mixing Lamb wave technique is a potential means for microcrack localization in nondestructive testing field,which is also capable to locate multiple microcracks.
Generally, the traditional frequency-mixing techniques reported are less suited for assessing spatial distribution of microcracks due to their relatively large mixing region. The shorter pulses are given for a higher spatial resolution to locate the microcrack,while the longer pulses are given to quantify the degree of damage with a loss of the spatial resolution.Even though shorter pulses are given,the microcrack location is approximately localized in a wide range. Unlike the traditional nonlinearity wave propagation/interaction approach that relies mainly on the spatial accumulation critically, the proposed frequency-mixing technique of Lamb waves is capable to detect and locate the microcracks examined just by using the time-domain response of the generated difference frequency component(i.e.,the A0 mode at difference frequency). Based on the above FE simulations,it is found that one or more microcracks’position can be localized accurately. The most obvious advantages of the present technique are that only onetime excitation of two primary Lamb waves(A0 and S0)that mix at the microcracks examined is required, and that only one-time sensing is needed for extracting the difference frequency signals that have the information of microcrack locations.
However, it should be pointed out that there is a limitation of the proposed frequency-mixing Lamb wave technique.The spatial separation between any two distinguishable microcracks should be larger than that of half wave-package width of the generated A0 mode at difference frequency. Thus, the selection of the wave-package width of the primary S0 mode is not too long for a better spatial resolution. However, the shorter wave-packet width will result in a loss of accuracy of microcrack localization(see Fig.9). Therefore,the appropriate selection of the wave-packet width of primary S0 mode is necessary.
5. Conclusions
A new nonlinear Lamb wave frequency-mixing technique is proposed. It is capable to accurately locate one or more microcracks by using one-time sensing of the generated Lamb wave at difference frequency. Based on the bilinear stressstrain constitutive model,a two-dimensional FE model is built,which is used for investigating the frequency-mixing response induced by the interaction between the two primary Lamb waves (A0 and S0) and the examined microcrack. One basic requirement is that the examined microcrack is always in the acoustic field of the primary A0 mode, at least until the primary S0 mode passes through it completely. A new defined indictor NAI is used to intuitively visualize the numbers and locations of the microcracks. The FE simulation results show that the proposed frequency-mixing technique is capable to accurately locate one or more microcracks. For the given frequencies of two primary Lamb waves (A0 and S0), the cycle number of the primary S0 mode tone burst has some effect on the accuracy of the microcrack localization. Unlike the traditional frequency-mixing technique, the proposed technique shows the advantages that only one-time excitation of two primary Lamb waves(A0 and S0)that mix at the microcracks examined is required, and that only one-time sensing is needed for extracting the difference frequency signals that include the information of the microcrack locations. These obvious advantages can largely promote the efficiency of microcrack localization.
Acknowledgements
Project supported by the National Natural Science Foundation of China(Grant Nos.12074050,52005058,11834008,and 11632004), the China Postdoctoral Science Foundation(Grant No. 2020M673119), and the Fund for Innovative Research Groups of Natural Science Foundation of Hebei Province,China(Grant No.A2020202002).
杂志排行

Chinese Physics B的其它文章
- Superconductivity in octagraphene
- Soliton molecules and asymmetric solitons of the extended Lax equation via velocity resonance
- Theoretical study of(e,2e)triple differential cross sections of pyrimidine and tetrahydrofurfuryl alcohol molecules using multi-center distorted-wave method
- Protection of entanglement between two V-atoms in a multi-cavity coupling system
- Semi-quantum private comparison protocol of size relation with d-dimensional GHZ states
- Probing the magnetization switching with in-plane magnetic anisotropy through field-modified magnetoresistance measurement