Information flow between stock markets:A Koopman decomposition approach
2022-01-23SembaShereheHuiyunWan万慧云
Semba Sherehe Huiyun Wan(万慧云)
Changgui Gu(顾长贵)1, and Huijie Yang(杨会杰)1,†
1Department of Systems Science,University of Shanghai for Science and Technology,Shanghai 200093,China
2Faculty of Science,Dar es Salaam University College of Education,University of Dar es Salaam,Dar es Salaam,Tanzania
Keywords: transfer entropy,Koopman operator,stock markets
1. Introduction
The stock markets distributed over the world are networked by complicated and dynamical relationships into a global system. The relations are integration results of the natural disasters,the social/political/armed conflicts,and the flow of capitals. The environmental factors cover a wide time scale from several days,such as the Suez Canal Blockage[1]to several months or even more than one year, such as the novel COVID-19 pandemic.[2-5]And the flow of capitals also has a rich pattern composing of the strategic, tactical, and speculative investments from different institutions. The stock market network attracts persistent attentions of researchers from diverse fields for its potential use in theory and practice.
The relationships between stock markets are currently detected through the cross-correlation,[6,7]the causality inference,[8]and the information flow.[9]For instance, to detect the influence stored in cross-correlations, the concept of time delay stability is designed.[10-14]The influence is realized by a successive physical process of sending signals from the influencer, receiving signals by the influenced one and its responses. The signals may be different completely,but the delay time from the sending to the response is determined by the intrinsic properties of the systems and keeps unchanged. One calculates the cross-correlation coefficients between the output series for different delays and finds the specific delay at which the absolute value of the cross-correlation coefficient reaches the maximum, called time delay for the cross-correlation.[15]The value of the cross-correlation and the time delay stability are used cooperatively to identify the influence. The Granger causality[16]of one market,for another example,implies that the history of the causal market has a significant ability to explain the present state of the explained market,which is evaluated by regressions of the structural equations.[17,18]
The couplings between the stock markets induce to and can be represented subsequently with information flows,measured by various entropy quantifiers.[19-26]The present state of one market depends strongly on its history. Using a specified number of historical records as a condition, one can obtain the conditional probabilities and the conditional entropy.[27]Adding the historical recordings for another stock market to the condition,the conditional entropy will become smaller due to the newly introduced information. The decreasing quantity is called transfer entropy.[28]A higher value of transfer entropy implies that the added stock market has a significant explanation ability.[28-31]
The index records for the stock markets form a multivariate time series. One separates the time series into segments with a specified length (e.g., one year) and reconstructs their corresponding stock market networks,all of which will form a temporal network.[31]The structural and evolutionary behaviors are then displayed using the curves of structural properties for the snapshot networks versus time. Fruitful findings have been reported in recent years.[32-34]For instance, the mutual entropy between successive networks for a total of 57 industry portfolios in the American stock market reaches peaks at financial crises.[17]According to the signs of components for the eigenvectors corresponding to several largest eigenvalues of stock networks, one can separate the stocks into reasonable groups consistent with that in reality.[35]And the average transfer entropy for the market network reaches peaks several months before each financial crisis.[31]But the evolutionary mechanism underlying the temporal network is still not in order.
Recent years have witnessed a rapid development of dynamic mode decomposition (DMD).[36-40]It is built on the idea of Koopman operator approximation,i.e.,though the evolutionary process of a system is generally nonlinear, in each time step it can be mimicked by a linear one, and in a short time duration the system obeys the same law. Many works have shown its powerfulness in discovering the underlying mechanism from experimental records.It is widely used in the identification and monitoring of mobile objects,displaying the complicated dynamical patterns in turbulent fluids,diagnostics and predictions.[41]
The present work proposes a scheme that reveals underlying dynamical law stored in the information flows between stock markets. First,we collect the monthly closing price series for many stock markets and calculate the corresponding volatility series. The volatility series are separated into segments with a specified length each. For each segment, we calculate the transfer entropies between all the markets,forming a weighted-directional information flow network used to represent the local state of the system in the corresponding time duration. The successive weighted-directional information flow networks make the dynamical process of information flow. Then the Koopman operator is adopted to model this dynamical process with eigenfunctions. The model gives the dynamical law for the entropy flow in the global stock market system. The generated dynamic model displays rich evolution patterns,e.g.,the non-normal energy growth indicating the stock market system jumps easily between different states(called flexibility of stock market system). Also,the information flows mainly from high volatility stock markets to low volatility stock markets.
The materials and methodologies are introduced in detail in Section 2. In Section 3 we present the numerical experiments and observations. Summaries and conclusions are provided in Section 4.
2. Materials and methodologies
Figure 1 illustrates the methodology framework.
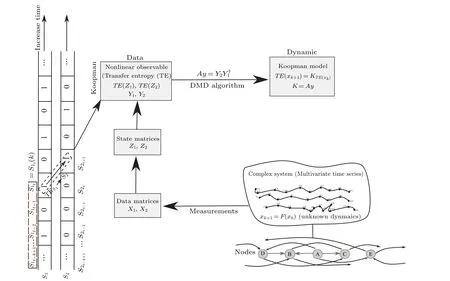
Fig.1. The methodology framework:The framework shows how the complex systems with the unknown governing equation and nonlinear produce the multivariate time series data, used to generate the dynamical information model by deploying transfer entropy integrated Koopman mode decomposition.
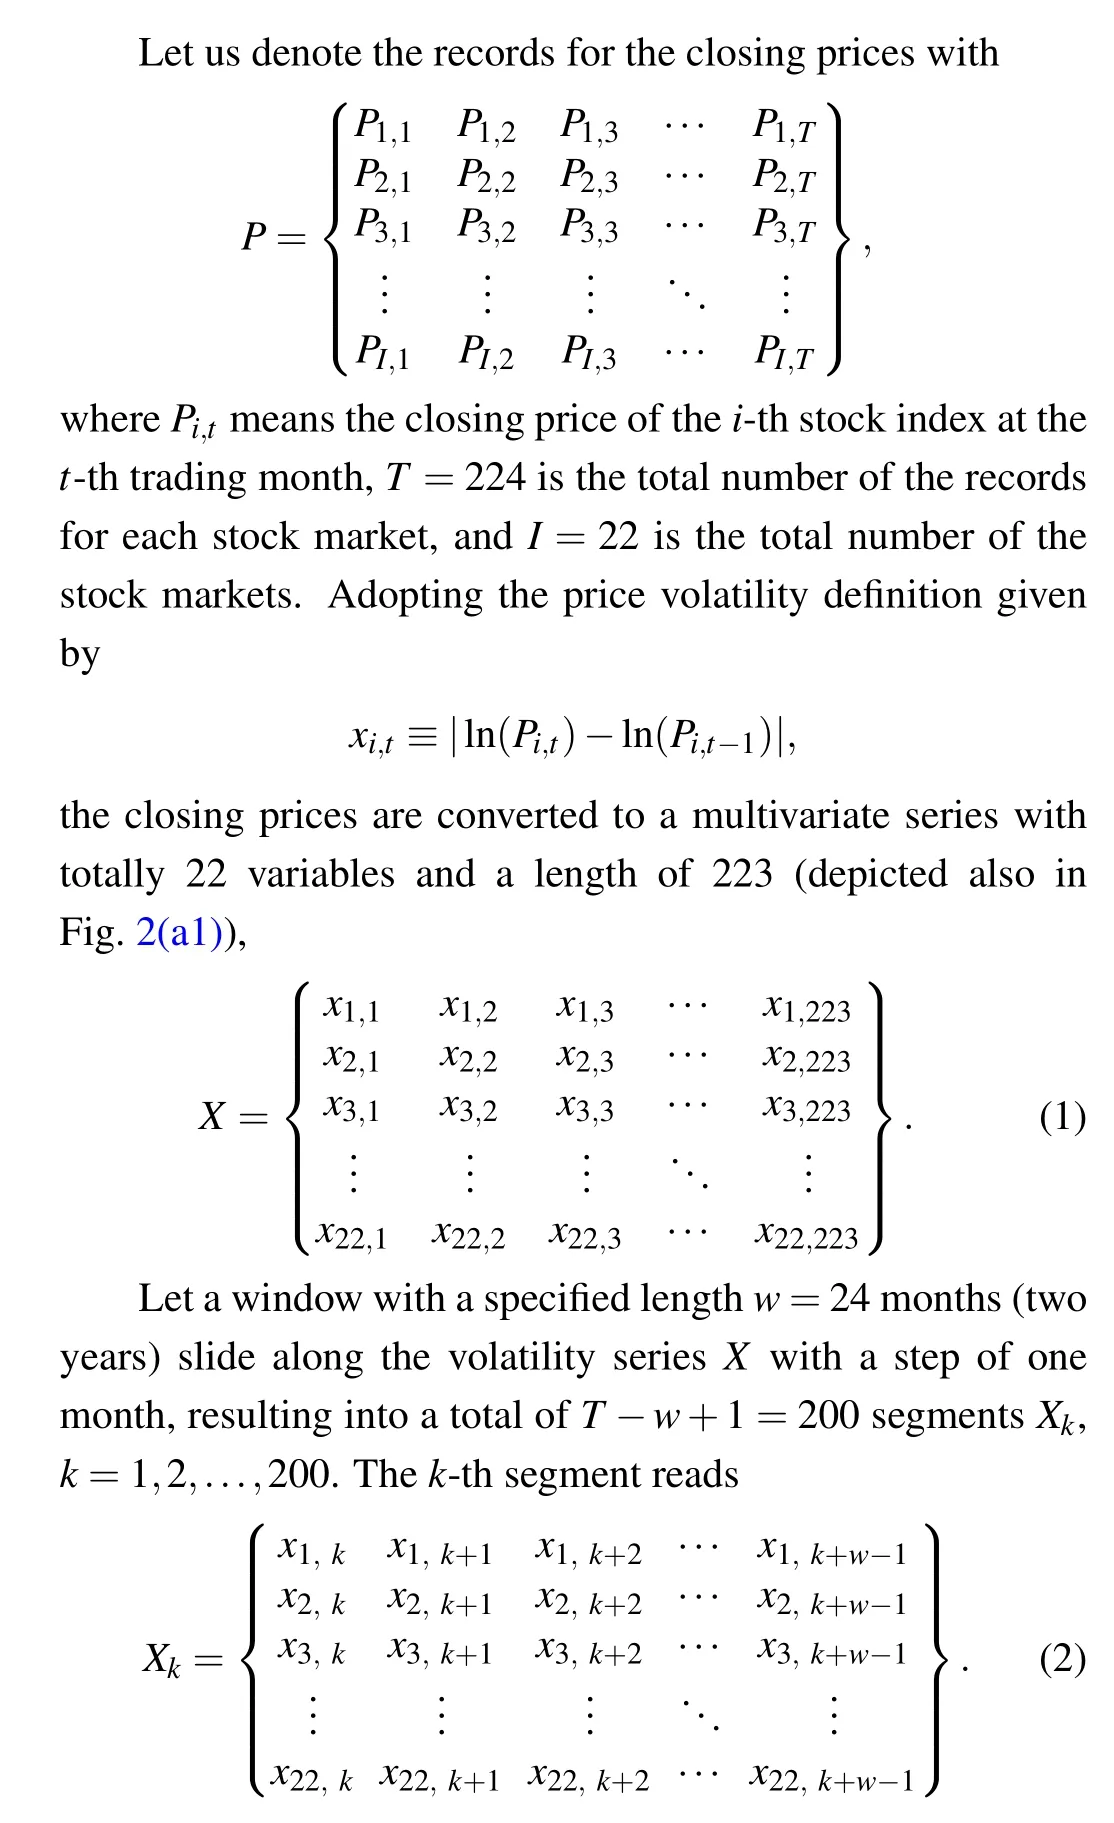
2.1. Data
We collected the monthly closing prices for a total of 22 stock markets from June 1, 2002, to January 1, 2021. The stock markets distribute over five continents including, South America,North America,Asia,Europe,Australia,and Africa,as listed in Table 1. From each continent, we have chosen at least one market. The data can be downloaded freely from the website finance.yahoo.com.
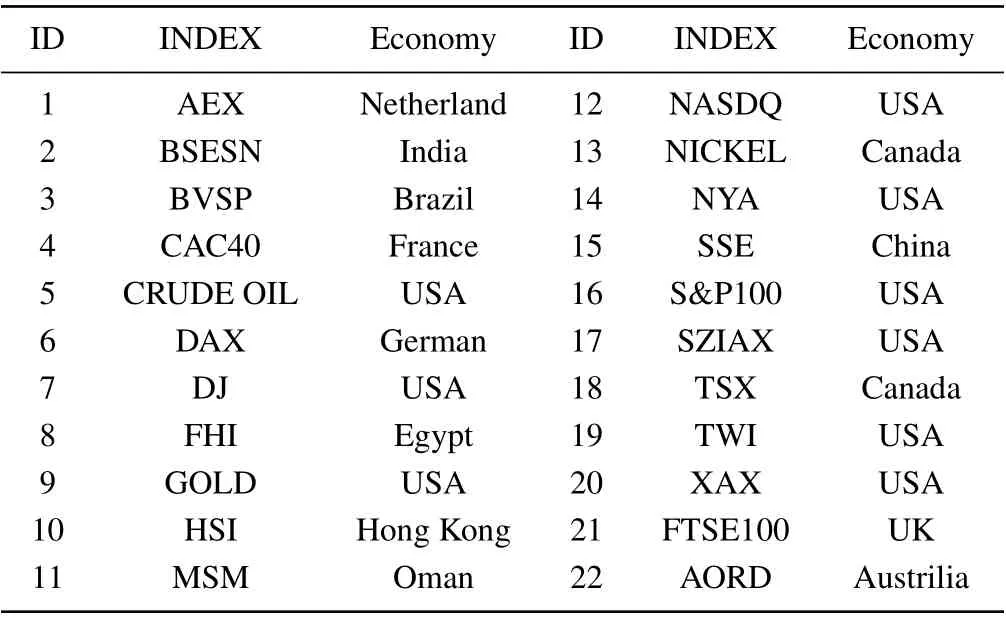
Table 1. The list of stock indices.
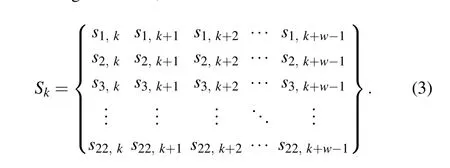
Hereafter,we will useSk,k=1,2,...,200 to calculate the information flows.
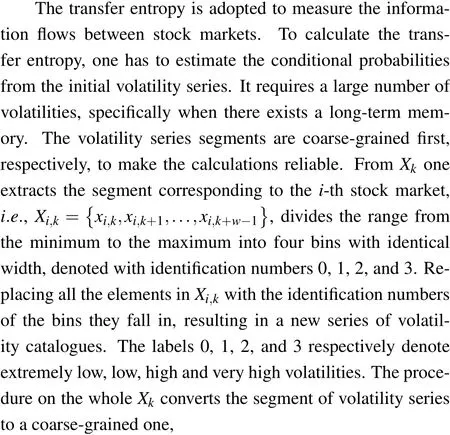
2.2. Temporal information flow network
As an illustration, let us calculate the transfer entropy from them-th stock market to then-th stock market in thek-th time duration. The corresponding series read
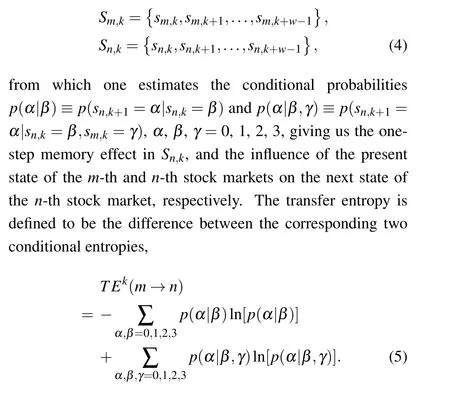

Note that we consider only the one-step memory in the series,while in reality,there exist long-term memories.The onestep memory gives us with the immediate influence, which may display the influences much more clearly. If we consider the long-term memories, there will appear complicated relationships due to the multi-step responses between stock markets. The direct influences may be merged in the complicated responses.
2.3. Koopman mode decomposition
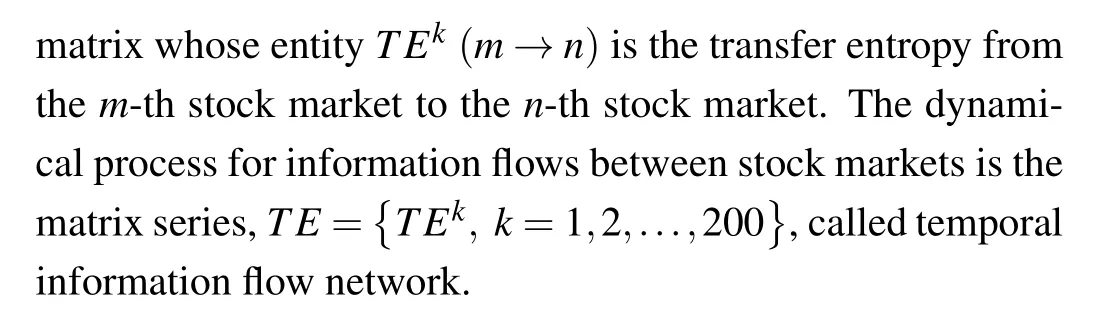
Now we rewrite the dynamical process for the information flowsTEwith a matrix with 22×22 rows and 200 columns,denoted withY,whose entities read
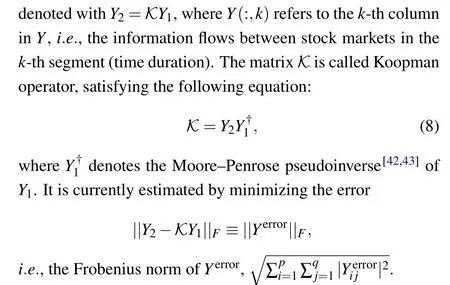
The dynamic modes correspond to the eigenfunctions ofK. The operatorKis a matrix with a size of 484×484, implying that we have a total of 484 eigenvalues and corresponding eigenfunctions. In reality, most of the eigenfunctions reflect the microscopic details depending on the noises and occasional events. Herein, we are interested in the eigenfunctions that can give us the intrinsic law in the information flows.
Technically, the singular value decomposition (SVD) is used. We compute the reduced and appropriately truncated SVD ofY1,Y1≈UrΣrV*r,whererrefers to the reduced rank of the approximated operator less than min(22·22,199)=199.In most cases the intrinsic dynamical law can be captured by selecting a small value ofr. A low-rank approximation ofKis then defined to be ˜K= ˜K=U*r KUr=U*r Y2VrΣ-1r, whose eigendecomposition reads
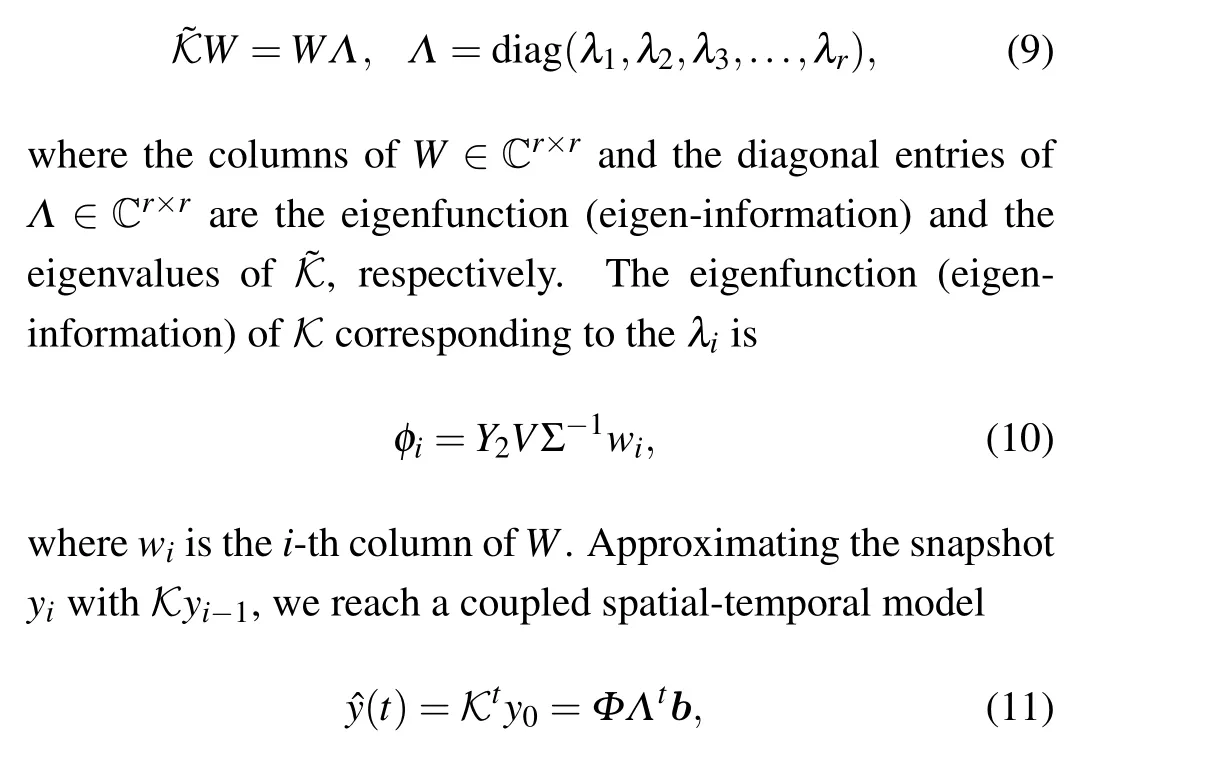
whereΦ ∈Cn×rconsists of the columns ofφi, andbis a set of weights satisfyingy0=Φb.
3. Experimental results and observations
Figure 2(a1) shows the volatility series for all the stock markets. The FHI stock market in the Egypt economy area(ID=8)has higher volatilities than others. The flow process is not random,i.e.,there exist spatial patterns evolving slowly along time, as shown in the heat-map for constructed information flow process in panel (a2). In panel (b1) the singular values ofY1is ranked in descending order. The ranked singular value turns out to decrease faster than an exponential law. Actually,the first nine of the square singular values dominate up to 93% of the sum of all the square singular values(see panel (b2)). The most dominant one contributes 75%,reflecting the clear demarcation of the information flows between and within the stock indices. The eigenvalues for the nine dominant modes read

which are obtained by using the Koopman mode decomposition after truncation of the singular values. Because the step in our calculation is one month,the corresponding periods for these modes are≥1/0.111~9 months.
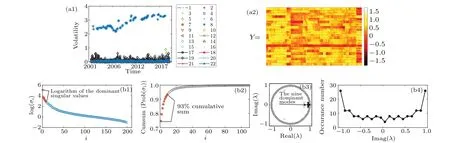
Fig.2. (a1)The monthly volatilities for the 22 stock markets in Table 1, (a2)the heat map of the temporal information flow of Y, (b1)the logarithm of the singular values. (b2) The cumulative sum of the probability of the square singular values. The top nine dominate up to 93% of the sum of all the square singular values, called dominant modes. (b3)The eigenvalues of K,in which the dominant modes are marked with solid circles. (b4)The distribution of the imaginary parts of the eigenvalues of K.
From Eq.(11)one can find that the specific characteristics for each component are determined by three factors, including the amplitude stored inΦ, the period determined by the imaginary part of the eigenvalue stored inΛ,and the decaying speed determined by the real part of the eigenvalue stored inΛ.Hence,the modes whose eigenvalues have small or even zero imaginary parts and positive real parts determine the macroscopic behavior of the information flows. The modes whose eigenvalues have large imaginary parts or negative real parts reflect the microscopic behaviors of the information flows or simply the noises, because a large imaginary part implies a rapid oscillation and a negative real part an odd-even oscillation with a period of one month. In panel (b3) we display all the 199 eigenvalues ofK(open circles), in which those corresponding to the nine dominant modes are marked with solid circles. The eigenvalues distribute mainly on a circle with several exceptions, and are symmetrical with respect to the level line imag(λ)=0. The real parts of the eigenvalues are all less than one,i.e., the system is stable. The dominant modes have smaller or even zero imaginary parts and large real parts, corresponding to the macroscopic behaviors of the information flows. From the distribution of the imaginary parts for the 199 eigenvalues(panel(b4))one can find that besides the nine dominant modes around the zero point of imaginary part, the modes distribute homogenously in the wide range of (-0.7,+0.7),i.e., the corresponding modes cover a wide range of periods from about one month to more than twenty years,without a characteristic period. The ignorable contributions for the modes can be explained by the small or negative values of the corresponding real parts.
The dynamical model is finally constructed as
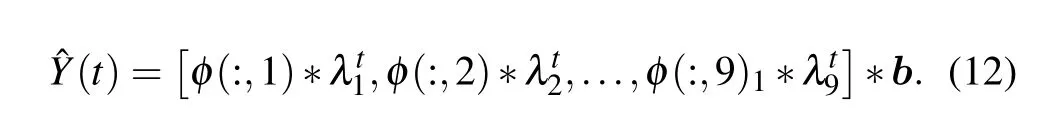
Generally speaking,the system shows a damping behavior.As shown in Fig. 3(a), the eigen-information flows between 154-176 modes are significantly higher than that between others,i.e.,there exist strong-directional information flows from the indices with high volatilities to that with low volatilities.Also,the eigen-information reflects the exact-true information flows because in each segment, there is no information flow within the same stock indices.
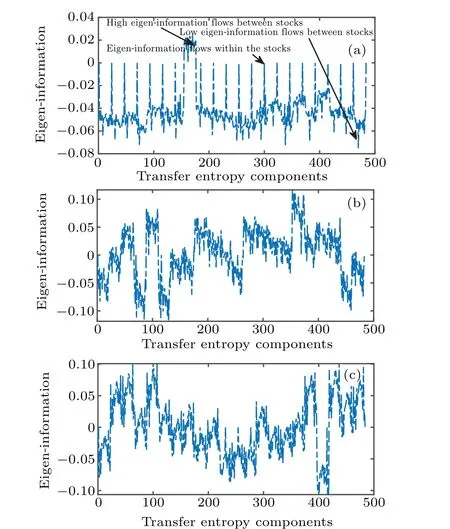
Fig. 3. The three most dominant eigenfunctions (eigen-information) of Y1.(a)Reflect the exact-true information flows because,in each segment,it has no information flows (quantified as 0) within the same stock indices. The other two (shown in panels (b) and (c)) do not show a clear demarcation between and within the stock indices since they have no information flows between the stock indices.
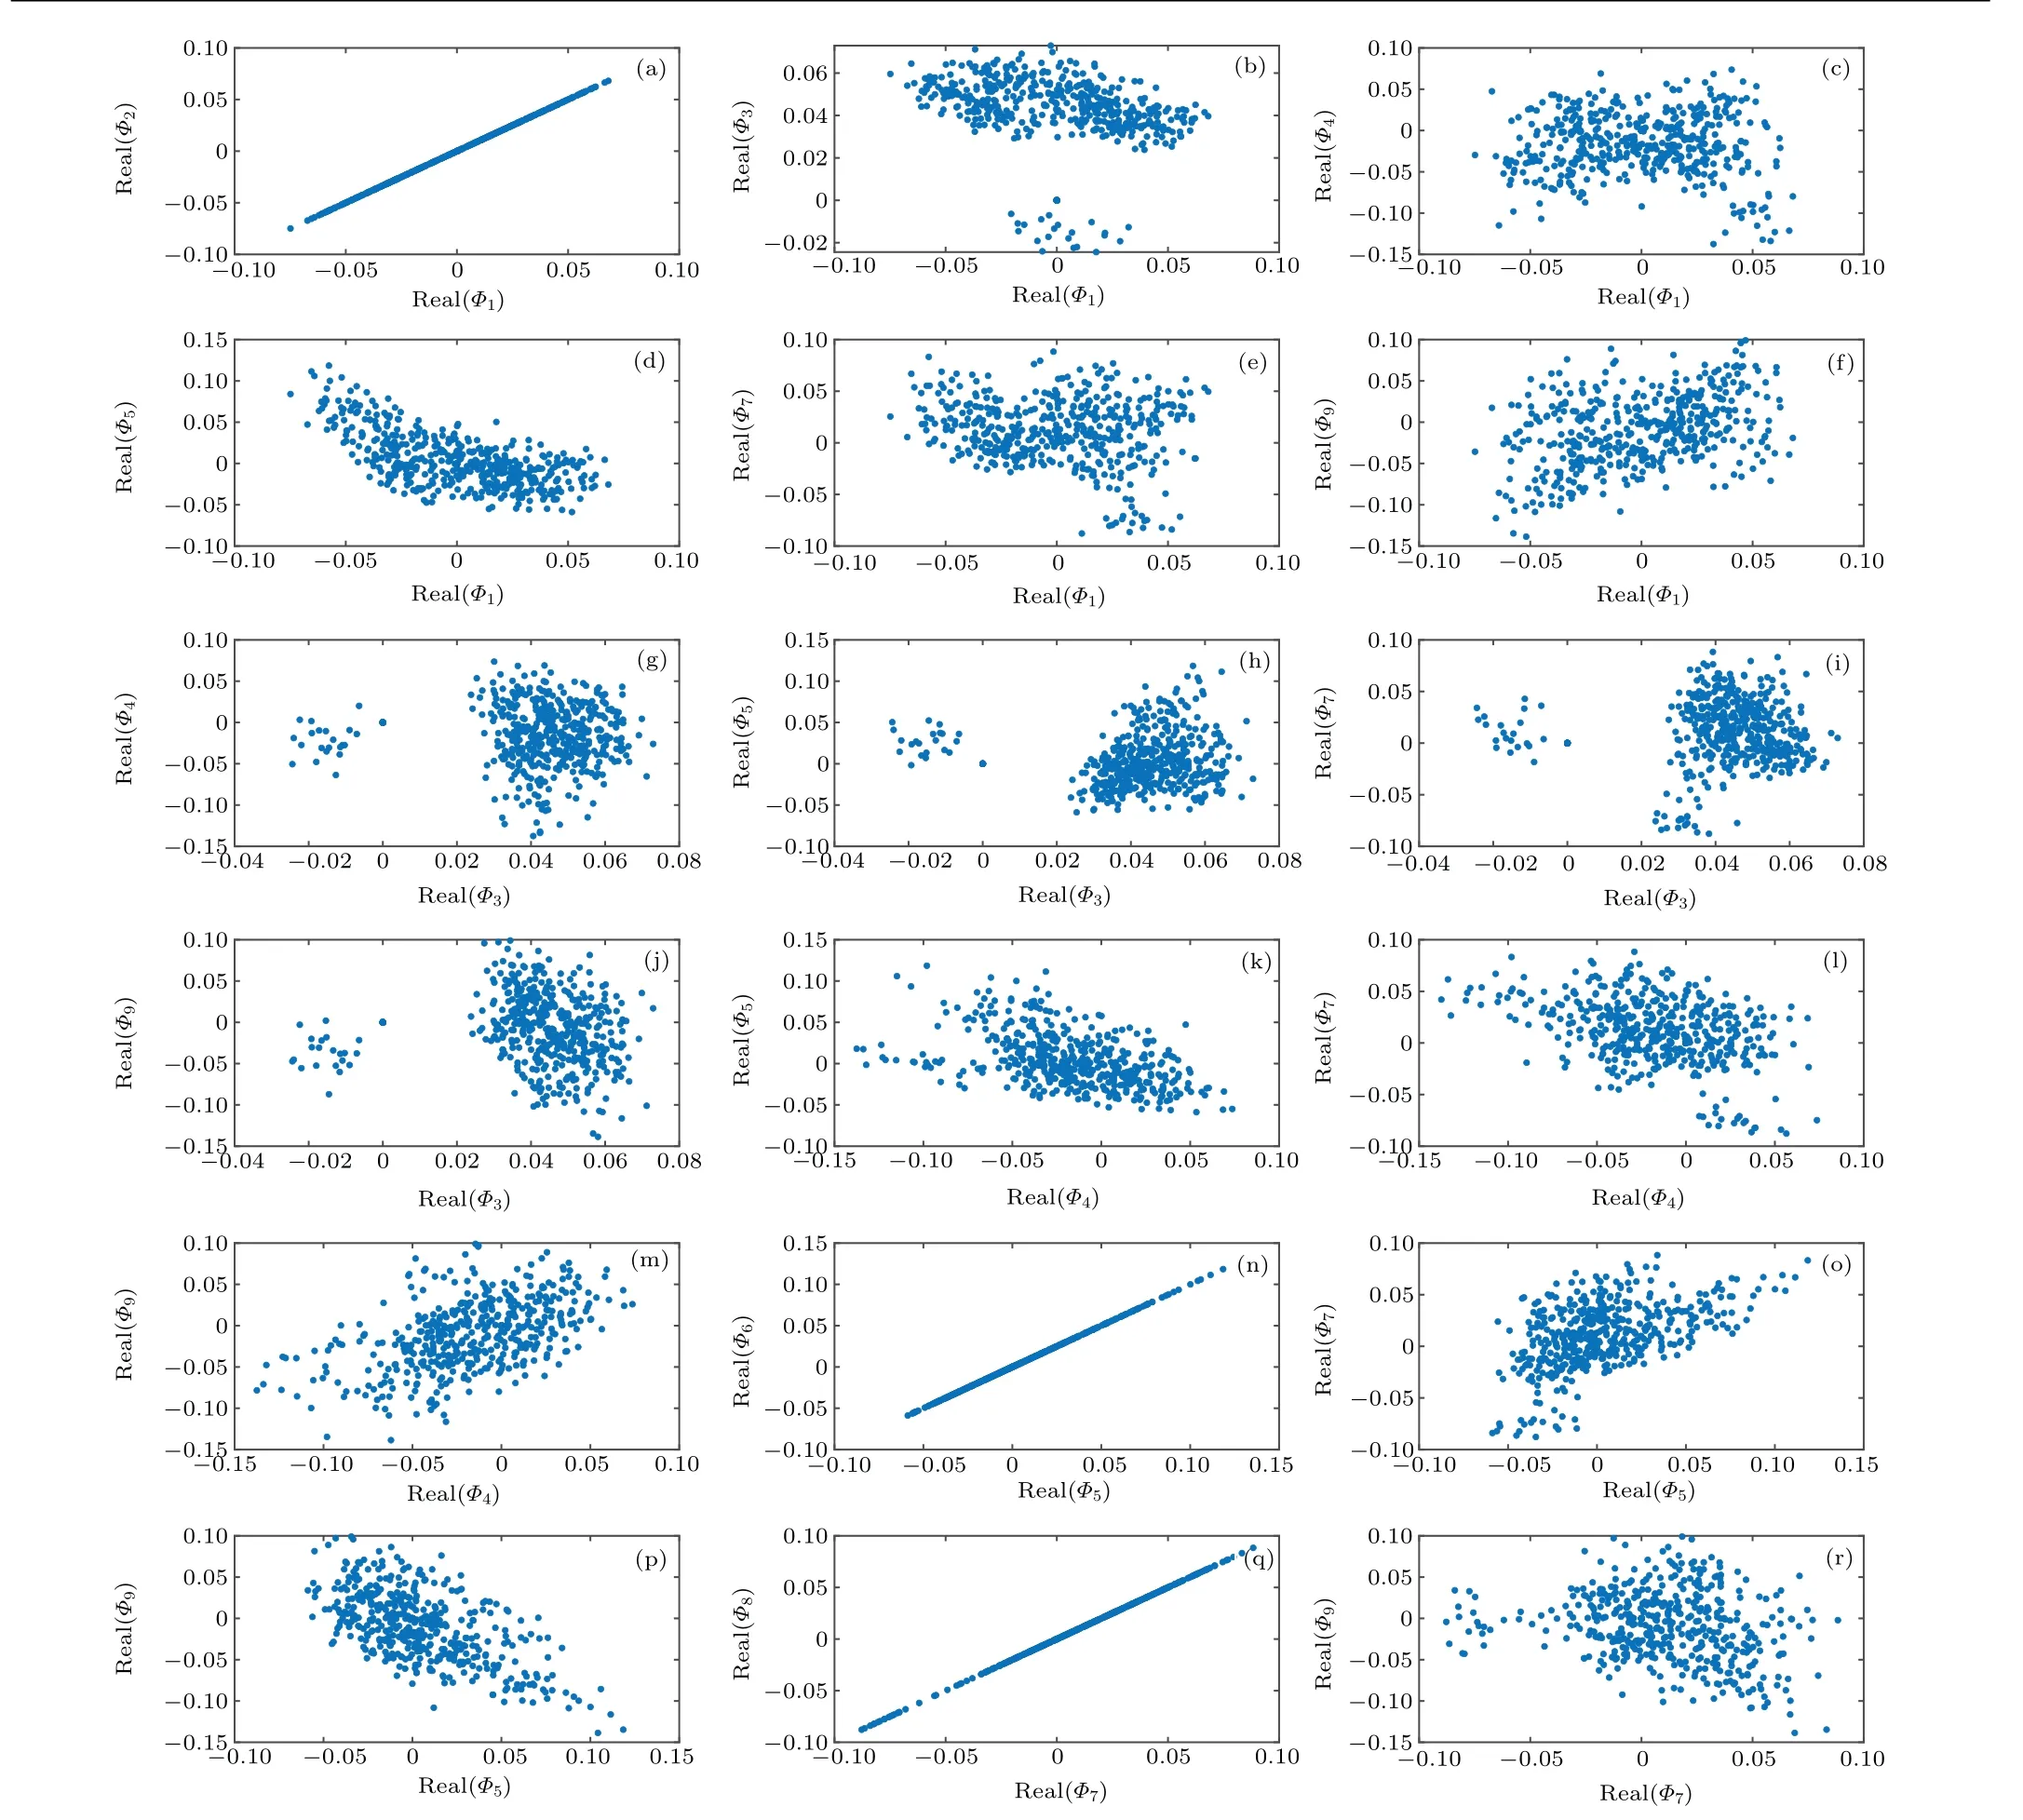
Fig.4. Correlations between the eigenfunctions: The distributions of the Koopman decomposition modes are not orthonormal. They are no significant linear correlation,between most of the eigenfunctions. Panels(a),(n),and(q)display the strong correlations between the eigenfunctions with its conjugate.
Figure 4 shows the relations between the 9 eigenfunctions. The correlations between the eigenfunction pairs numbered{1,2}, {5,6}, and{7,8}each are strong, actually their cross-correlation coefficients are all +1, as shown in the panels (a), (n), and (q). The two eigenfunctions in each pair correspond to two eigenvalues conjugating each other.The correlations between the other eigenfunctions are very weak. The Koopman mode decomposition produces nonorthonormal eigenfunctions.
The transfer entropy eigenfunctions(eigen-informations)are presented in Figs.5(a1)-5(f1),where each 484-row eigenfunction vector is recovered to a 22×22 matrix. The directional information flows are also displayed with the networks in the panels (a2)-(f2). The broader a link, the stronger influence between the linked stock indices. For visual convenience, we filter out the weak flows less than 0.05. The panels (a3)-(f3) are the distributions of the information flows in the panels (a1)-(f1). Most of the dynamic information flows in panel (c1) are less than 0.05, resulting in the sparse directional linkages in panel (c2). And they distribute randomly(panel(c3)). Its corresponding eigenvalue is 0.8823(the least one). In panel (b1), most of the dynamic information flow values are greater or equal to 0.05, leading to a densely connected network (panel (b2)), implying the clear demarcation information flows between and within the stock indices. The corresponding eigenvalue is 0.9935(the largest one). The FHI with ID=8 has no in-flow information,while the information from this stock index flows out to all the 21 stock indices. The information flows between the remaining 21 are bidirectional(panels (b2) and (b3)). The most stronger influences occur on the linkages FHI→S&P100(8,16),TWI→NASDQ(19,12),FHI→NICKEL(8,13),and FHI→NASDQ(8,12)(panel(b1)).
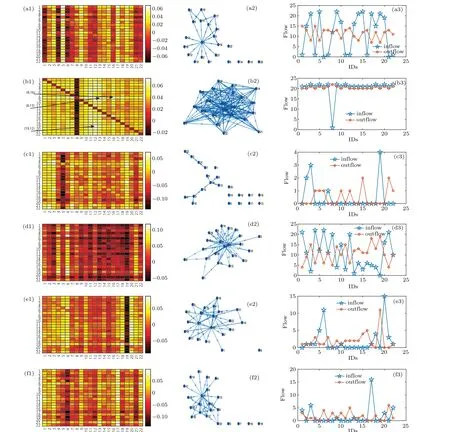
Fig. 5. Eigenfunctions: (a1)-(f1) the underlying information flows, which are displayed also with networks in panels (a2)-(f2). In the networks for which the weak information flows less than 0.05 are filtered out for visual convenience. Panels(a3)-(f3)are information flow distributions. Panels(a1)-(a3), (b1)-(b3), and (f1)-(f3) correspond to the eigenvalues of 0.9047±0.111i, 0.9935, 0.8823, 0.9182±0.0444i, 0.9563±0.0074i, and 0.9347,respectively.

Table 2. Real modes power (Pi =〈φi,φi〉2 =||φi||22), and numbers for information flows,and mono-directional information flows.
As shown in Table 2, the increase of mode power implies the increase of double-directional information flow,but the mono-direction flow increases with the decreasing power. When the mode power is 0.9871 the mono-directional stock is FHI,and the bi-directional stocks are AEX,BSESN,BVSP,CAC40, CRUDE OIL,DAX,DJ,GOLD,HSI,MSM,NASDQ,NICKEL,NYA,SSE,S&P100,SZIAX,TSX,TWI,XAX, FTSE, AORD. For 0.8780 mode power, the monodirectional stocks are CAC40,CRUDE OIL,DAX,FHI,HSI,MSM, NASDQ, SSE, SZIAX, TSX, TWI, and FTSE, and bi-directional are stocks AEX, BSESN, BVSP, DJ, GOLD,NICKEL, NYA, S&P100, XAX, and AORD. For 0.7870 mode power,the mono-directional stocks are CAC40,CRUDE OIL, DAX, FHI, GOLD, HSI, NASDQ, NICKEL, NYA,SSE,S&P100, SZIAX,TSX,TWI,XAX,and FTSE,and bidirectional are stocks AEX, BSESN, BVSP, DJ, MSM, and AORD. For all real power modes, FHI is mono-directional,and the bi-directional are stocks AEX,BSESN,BVSP,and DJ.
In Fig.6,the panels(a1)-(b1)present the dynamic information flows obtained with the original definition of transfer entropy and their average. In panels (a2)-(b2) the dynamic information flows reconstructed from the Koopman mode decompositions and their average are shown, respectively. Initially the system grows then decays to the equilibrium points(see panel(b2)). This behavior in physics,specifically in fluid dynamics, is commonly known as transient energy growthdecay,[44]occurring when the eigenvalues are very close with or equal to each other with the corresponding nearly parallel eigenvectors.[45,46]The constructed model’s transient energy growth-decay property is consistent with the presence of secular term (texp(ωt)) in the dynamic system. Hence, the dynamic model for the stock market system can be approximated with
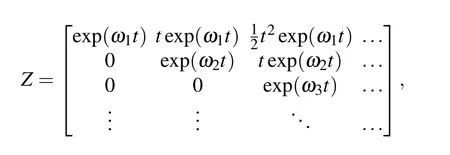
whereω1≈ω2≈ω3≈···. The Koopman operator approximately reads
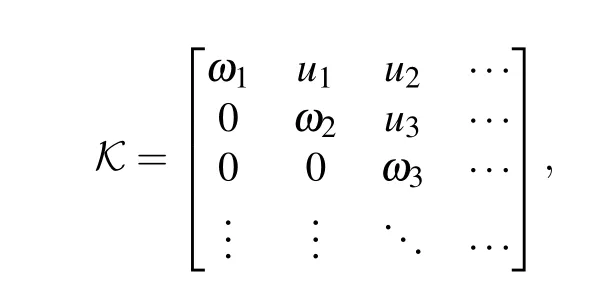
which can be truncated to a reasonable finite-dimensional with small error,i.e.,

Finally we reached a one decimal approximate Koopman operator

The eigenvalues for this Koopman operator read 1, 1, 1, 0.9,0.9,0.9,0.9,0.9,0.9,i.e.,they are very close with each other,implying that the eigenfunctions parallel with each other. In the field of of complex fluid, the concept of flexibility is currently used to describe the frequently and almost freely transitions of a macro-molecule between different geometrical configurations(shapes)due to the small energy gaps between the states. Accordingly,the fact of ease transitions between stock market states is defined herein to be flexibility of the stock market system.
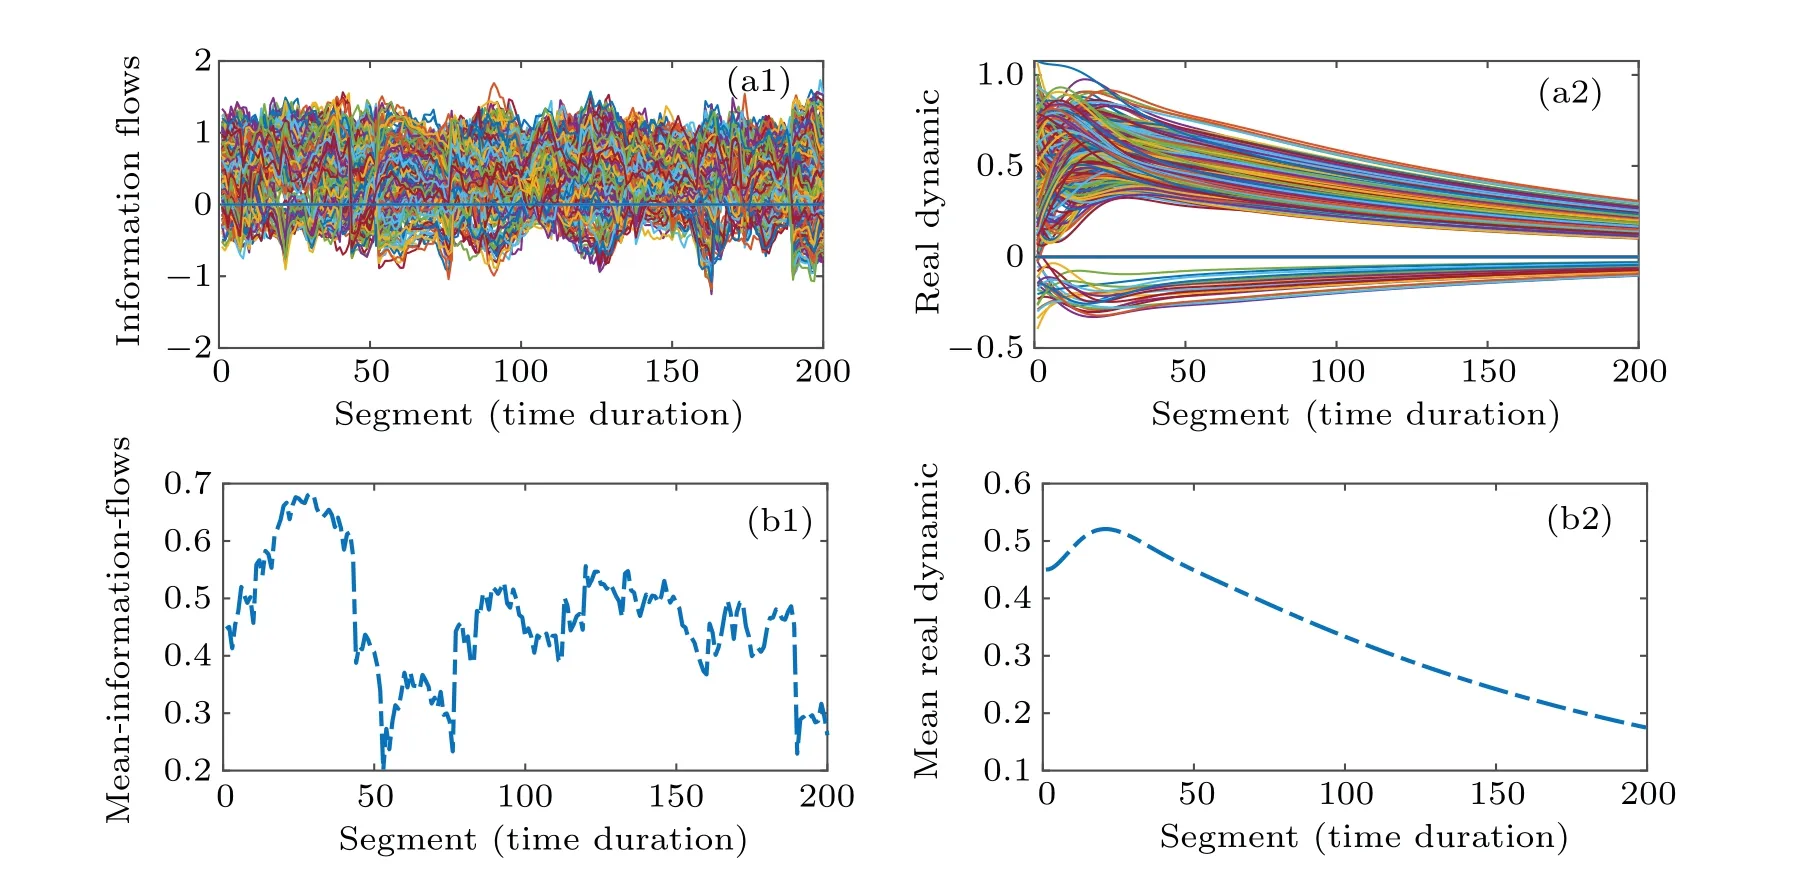
Fig.6. (a1)The information flows obtained with the transfer entropy definition and their average(b1). (a2)The information flows reconstructed with the Koopman decompositions and their average(b2).
4. Conclusion
In this article, a novel scheme for revealing the dynamic law from the temporal network proposed. It is illustrated by using monthly volatility series for 22 stock market indices distributed over the whole world. Let a window covering two years slide along the multivariate volatility series with a step of one month to extract the segments. The segments are coarsegrained by mapping the volatilities into very low, low, high,and very high catalogues, denoted with 0 to 3, respectively.The transfer entropy is adopted to construct the information flows between all the stock markets within the segments,forming a temporal information flow network. The Koopman operator is then used to extract the evolutionary law of the entropy flows between the stock indices.
It is found that the stocks with higher levels of volatilities send information to those with lower levels of volatilities,i.e., the influences are asymmetrical in the stock market system. The dynamic modes distribute homogenously in a wide range of periods from one month to more than twenty years.However,there exist only nine modes whose eigenvalues have large positive real parts and small or even zero imaginary parts,dominating the macroscopic patterns of the information flows.Generally speaking,there are no significant linear correlations between the eigenfunction,except between the eigenfunctions whose eigenvalues are conjugating with each other.The eigenvalues of the Koopman operator turn out to be nearly equal,and the corresponding eigenfunctions are parallel with each other,which imply high flexibility of the stock market system.And the real parts of the eigenvalues are less than one,indicating that the system is stable.
We hope the reconstructed model (Koopman operator)can find its application in prediction, intervention, and even control of the stock market system’s evolution. The proposed scheme can also be extended straightly to find the evolutionary law in systems composing of multi-subsystems each, such as in the physiological system of a human body.
Acknowledgements
Project supported by the National Nature Science Foundation of China (Grant Nos. 11875042 and 11505114), the Orientational Scholar Program Sponsored by the Shanghai Education Commission, China (Grant Nos. D-USST02 and QD2015016), and the Shanghai Project for Construction of Top Disciplines,China(Grant No.USST-SYS-01).
杂志排行

Chinese Physics B的其它文章
- Superconductivity in octagraphene
- Soliton molecules and asymmetric solitons of the extended Lax equation via velocity resonance
- Theoretical study of(e,2e)triple differential cross sections of pyrimidine and tetrahydrofurfuryl alcohol molecules using multi-center distorted-wave method
- Protection of entanglement between two V-atoms in a multi-cavity coupling system
- Semi-quantum private comparison protocol of size relation with d-dimensional GHZ states
- Probing the magnetization switching with in-plane magnetic anisotropy through field-modified magnetoresistance measurement