Cascading failures of overload behaviors using a new coupled network model between edges
2022-01-23YuWeiYan严玉为YuanJiang蒋沅RongBinYu余荣斌
Yu-Wei Yan(严玉为), Yuan Jiang(蒋沅), Rong-Bin Yu(余荣斌),
Song-Qing Yang(杨松青), and Cheng Hong(洪成)
School of Information Engineering,Nanchang Hangkong University,Nanchang 330063,China
Keywords: cascade failure,overload,load distribution,edge-based
1. Introduction
Cascading failure,[1]also known as avalanche reaction,refers to the large-scale failure of one or more damaged nodes in a network due to the coupling relationship. There are many cascading failures in real life. The occurrences of these cascading failures have a negative impact on lives. For example,in 2003, a large-scale power failure took place in the United States.[2]The blackout caused huge losses to local production and life. What is worse, economic losses amounted to hundreds of millions of dollars. This blackout is listed as the most serious accident in the United States. Therefore,it is of great necessity for relevant researchers to study the robustness and vulnerability of networks.[3-16]
In previous studies,the researchers studied the robustness of a single network, such as aviation network,[17]transportation network[18]and power grid.[19]However, with the development of network science, researchers have realized that no network exists in isolation. There is a relationship between different networks, such as power-aviation networks,power-computer networks, communication-transmission networks. In 2010, Buldyrewet al.[20]first proposed the coupling node model. They pointed out that when a node is attacked,the impact will be transmitted to the adjacent network through the coupling relationship. After that, many models based on coupling network have been proposed. First of all,Shaoet al.[21]established the multiple dependent relationship,and analyzed the cascading failure of networks with numerical analysis methods. They assumed that as long as the coupling edge of the node fails completely,the node will fail. Multiple interdependencies make the network transform from the first stage to the second stage. Dobsonet al.[22]established the adjacency relationship of networks according to the similarity of networks. They noted that the dependency relationship between two kinds of nodes. One is to establish the dependency relationship between the nodes with large degrees in two networks, the other to establish the dependency relationship between the nodes with large clusters in two networks.The research shows that the connection according to the similarity of the networks can improve the networks resistance to random attacks. Muroet al.[23]proposed a recovery model and pointed out that the failure process and recovery process can be alternated with each other. By detecting the boundary nodes and recovering them with a certain proportion, the robustness of the networks can be effectively improved.
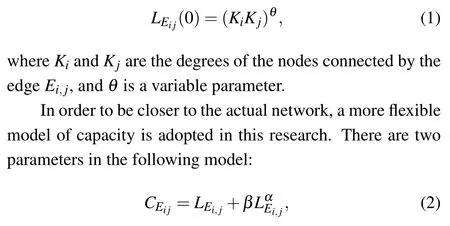
In a real network, the edges are also important, such as Internet lines, power lines, and transportation lines. Therefore, it is of great significance to study the cascade failure caused by edge collapse. In 2002, Kimet al.[24]studied cascading failures caused by edge collapse in a single network.In 2008,Chenet al.[25]proposed a single network load distribution model, and obtained the threshold conditions leading to cascading failures. The load of the edge is defined as(KiKj)θ,whereKiandKjare the degrees of the nodes connected by edgeEi,jandθis a variable parameter. Motteret al.[26]found that by deleting some edges in scale-free networks in advance,the impact of cascading failures can be effectively reduced.
All the cited studies do not consider the coupling relationship between edges in two or more networks. Nevertheless,the coupling between edges is very common in real networks.For example, in a railway network, when one of two closely related sides is damaged, the other will be damaged as well.However, the failure mode of the edge is different from that of the node. When a node fails,all the edges of the node will fail. At the same time,when a node in the network leaves the most important connection block, it will also fail. The node failure is shown in Fig. 1(a). When node A1 fails, node A2 also fails because it is separated from the most important connector. However,when the edge between nodes A1 and A5 in Fig. 1(b) fails, it will not damage the overall structure of the network. Therefore,it is of great significance to study the correlation of edges in two-layer networks. In this paper, a new edge network model is proposed to study cascading failures in two-layer networks. Moreover,a more flexible load capacity strategy is adopted to verify the model. The results show that this model is feasible. By changing the load parameters,capacity parameters,overload parameters and distribution parameters reasonably, the robustness of the system can be significantly improved.
This paper is arranged as follows:In Section 2,the special model of between edges is described in detail,including load distribution process,overload behavior,residual load distribution strategy and robustness evaluation. In Section 3,analyses and simulations are presented. Finally,the conclusion is made in Section 4.
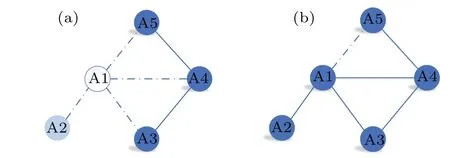
Fig. 1. Network failure diagram: (a) node failure diagram, (b) edge failure diagram.
2. Special network model between edges
In this paper,a two-layer network is established with two subnetworks denoted as networks A and B. The nodes are numbered asNAandNB, respectively. Therefore, the size of the network isN=NA=NB. A random method is adopted to connect the edges of networks A and B.Considering that the number of edges is different in networks with the same number of nodes,the minimum number of edges in the two networks is taken as the number of dependencies in the two networks.In order to verify the applicability of the proposed model,scale-free network,[27]small-world network[28]and random network model are taken as the subnetworks of the two-layer network in this research.
Figure 2(a) is a simplified diagram of the model. In Fig.2(a),{A1,A2,A3,...}represent the nodes of subnetwork A and{B1,B2,B3,...}represent the nodes of subnetwork B.The solid lines represent the connection between the nodes within the subnetworks, and the dashed lines represent the connection between the edges. When an edge in subnetwork A or subnetwork B is attacked, it is the edges belonging to the maximum component of subnetwork A/B that can maintain their functions while other edges will fail. Assuming that some edges in subnetwork A fail due to the initial attack, the failed edges in subnetwork A will be transferred to the edges of subnetwork B through the coupling relationship, resulting in the failure of subnetwork B.Likewise,the invalid edges in subnetwork B will also be transferred to subnetwork A through the coupling relationship.The iteration does not end until subnetwork A and subnetwork B reach stability. For example,supposing that edgesE2,3in subnetwork A is deliberately attacked,the failure ofE2,3will cause the failure ofE2,3in subnetwork B. Concurrently, the failure of edgesE2,3in subnetwork B will cause the failure in its internal edgesE1,2,which breaks away from the giant connecting piece. The first step is shown in Fig.2(b). The failure of edgesE1,2in subnetwork B will cause the failure of edgesE4,5in subnetwork A and the failure of edgesE4,5in subnetwork A will cause the failure in its internal edgesE2,4. The second step is shown in Fig.2(c).The failure of edgeE2,4in subnetwork A will cause the failure of edgeE3,5of subnetwork B.The final network is stable,and the final steady state of the overall system is shown in Fig.2(d).

Fig.2. The failure process of the new model between edges: (a)initial state of the network,(b)failure of the first step,(c)failure of the second step,(d)stable state of the network.
2.1. Load distribution process
In this study,it is assumed that the edge carries the load,such as the flow of road in the transportation and the electrical load in power. Based on the literature,[29]it is assumed that edgeEi,j(0)carries initial load in the following formula:
whereα ≥0,β ≥0. Whenα=1, the model is transformed into the ML model.
As is shown in Fig.3,the load of one edgeEi,jthat is attacked will be transferred to its adjacent edgeEi,m. Then edgeEi,jtransfers its load to edgeEi,maccording to the following formula:
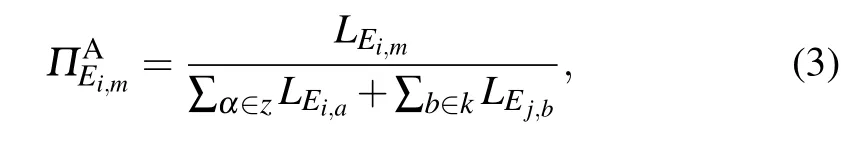
whereLEi,mis the load of the edgeEi,m,Zis the neighbor nodes of nodei,andKis the neighbor nodes of nodej.
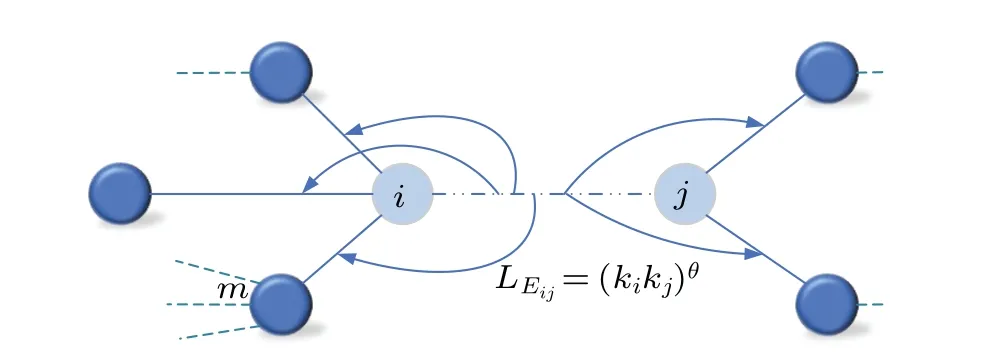
Fig.3. The load distribution strategy when an edge fails.
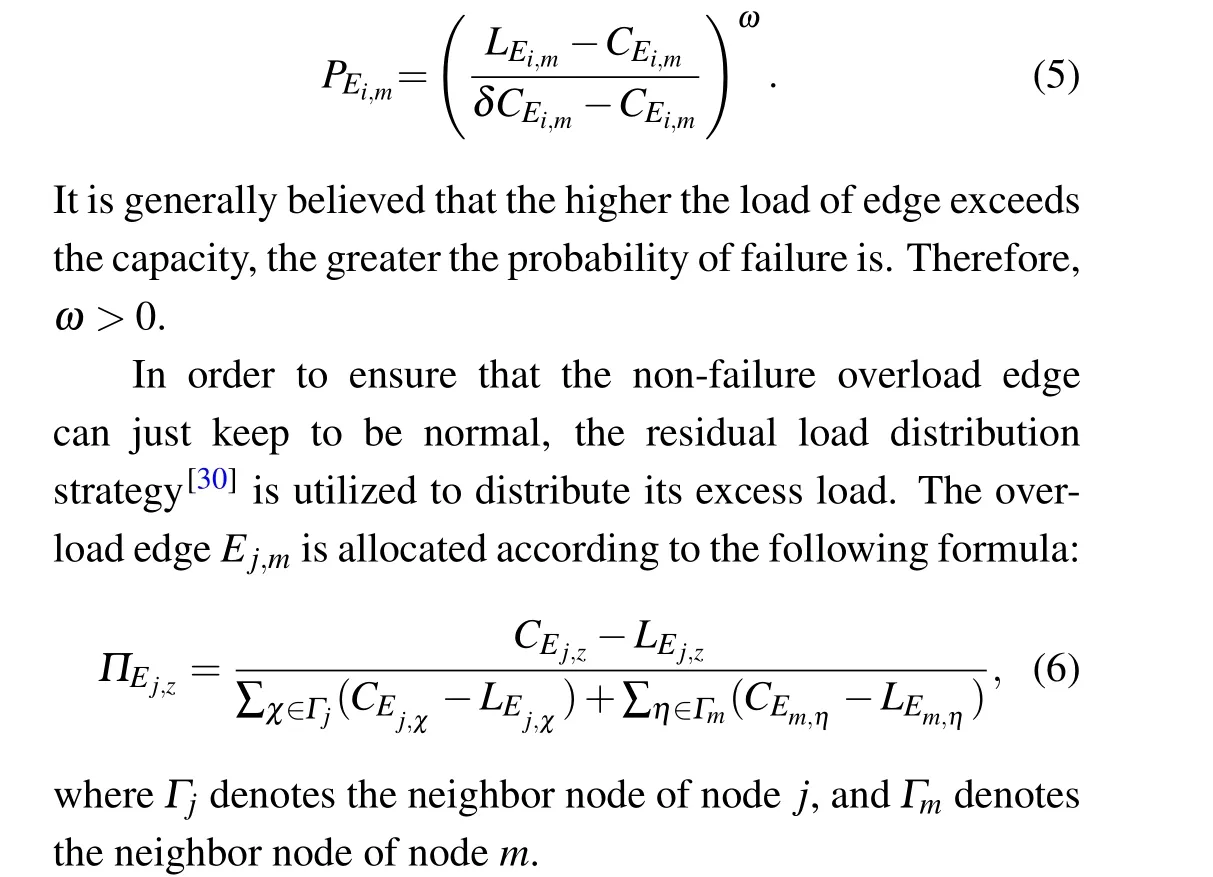
As the real network has elasticity, the edge may not immediately fail when an edge exceeds the capacity. Only when the edge exceeds the maximum capacity, it will fail immediately. Therefore,the overload coefficientδis used to express the processing ability of edgeEi,mfor additional load. When the load of edgeEi,mexceedsδCEi,m, edgeEi,mimmediately fails.When edgeEi,mis greater thanCEi,mand less thanδCEi,m,edgeEi,mwill fail with a certain probability.We judge the state of edgeEi,mby the following formula:

wherenrandomis a random number from 0 to 1,andPEi,mis the failure probability of edgeEi,m.
In the actual network, the edge processing capacity for the additional load is also different. Sometimes a small-scale overload may cause the edge to fail. To describe this character, the parameterωis introduced to characterize it.PEi,mis calculated by the following formula:
2.2. Robustness of the network
To trigger the cascading failure,we attack the most loaded edge in subnet A and the most loaded edge in subnet B simultaneously. Since the largest connected piece of a network is an important indicator to measure the robustness of the network,the size of the largest connected piece is recorded asG,
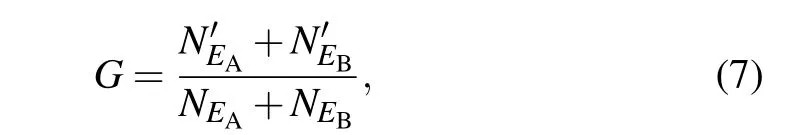
whereNEAis the initial number of edges in subnetwork A,NEBrepresents the initial number of edges in subnetwork B,N′EArepresents the number of edges after the failure in subnetwork A,andN′EBrepresents the number of edges after the failure in subnetwork B.The more edges the network has after being attacked,the more robust the network is.
3. Analyses of simulations
Different topologies of the network have different effects on its dynamics. In order to understand and control the effects of cascading failures on the network, we choose different topologies of the network(ER-ER edge-coupling network,WS-WS edge-coupling network, BA-BA edge-coupling network,BA-ER edge-coupling network,BA-WS edge-coupling network and WS-ER edge-coupling network) to conduct this research. At the same time, the influence of load parameter,capacity parameter,overload parameter,and distribution coefficient on the robustness of the network are investigated. Parameters about the network are listed in Table 1. The simulations run independently 500 times on average.
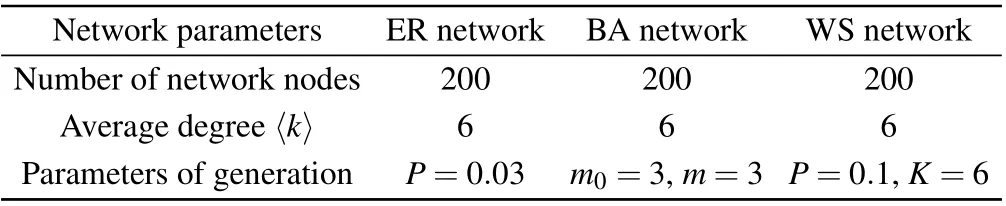
Table 1. Network parameters.
3.1. Influence of overload parameter δ on the model
To study the influence of overload coefficientδon the model,other parameters should not exert a massive impact on the robustness of the network. Assuming the distribution coefficientω=1,α=0.6,load coefficientθ=1,theG-βcurves with different values of the overload coefficientδare shown in Fig.4. As can be seen in Fig.4,with theβparameter increasing,the robustness of the model gradually increases.However,in the BA-WS edge-coupling network and the BA-ER edgecoupling network,the robustness is weaker than those in other networks, which indicates that different structures will lead to different robustness in the edge-coupling network. Meanwhile,it is found that the span fromδ=1.3 toδ=1.4 is not as large as the span fromδ=1.0 toδ=1.1 in this model.

Fig. 4. Robustness of network under different overload parameters δ: (a) BA-BA network of coupled edge, (b) ER-ER network of coupled edge,(c)WS-WS network of coupled edge,(d)BA-WS network of coupled edge,(e)BA-ER network of coupled edge,(f)WS-ER network of coupled edge.
In brief,it can be found that when the overload parameterδincreases in a small range, the robustness can be improved obviously. However, whenδis increased to a certain extent,the robustness changes little. Moreover,the robustness of the BA-WS and BA-ER edge-coupling network is weak.
3.2. Influence of load coefficient θ on the model
In order to study the influence of the load coefficientθon this model, other parameters do not have an excessive influence. Therefore,the overload coefficientδ=1.15,the distribution coefficientω=1,andα=0.6. DifferentG-βcurves for the load parameterθare shown in Fig.5.
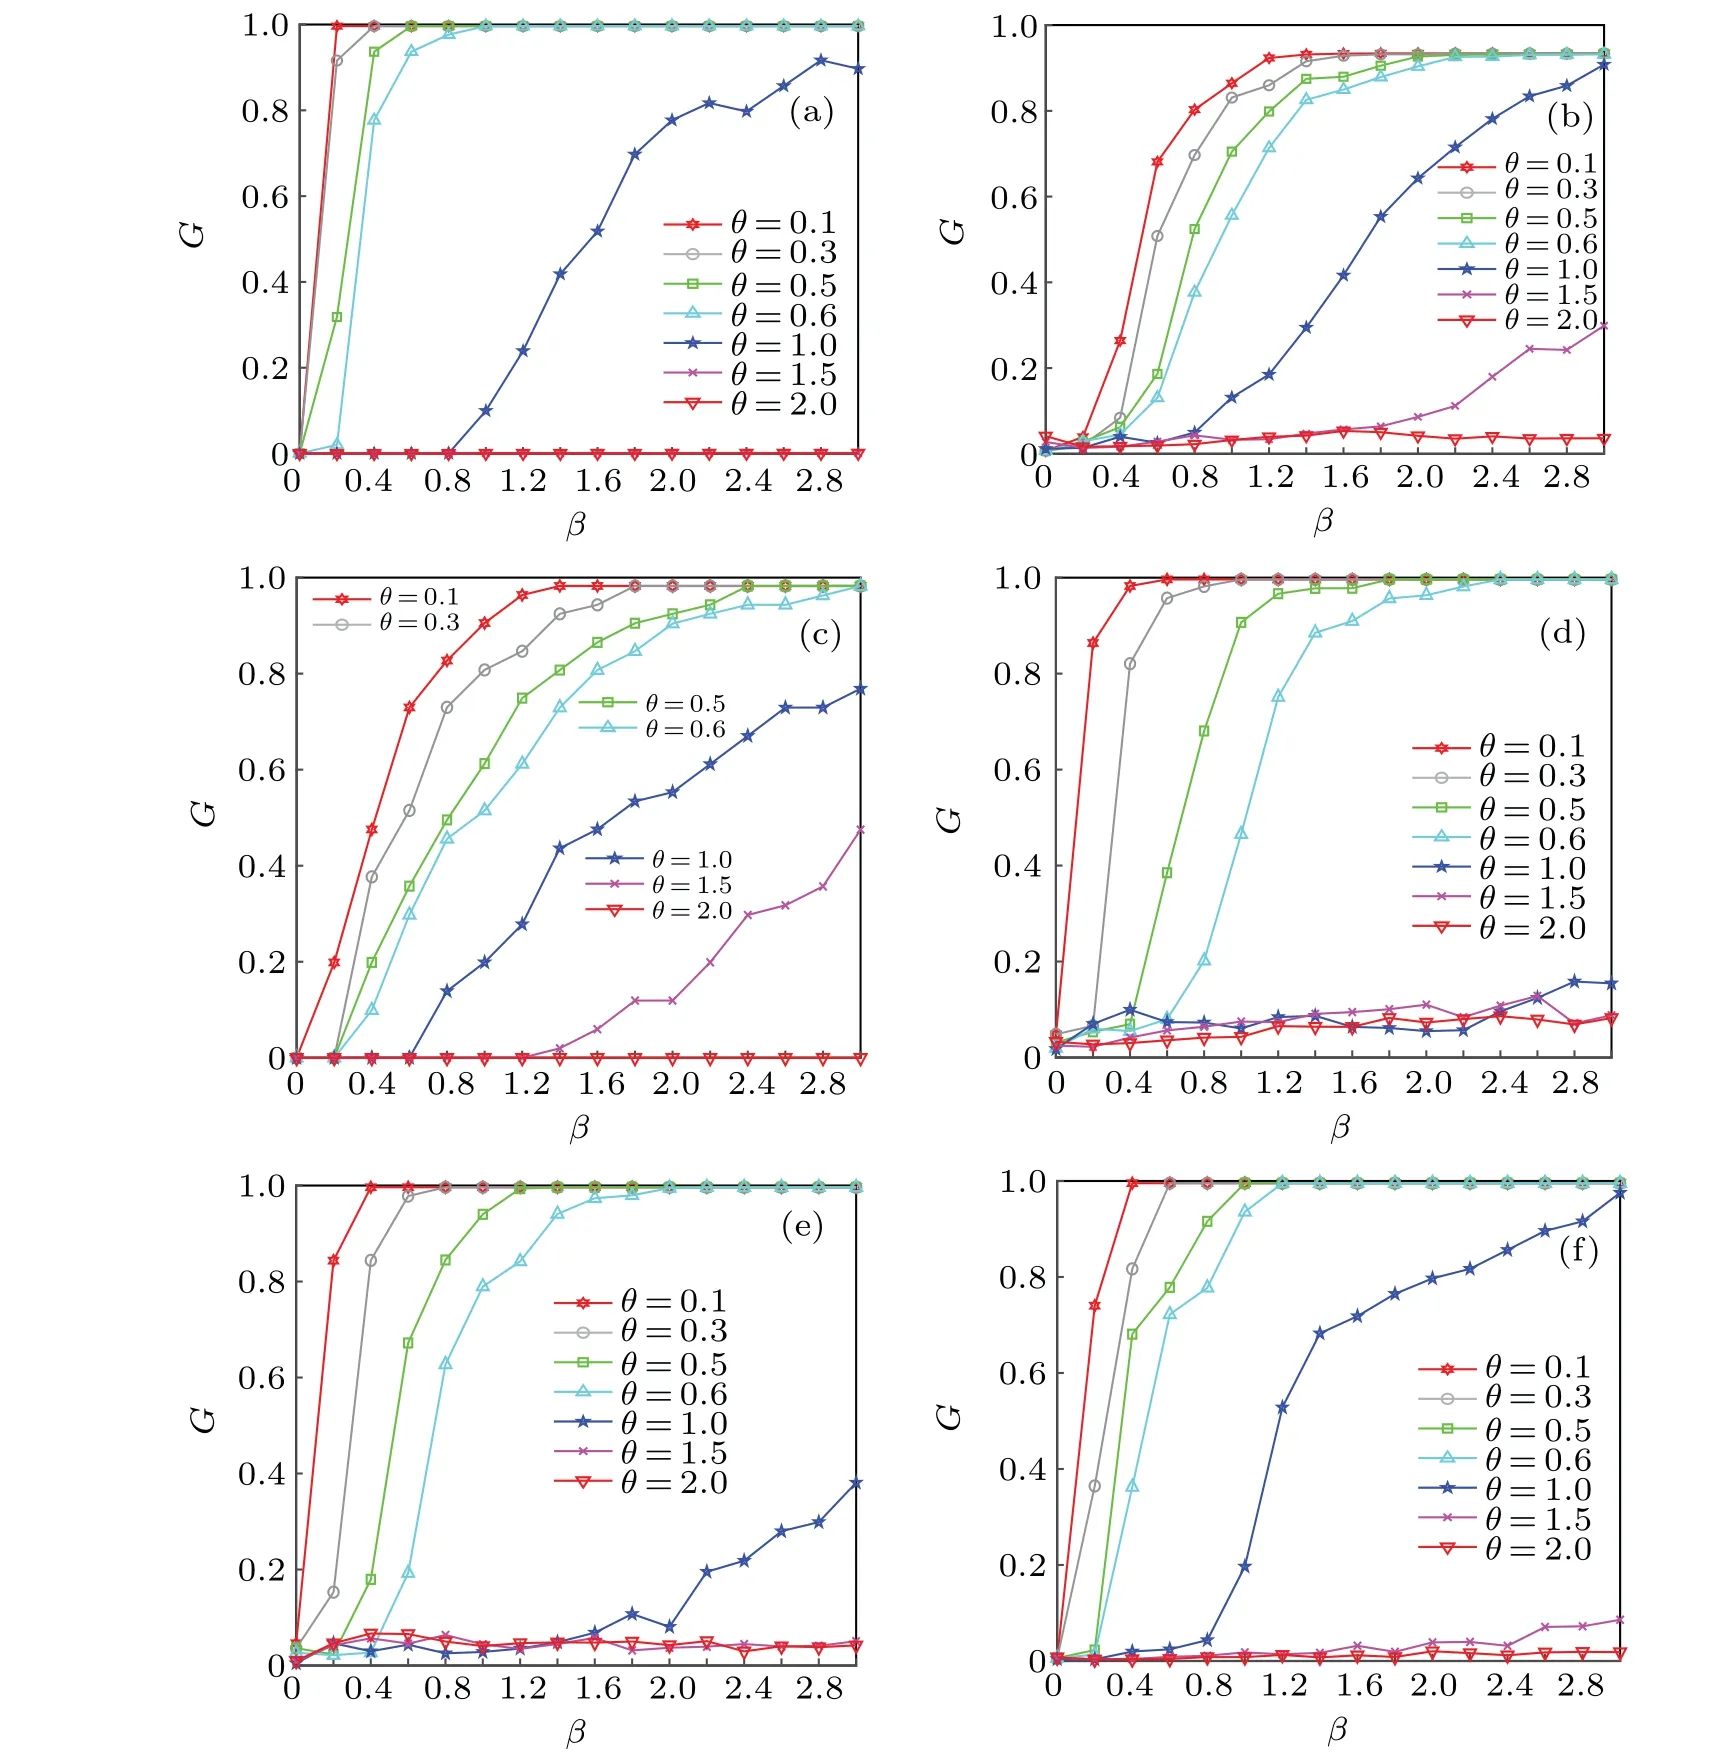
Fig. 5. Network robustness under different load coefficients θ: (a) BA-BA network of coupled edge, (b) ER-ER network of coupled edge, (c)WS-WS network of coupled edge,(d)BA-WS network of coupled edge,(e)BA-ER network of coupled edge,(f)WS-ER network of coupled edge.
Firstly,whenθ<1,the robustness of different networks behaves differently with the increase ofβ. It can be seen that the BA-BA edge-coupling network is more sensitive to theβparameter in Fig. 5(a). The robustness of the BA-BA edgecoupling network increases in the range ofβfrom 0 to 0.4.Whenβ=0.8,the network robustness is the strongest.
In Fig.5(b),the robustness of ER-ER edge-coupling network increases in the range ofβ=0.4-1.2. Whenβ=2,the network robustness is the strongest. In Fig. 5(c), the robustness of the WS-WS edge-coupling network becomes obvious in the range ofβ=0-1.6. Whenβ=2.8,the network robustness is strongest. In Fig. 5(d), the robustness of the BA-WS edge-coupling network is enhanced in the range ofβ=0-1.2.Whenβ= 2.4, the network robustness is the strongest. In Fig.5(e),the robustness of the BA-ER edge-coupling network becomes clear in the range ofβ=0-0.8. Whenβ=1.8,the network robustness is supreme. In Fig. 5(f), the robustness of the WS-ER edge-coupling network turns remarkable in the range ofβ=0-1. Whenβ=1,the network robustness is notable.
Whenθ=1,the robustness of ER-ER,BA-BA,and WSWS edge-coupling networks rises slowly. Furthermore,it can be seen that the robustness of the BA-WS network is lower than 0.2 in Fig. 5(d). In Fig. 5(e), it can be seen that the robustness of the BA-ER edge-coupling network shows a clear upward trend,starting atβ=1.6. However,the robustness of the WS-ER edge-coupling network is the strongest.
Whenθ=1.5, only the robustness of the WS-WS and ER-ER edge-coupling networks shows a more obvious upward trend.
Whenθ=2,the robustness of all networks is terrible. It can be seen that whenθ>1,its load parameterθhas a massive impact on the robustness of the networks.
3.3. Influence of the distribution coefficient ω on the model
In order to study the influence of the distribution coefficientωon the model, it is assumed that the overload coefficientδ=1.15,α=0.6,and the load coefficientθ=0.5. TheG-Bcurves with different values of the distribution coefficientωare shown in Fig.6.
It can be seen in Fig. 6 that the robustness of the networks with different structures will gradually increase with the increase of parameterβ. However, as theβvalue increases to a certain extent (turning pointβc), the change of distribution parameterωwill not cause any change in the robustness of the model. The turning pointβcis different for networks with different structures, including the BA-BA edge-coupling networksβc=1,the ER-ER edge-coupling networksβc=0.9,the WS-WS edge-coupling networksβc=1.7,the BA-WS edge-coupling networksβc=1.2, BA-ER edgecoupling networksβc=1.1, and the WS-ER edge-coupling networksβc=0.9. Therefore, finding a suitableωis significant for controlling cascade failure in real networks.
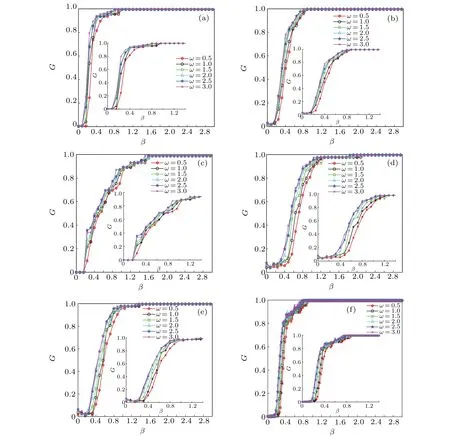
Fig.6. Network robustness under different distribution coefficients ω (insets are the enlarged pictures): (a)BA-BA network of coupled edge,(b) ER-ER network of coupled edge, (c) WS-WS network of coupled edge, (d) BA-WS network of coupled edge, (e) BA-ER network of coupled edge,(f)WS-ER network of coupled edge.
3.4. Influence of capacity parameters α and β on the model
To study the influence of capacity parametersαandβon the model,this research is carried out with the distribution coefficientsω=1,overload coefficientδ=1.15,and load coefficientθ=0.6. The simulation results are shown in Fig.7.
It can be seen in Fig.7(a)that the robustness of the model gradually increases with the increase ofα. However, when the critical valueα=1, the networks of different structures show the strongest robustness. Similarly, in Fig. 7(b), when the critical valueβ=1.4,the networks show the strongest robustness. It can be observed that the robustness of the BA-BA edge-interdependence networks is stronger than those in other networks. In general, by adjusting theαandβparameters,the networks can obtain maximum robustness more quickly.Therefore,it is unwise to adjust a single parameter ofαorβparameters in a real network.
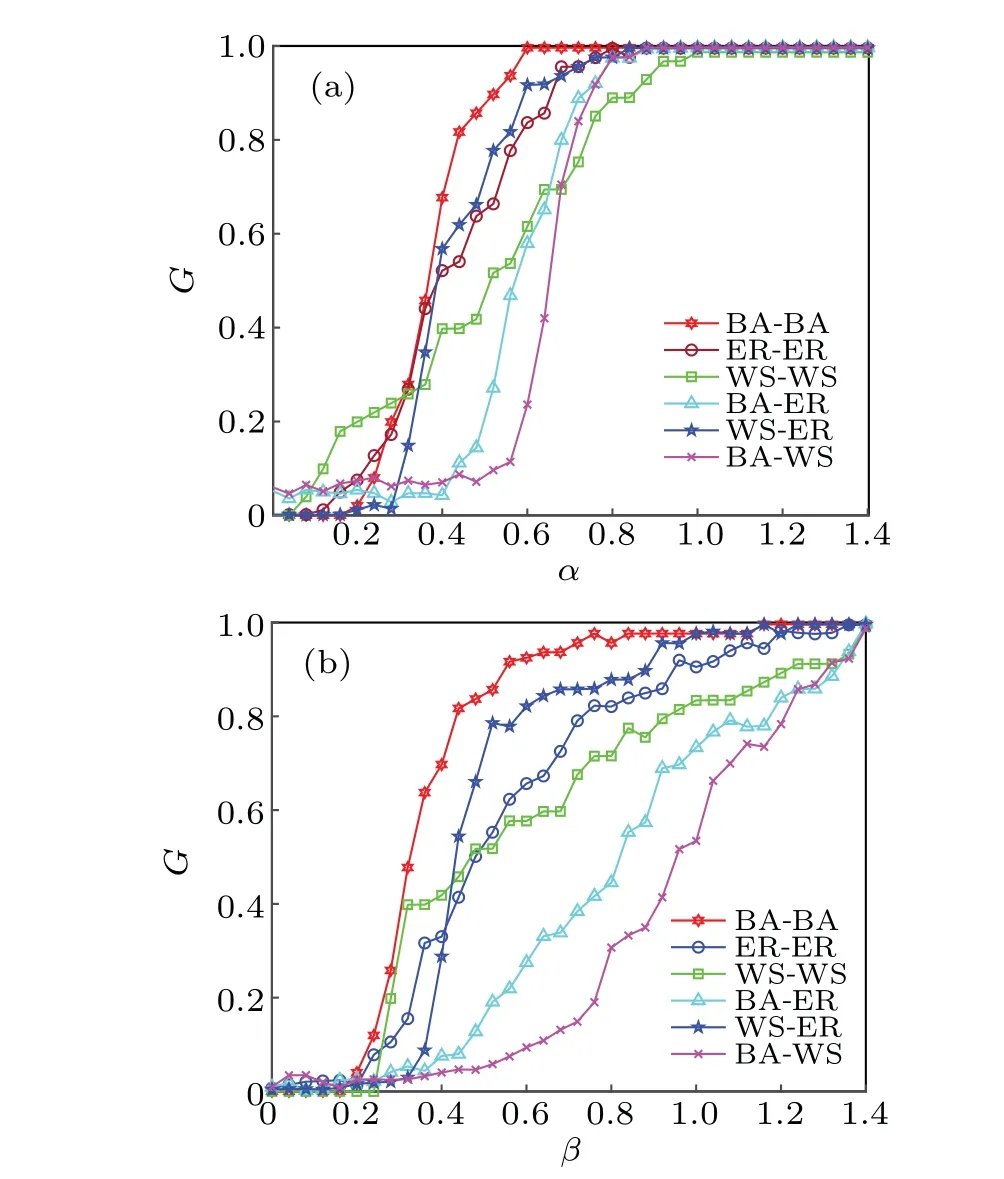
Fig. 7. Robustness of different networks under capacity parameters:(a)robustness under the condition of β =0.8,(b)robustness under the condition of α =0.6.
4. Conclusion
The edge in the network not only has the function of maintaining the overall structure of the network but also serves as the medium of information dissemination. Therefore,studying the coupling on edges of the network is of great significance for studying the robustness of the network. Considering multiple parameters and apply them to BA-BA,ER-ER,WS-WS,BA-WS,BA-ER,WS-ER networks,we construct an edge-to-edge coupling model of different two-layer networks.It is found that difference in the structure of the model will lead to difference in robustness,and the span fromδ=1.3 toδ=1.4 is not as large as the span fromδ=1.0 toδ=1.1.Meanwhile,whenθ>1,its load parameterθleads to poor robustness of the network. In distribution parameterω,the critical thresholdβcis explored.The turning pointβcis different in different structures. As to the capacity parameters,it is found that adjusting the capacity parametersαandβsimultaneously can improve the robustness of the network significantly.
In general, this model provides a new reference for controlling and avoiding cascade failure. For further studies, we will explore the robustness of networks from the perspective of the coupling relationship between edges and that between nodes simultaneously in the future.
Acknowledgements
This work is supported by the National Natural Science Foundation of China (Grant No. 61663030), the Natural Science Foundation of Jiangxi Province, China (Grant No.20142BAB207021),and the Innovation Fund Designated for Graduate Students of Jiangxi Province, China (Grant No.YC2021-S680).
杂志排行

Chinese Physics B的其它文章
- Superconductivity in octagraphene
- Soliton molecules and asymmetric solitons of the extended Lax equation via velocity resonance
- Theoretical study of(e,2e)triple differential cross sections of pyrimidine and tetrahydrofurfuryl alcohol molecules using multi-center distorted-wave method
- Protection of entanglement between two V-atoms in a multi-cavity coupling system
- Semi-quantum private comparison protocol of size relation with d-dimensional GHZ states
- Probing the magnetization switching with in-plane magnetic anisotropy through field-modified magnetoresistance measurement