Polymorph selection of magnesium under different pressures:A simulation study
2022-01-23WeiLiu刘维BoqiangWu吴博强ZeanTian田泽安YunfeiMo莫云飞TingfeiXi奚廷斐ZhiyiWan万子义RangsuLiu刘让苏andHairongLiu刘海蓉
Wei Liu(刘维) Boqiang Wu(吴博强) Ze’an Tian(田泽安) Yunfei Mo(莫云飞) Tingfei Xi(奚廷斐)Zhiyi Wan(万子义) Rangsu Liu(刘让苏) and Hairong Liu(刘海蓉)
1College of Materials Science and Engineering,Hunan University,Changsha 410082,China
2School of Physics and Microelectronics,Hunan University,Changsha 410082,China
3School of Electronics and Communication Engineering,Changsha University,Changsha 410003,China
4School of Materials Science and Engineering,Zhejiang Sci-Tech University,Hangzhou 310018,China
Keywords: magnesium,polymorph selection,molecular dynamics,pressure
1. Introduction
Crystallization during solidification is a complex process and plays an important role in determining the microstructure and mechanical and chemical properties of metallic materials.[1]When a metal possesses more than one type of crystalline form these different forms are known as polymorphs.[2]Polymorph selection during solidification is quite complicated, and is controlled by both thermodynamics and dynamics. Zhaoet al.[3]demonstrated that the dualphase AlCoCrFeNi2.1eutectic high-entropy alloy(HEA)with face-centered cubic (FCC)/body-centered cubic (BCC) modulated lamellar structures has a unique combination of high strength and excellent ductility, while the single-phase FCC structure exhibits high ductility but low strength.[4]The singlephase BCC HEA shows a high yield strength at the expense of ductility.[5]Thus, it is important to understand and control polymorphic transitions during the crystallization process for material design and application.[6-9]
The selection of polymorphs is mainly influenced by the chemical composition, cooling rate and other processing factors during solidification.[10]Although phase diagrams provide guidance to the structure of thermodynamically stable end-products,little is known about how about the energy picture of matter during nucleation and growth. Various studies have demonstrated that intermediate metastable phases occur during crystallization, where the formation of a phase is not determined by its absolute stability but by the closeness of the growing phase to its parent phases; this is referred to as the Ostwald step rule.[11-13]Some researchers have found that when the cooling rate is fast enough to suppress the nucleation and growth of the crystalline phase,the metallic liquid undergoes a glass transition and forms metallic glass or amorphous metal with a metastable phase at room temperature.[14-16]In addition to the cooling rate,pressure is also an important thermodynamic variable of metallic liquids during the solidification process.[17-19]In particular, when the pressure reaches a certain value the solidification thermodynamics and dynamic conditions of metals or alloys will be greatly changed. Recently, high-pressure technology has attracted significant research attention for discovery of new phases or materials[20]because it can effectively reduce the atomic volume and alter the free energy of different phases and the physical and chemical properties. For example,Diaset al.[21]recently observed room-temperature superconductivity(287.7 K)for the fist time at a high pressure of 267 GPa.
However,the experimental observation of microstructural evolution during solidification under high pressure is still a challenging task. Molecular dynamics (MD) simulation is an efficient tool for such systems and has been widely employed in the study of polymorphic transitions and nucleation of metals.[22-26]For instance, Desgrangeset al.[22]utilized MD simulations to study the mechanism of polymorph selection and demonstrated that changing the conditions (pressure or temperature) of crystallization could exert thermodynamic control of polymorphs during the growth step of a Lennard-Jones fluid. Anet al.[23]revealed the phonon dispersion of Al at ambient pressure, with the aim of assessing the formation of the BCC Al polymorph during the crystallization process.Mahataet al.[24]used MD simulations to study homogeneous nucleation during Al solidification.These works provide novel insights into the mechanism of polymorph selection, but several questions about the details of polymorph selection remain unanswered.
Herein,MD simulations were employed to guide the design of crystallization pathways and explore the effect of pressure on polymorph selection of Mg during rapid solidification.The pair distribution function (PDF), the cluster-type index method (CTIM) and some other statistical methods were utilized to reveal the structural and dynamic characteristics of Mg. The results show that pressure has an important influence on the dynamics of liquid Mg and the crystallization pathway of metallic Mg. The dynamics of Mg melt are rapidly slowed down under high pressure and the dynamic heterogeneity increases with increasing pressure. In terms of polymorph selection, the microstructure was transformed from hexagonal close-packed (HCP) to the A15 complex phase with increasing pressure from 0 GPa to 10 GPa. In addition, the phonon dispersion of Mg under different pressures was analyzed to reveal the nature of polymorph selection.
2. Computational methods
2.1. Force field
The initial simulations were carried out using the LAMMPS package. The force fields of Mg using the embedded-atom model (EAM) potential were adopted; this model was developed by Mendelevet al.[27]and has been widely utilized to study the crystallization process of Mg. The PDF is a Fourier transform of the structure factorS(q),which can be obtained from x-ray diffraction of a system. To verify the validity of the potential function,g(r) of liquid (g(r)represents the probability distribution of finding other atoms at a certain distance (r) in a system with a fixed particle as the center)and the atomic volume of Mg under various pressures at room temperature were calculated. Hence, the liquid structure of Mg could be verified by comparing the calculatedg(r)curves with the experimental results of Wasedaet al.,[28]as shown in Fig.1(a). Figure 1(a)shows excellent consistency between twog(r)curves at 953 K and 1063 K under zero pressure. Also, Fig. 1(b) shows that the calculated compression curves of Mg are in good agreement with the experimental results of Errandoneaet al.[29]and Clendenenet al.[30]Thus,the EAM potential can be utilized for studying the pressureinduced polymorphic transitions of Mg.
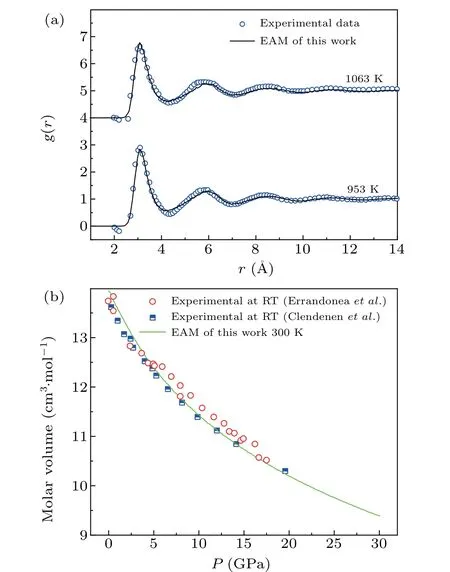
Fig. 1. The validity of potential function: (a) comparison of the simulated g(r) curves (solid curves) with experimental data (blue circles)[28] for Mg at different temperatures;(b)compression curve of Mg under different pressures(shallow green solid curve)and the experimental data(red circles)[29](blue half solid squares).[30]
2.2. Simulation details
The MD simulations were performed using a system with 80000 atoms in a cubic box with periodic boundary conditions, with theNPT(constant number of particlesN, pressurePand temperatureT)ensemble using a time step of 2 fs with a Nose-Hoover thermostat and barostat implemented in the LAMMPS package.[31]First, the system was relaxed for 2000000 time steps (4 ns) at 1300 K (the melting temperature (Tm) of Mg under 0 GPa is around 921 K) to obtain an equilibrium liquid. Then, the system was quenched to 100 K at a cooling rate of 0.1 K/ps under a specific pressure. During these processes,all necessary information about the atoms in the system was recorded for the analysis at each selected temperature. Some specific configurations at temperatures of interest were collected,and some samples were allowed to relax to equilibrium under theNPT/NVT(constantN,constant volumeV,constantT)ensemble to analyze the dynamic properties.
2.3. Analysis methods
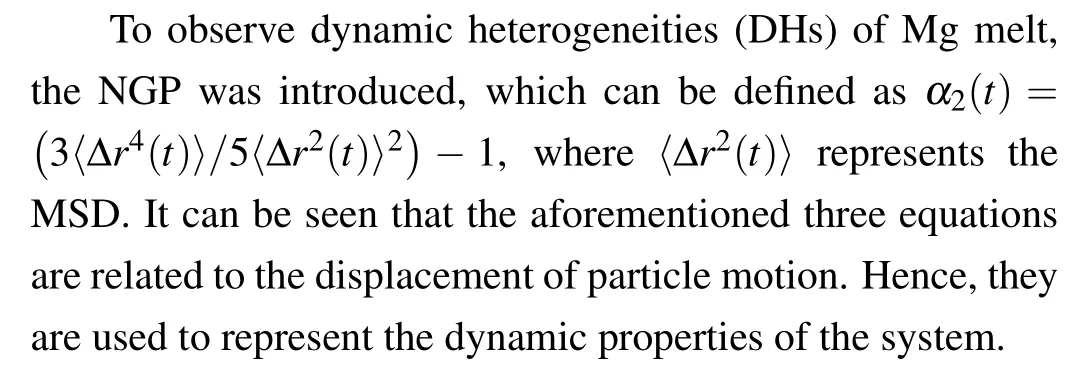
To investigate the dynamic properties of Mg melt, some common characterization methods were adopted, including mean-square displacement(MSD),the self-intermediate scattering function(SISFFs(q,t))and the non-Gaussian parameter(NGP).
MSD quantifies the average travel distance of the atoms in a given time in the system. It is defined as〈Δr2(t)〉=(1/N)∑Ni=1[ri(t)-ri(0)]2, whereNrepresents the particle number of the system andri(t) denotes the displacement of particleiin a timet.
The SISF(Fs(q,t))refers to the spatial Fourier transform of the van Hove function and describes the density fluctuation of the same atoms between timet=0 andt=t0,which can be used to reveal the molecular dynamics properties. It is defined asFs(q,t)=(1/N)∑Nj=1exp{[iq·[rj(t)-rj(0)]]}, whereNrefers to the number of atoms,qrepresents the wave vector andidenotes the imaginary unit.
To investigate the microstructural evolution of Mg during solidification,the PDF and CTIM for the system were adopted.The primary microstructural characteristics were checked by employing the PDF (g(r)), providing essential information about the structure.
The structural details were provided by the CTIM,as proposed by Liuet al.[32-36]and based on the work of Qi and Wang.[37]It can also be used to quantitatively describe almost all kinds of local clusters formed in a simulation system. In CTIM-3, the cluster is composed of a central atom and its surrounding bonded atoms, and is expressed by nine integer indices of (N,n1441,n1551,n1661,n1421,n1422,n1541,n1431,n1321),whereNrepresents the coordination number of the central atom and the following eight integers denote numbers of 1441, 1551, 1661, 1421, 1422, 1541, 1431, and 1321 H-A bond-types,respectively,by which the surrounding atoms are bonded with the central atom.[38]In the H-A bond-type index method,the four integers(i,j,k,l)are used to describe the local configurations of two atoms,whereiis 1 or 2,and indicates whether two atoms are bonded or not,respectively.jdenotes the number of atoms bonded with two atoms,krepresents the number of bonds amongjatoms andlis needed to distinguish between the configurations whose first three integers,ijk, are the same but whose atomic configurations are different.
Some important basic clusters are presented in Fig.2 using CTIM-3. The FCC, BCC and icosahedron (ICO) basic clusters can be expressed by (12 0 0 0 12 0 0 0 0), (14 6 0 8 0 0 0 0 0)and(12 0 12 0 0 0 0 0 0),respectively,as shown in Figs.2(a)-2(c).
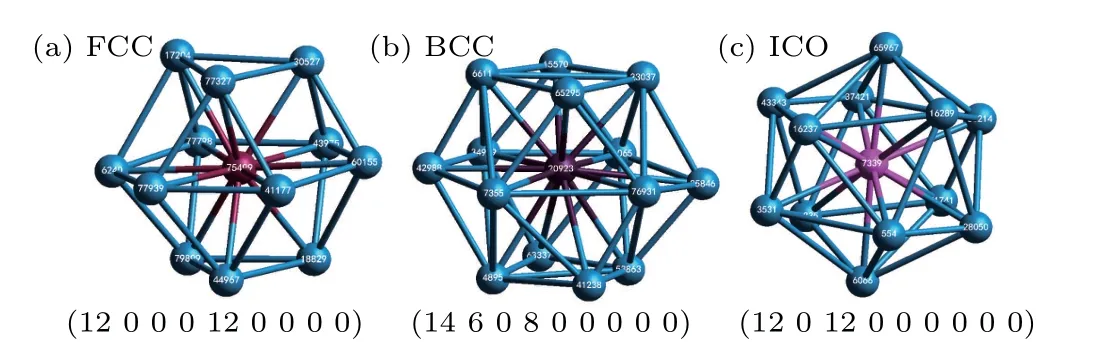
Fig.2. Three basic clusters of a system: (a)FCC basic cluster(12 0 0 0 12 0 0 0 0)with a center atom of 75499;(b)BCC basic cluster(14 6 0 8 0 0 0 0 0)with a center atom of 20923;(c)ICO basic cluster(12 0 12 0 0 0 0 0 0)with a center atom of 7339.
3. Results and discussion
3.1. Effect of pressure on Mg melt
3.1.1. Static structural characterizations
Different liquid structures often lead to different final state structures during the solidification process. Firstly, the effect of pressure on the structure of Mg melt was investigated using the PDF.
As a one-dimensional statistical method for structural characterization,the PDF can identify crystalline,amorphous and liquid structures by the shape and position of peaks. Figure 3(a) shows theg(r) curves of Mg melt at 1200 K under different pressures. The effect of pressure on the melt structure can be clearly seen from theg(r)curves. There are no divided or sharp peaks in theg(r)curves,indicating the absence of both amorphous and crystalline structures in the Mg melt.With the increase in pressure, it can be seen that the change ing(r)is somewhat similar to the temperature drop during solidification, i.e., the peak position moves to the left and the second and third peaks become more obvious, implying that the atomic arrangement becomes denser.
Meanwhile, the second peak is broadened and split, indicating that the increase in pressure is caused the emergence of a partial medium-range order(MRO)structure in the system.[15]In order to further clarify the structural changes,figure 3(b)presents the changes of normalizedrvalues(rnorm)of the first, second and third peaks with pressure. Thernormof three peaks decreased with the increase of pressure,which corresponds to the peak movement in Fig. 3(a). In the pressure range of 0 GPa to 7.5 GPa, the change ofrnormis high,whereas the change inrnormremains almost linear in the range of 10 GPa to 20 GPa. Compared with the change in the first peak associated with the short-range order (SRO), the positional change of the second and third peaks, which are associated with the MRO, is more obvious, indicating that the increase in pressure results in a more compact arrangement of atoms with a significant influence on the MRO structure.These phenomena indicate that densification of the first and second shells decreased with increasing pressure, especially the second shells associated with MRO. In general, this behavior may be related to system compressibility.
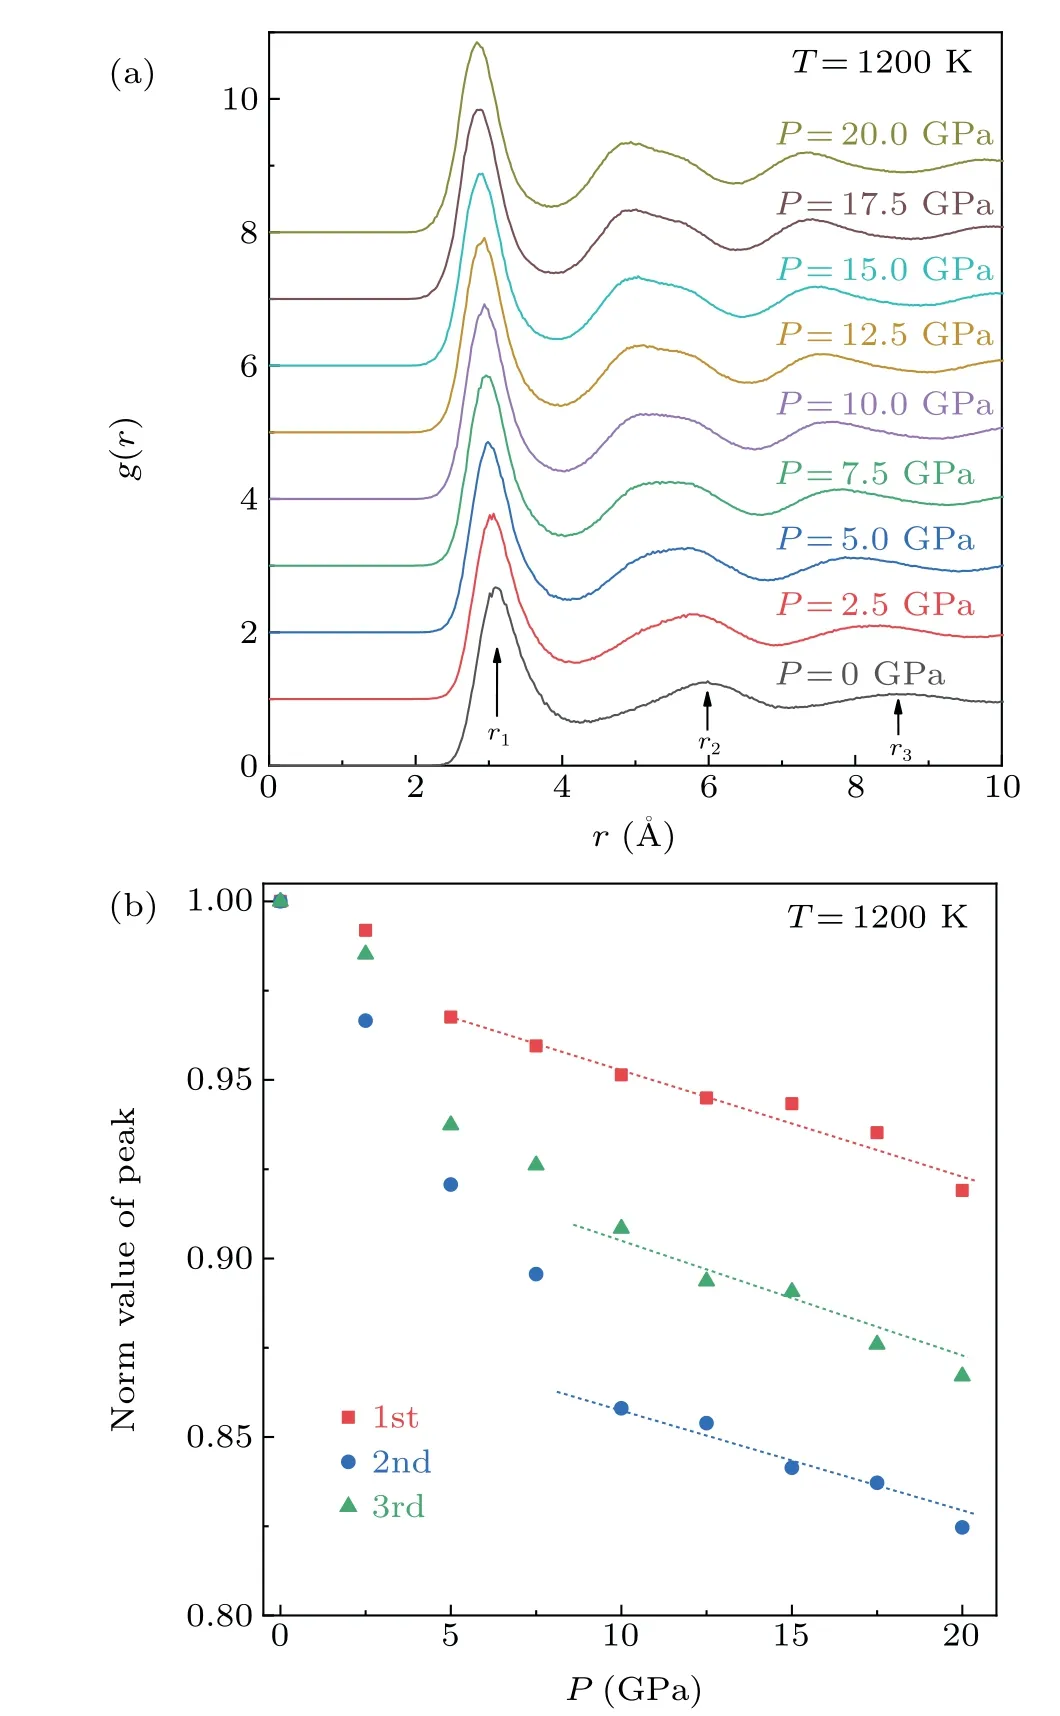
Fig.3. (a)The PDF of Mg melt at 1200 K under different pressures. (b)Corresponding normalized r values (rnorm) of the first, second and third peaks under different pressures.
3.1.2. Average dynamics and dynamic heterogeneities
The application of pressure during solidification results in a change in the local structure, which is accompanied by a change in the dynamic behavior of the system. Herein, we present the effect of pressure on average dynamics and DHs of Mg melt,including the characterization of MSD,SISF and NGP.
The MSD of atoms represents the capacity of atoms to move, namely, the displacement of atoms in a certain time interval. The capability of atoms to move tends to decrease with decreasing temperature or increasing external pressure.Figures 4(a) and 4(b) present the MSD of the system at different pressures (0, 5, 10, 15, and 20 GPa @ 1200 K) and different temperatures (800, 900, 1000, 1100, and 1200 K@10 GPa), respectively. It can be seen that atomic displacement with time experiences three stages. In the initial stage,MSD is proportional tot2; this is called the ballistic movement stage, in which atoms are free to move without being affected by nearby atoms. After ballistic motion,a small platform appears on the MSD curve, indicating the presence of the cage effect;[39]this is called the localized movement stage.The longer platform length corresponds to the higher level of difficulty in topological excitation.
As shown in Figs. 4(a) and 4(b), the MSD platform becomes longer with increasing pressure or decreasing temperature,respectively.One should note that the decrease in temperature leads to a decrease in thermal energy and an increase in pressure results in an increase in activation energy and hindering of topological excitation. With increasing time,the atomic bonds are broken and atoms eventually diffuse into the bulk.At this stage,MSD becomes proportional totand this stage is referred to as the diffusion movement stage.
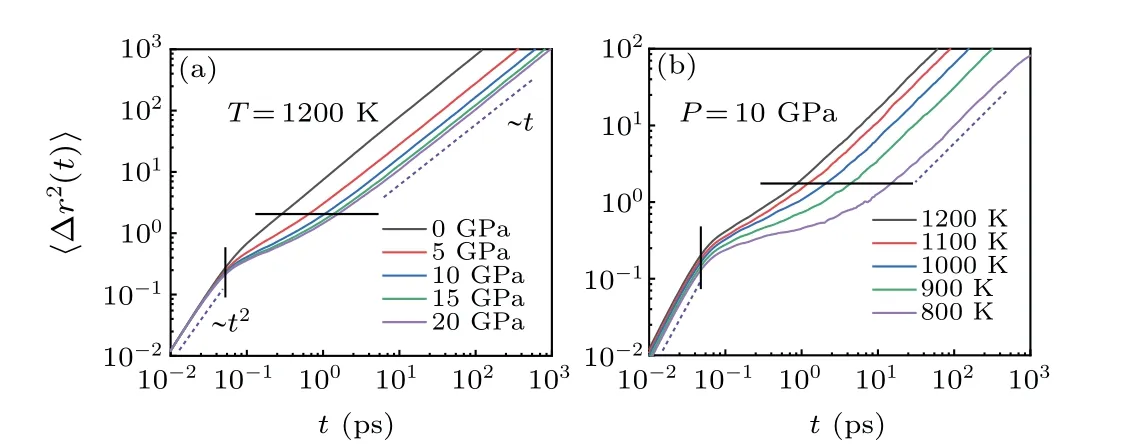
Fig.4. The mean-square displacement of Mg melt at(a)different pressures(0, 5, 10, 15, and 20 GPa @ 1200 K) and (b) different temperatures (800,900,1000,1100,and 1200 K@10 GPa).
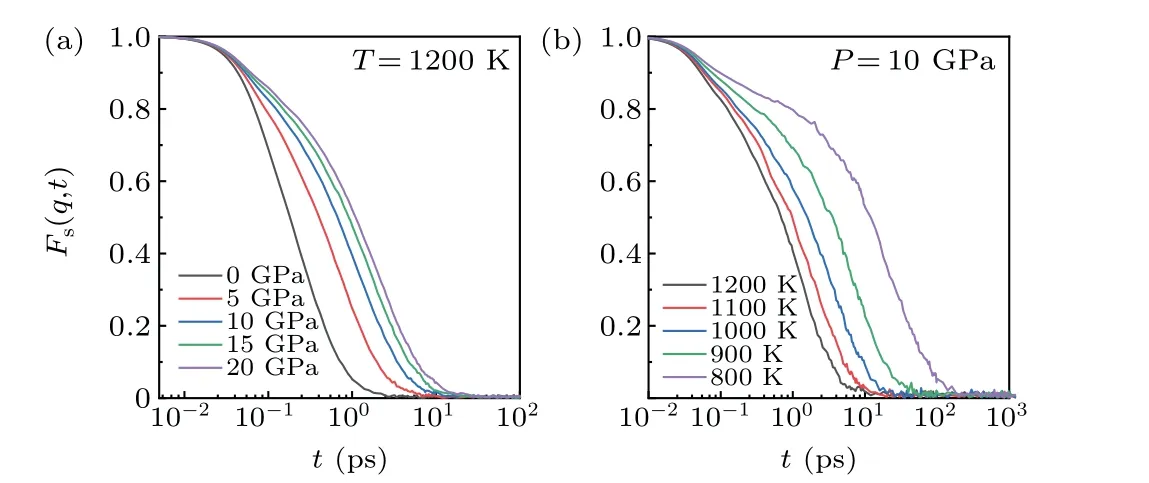
Fig.5. The self-intermediate scattering function of Mg melt under(a)different pressures(1200 K)and(b)different temperatures(10 GPa).
SISF can be used to characterize the dramatic slowdown and structural relaxation. A two-step relaxation behavior was found at a certain temperature and pressure,as shown in Fig.5.Consistent with the MSD results,the pressure did not have any influence on the short ballistic movement, whereas the temperature did. Hence, the pressure increased the atomic compactness without exerting any influence on the thermal motion. Also, the dynamics gradually slowed down with the decrease of temperature and increase of pressure. Similar to MSD, there were three movement regions: ballistic motion,localized motion and diffusion motion. Both decrease in temperature and increase in pressure slowed down the dynamics of Mg melt; however, the influence of temperature was more obvious than that of pressure. At the same temperature, the variation of SISF gradually slowed down with the increase of pressure.At the same pressure,the variation of SISF gradually increased with decreasing temperature. Therefore,the cooling rate should be preferentially controlled to tune the crystallization behavior.
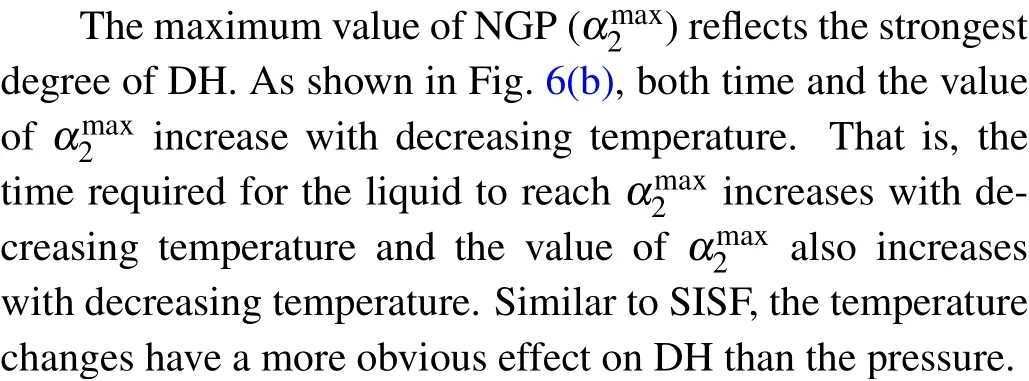
If the movement of particles in an isotropic liquid is uniform,the MSD of particles is always proportional to the time,and the set of displacements of different particles,corresponding to the same period, is in accordance with the Gaussian distribution. However, the movement of particles in the melt is limited to different degrees due to the different effects of surrounding particles. Hence,the displacement of particles in the melt no longer conforms to the Gaussian distribution, reflecting the DHs of the particles in the liquid. The NGP was used to reveal the heterogeneities of particle motion,as shown in Fig.6. The peak value ofα2(t)and the corresponding time scale are seen to increase with increase in pressure,indicating that the DHs increase with increasing pressure.
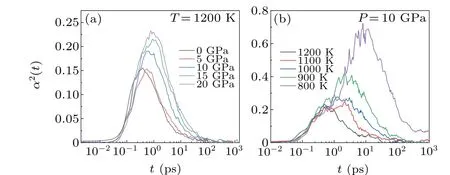
Fig.6.The non-Gaussian parameters of Mg melt under(a)different pressures(1200 K)and(b)different temperatures(10 GPa).
3.2. Effect of pressure on crystallization behavior of Mg
In the melt state, the pressure has a significant influence on matrix structure and atomic dynamics. Herein, the microstructural evolution during the crystallization process is studied in detail to better understand the influence of these changes on the crystallization behavior of Mg.
3.2.1. Structural evolution during solidification
To understand the crystallization behavior of Mg under different pressures in depth, the evolution of major clusters in the system under different pressures is shown in Fig. 7.It was found that Mg exhibited completely different crystallization pathways during solidification under different pressures. When the pressure was zero,a BCC intermediate phase was formed during the solidification process and finally transformed into a HCP-dominated crystal structure. When the pressure was increased to 5 GPa,there was also a BCC intermediate phase during the solidification process, but the final system was dominated by FCC crystal structure. Interestingly,with a further increase in pressure,BCC,HCP and FCC structures became almost invisible, and ICO and Z14 (14 0 12 2 0 0 0 0 0) cluster structures occurred. Finally, the relative proportion of ICO+Z14 exceeded 50% under a pressure of 20 GPa. In general, the density of a system increases with increase in pressure. The ICO+Z14 clusters were, however,obtained with a lower arrangement density than FCC and HCP under a pressure of 20 GPa. These findings should be further investigated in detail.
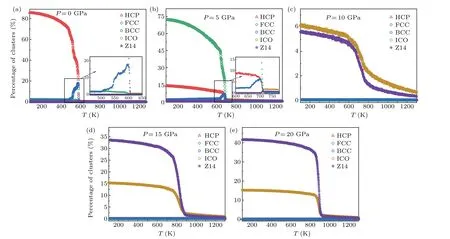
Fig.7. Microstructural evolution of major clusters in the system under different pressures.
3.2.2. Three-dimensional atomic snapshot
Although the statistical results for the basic crystal clusters were analyzed by CTIM, as mentioned earlier, the final atomic structures at 100 K under different pressures are shown in Fig.8 to intuitively observe the spatial distributions of clusters. The final crystal structure of each system can be clearly distinguished using 3D visual analysis. At 0 GPa, the final structure is dominated by the red-colored HCP atoms,whereas a small proportion of BCC,FCC and defective atoms are observed. When the pressure is increased to 5 GPa, the final structure is dominated by the green-colored FCC atoms,whereas a small number of HCP and other defective atoms are also observed.
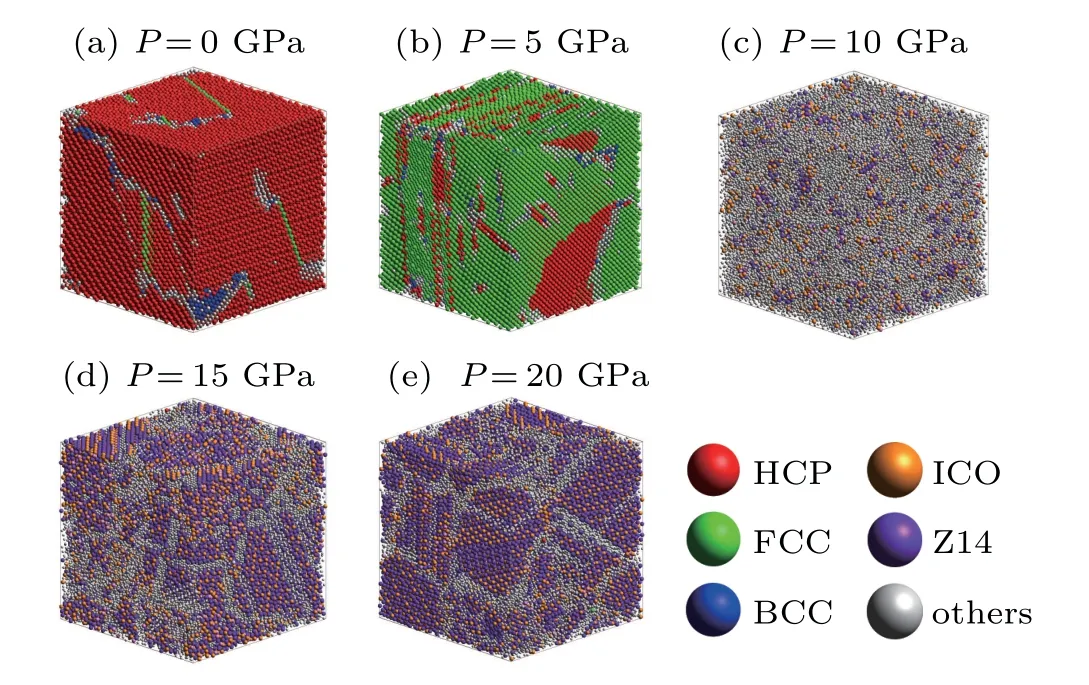
Fig.8. The final atomic structures at 100 K under different pressures,where the red, green, blue, orange, purple and gray spheres represent HCP, FCC,BCC,ICO,Z14 and other atoms,respectively.
At a pressure of 10 GPa,three kinds of major crystal clusters can hardly be seen in the system. At this time,the system is dominated by amorphous clusters. With a further increase of pressure to 20 GPa, three crystal structures are almost invisible in the system,and the orange-colored ICO and purplecolored Z14 atoms are mainly observed.In general,when ICO and Z14 are separated they do not form crystal clusters. After further extraction and observation, it was found that the ICO and Z14 intersected to form a complex crystal phase,A15,as shown in Fig.9.
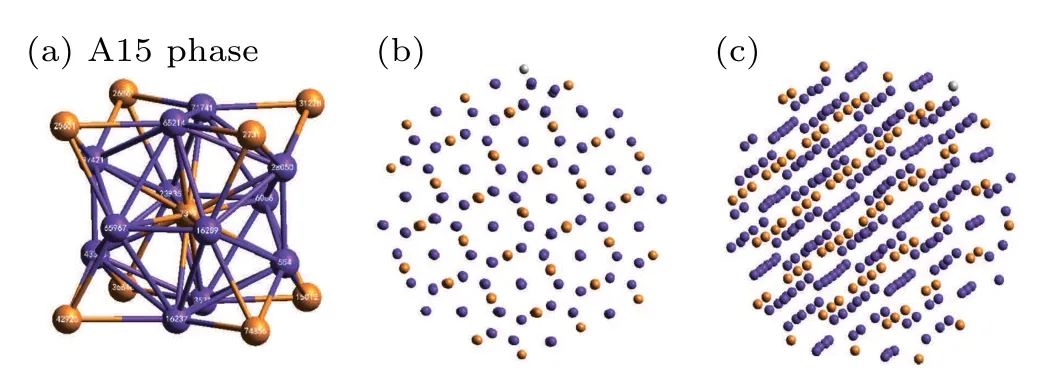
Fig.9. Details of the A15 complex crystal phase: (a)A15 unit cell; (b),(c)A15 phase when viewed from different directions in the system, where the orange and purple spheres represent ICO and Z14 atoms,respectively.
By analyzing the A15 unit cell in Fig. 9(a), we can demonstrate that the A15 phase in metallic Mg consists of ICO and Z14 cluster atoms with an atomic ratio of 1:3. Meanwhile, Figs. 9(b) and 9(c) show the arrangement of atoms in the A15 phase when viewed from different directions. It can be clearly seen that A15 is a crystal structure. The A15 phase has previously been found in both Zr and Ta under medium and high pressures,[40,41]but there are few reports on the A15 phase of Mg. Based on CTIM evolution and 3D visualization analysis,it is concluded that pressure plays an important role in the crystallization pathways and polymorph selection of Mg. However,the mechanism of these obvious distinctions remained unclear.
3.2.3. Phonon vibration spectra
Several studies have focused on finding the most stable Mg phase under extreme conditions and have found that the most stable phase of Mg at low pressures is the HCP phase while the most stable phase at ultra-high pressures is the BCC phase.[42]However, a few studies have focused on the stability of the metastable phase. The phonon vibration spectra can directly reflect the interaction of atoms with each other,which is the basis of the thermodynamic properties of solid materials and can be used to assess the stability of different structures. Considering that the free energy of phases is adjustable by pressure, the phonon vibration behavior of four phases of Mg (HCP, FCC, BCC and A15) was calculated under ambient pressure using first-principles phonon calculations, based on the VASP package,[43]as shown in Fig.10. The existence of an imaginary frequency (<0) in phonon spectra indicates that the structure is thermodynamically unstable. There was no imaginary frequency in the most stable HCP phase under 0,5,and 20 GPa,as shown in Figs.10(a1)-10(a3). Also,there was no imaginary frequency in the metastable FCC phase under 0,5 and 20 GPa,as shown in Figs.10(b1)-10(b3). However, the BCC structure of Mg was unstable in the pressure range of 0 GPa to 20 GPa,which was indicated by the obvious imaginary frequencies,as shown by the red-colored circles in Figs.10(c1)-10(c3). Thus,both HCP and FCC phases are stable with change in pressure. Nevertheless, the BCC phase is always unstable in the pressure range of 0 GPa to 20 GPa.
In particular,the A15 phase was unstable under 0 GPa but stable under 5 GPa and 20 GPa. With the increase in pressure,the imaginary frequency of the BCC phase was weakened and the imaginary frequency of the A15 phase disappeared. This scenario indicates that high pressure could indeed change the phase stability of Mg,affecting polymorph selection of Mg.
3.3. Discussion
Crystallization is a dynamic process that takes place under certain thermodynamic conditions, such as temperature,pressure and free energy. In general, thermodynamic conditions are global and necessary for crystallization (phase transition). For instance, crystallization cannot occur at a given pressure until the temperature drops toTm. Dynamic conditions, for example movement and collision of atoms, usually act on the local scale,altering the local criticalities and affecting the global properties. For instance, the time and location of the formation of a critical crystal nucleus may vary in different cases. Thus,the properties determined by thermodynamic conditions are usually deterministic while the properties determined by dynamical factors exhibit a certain randomness.
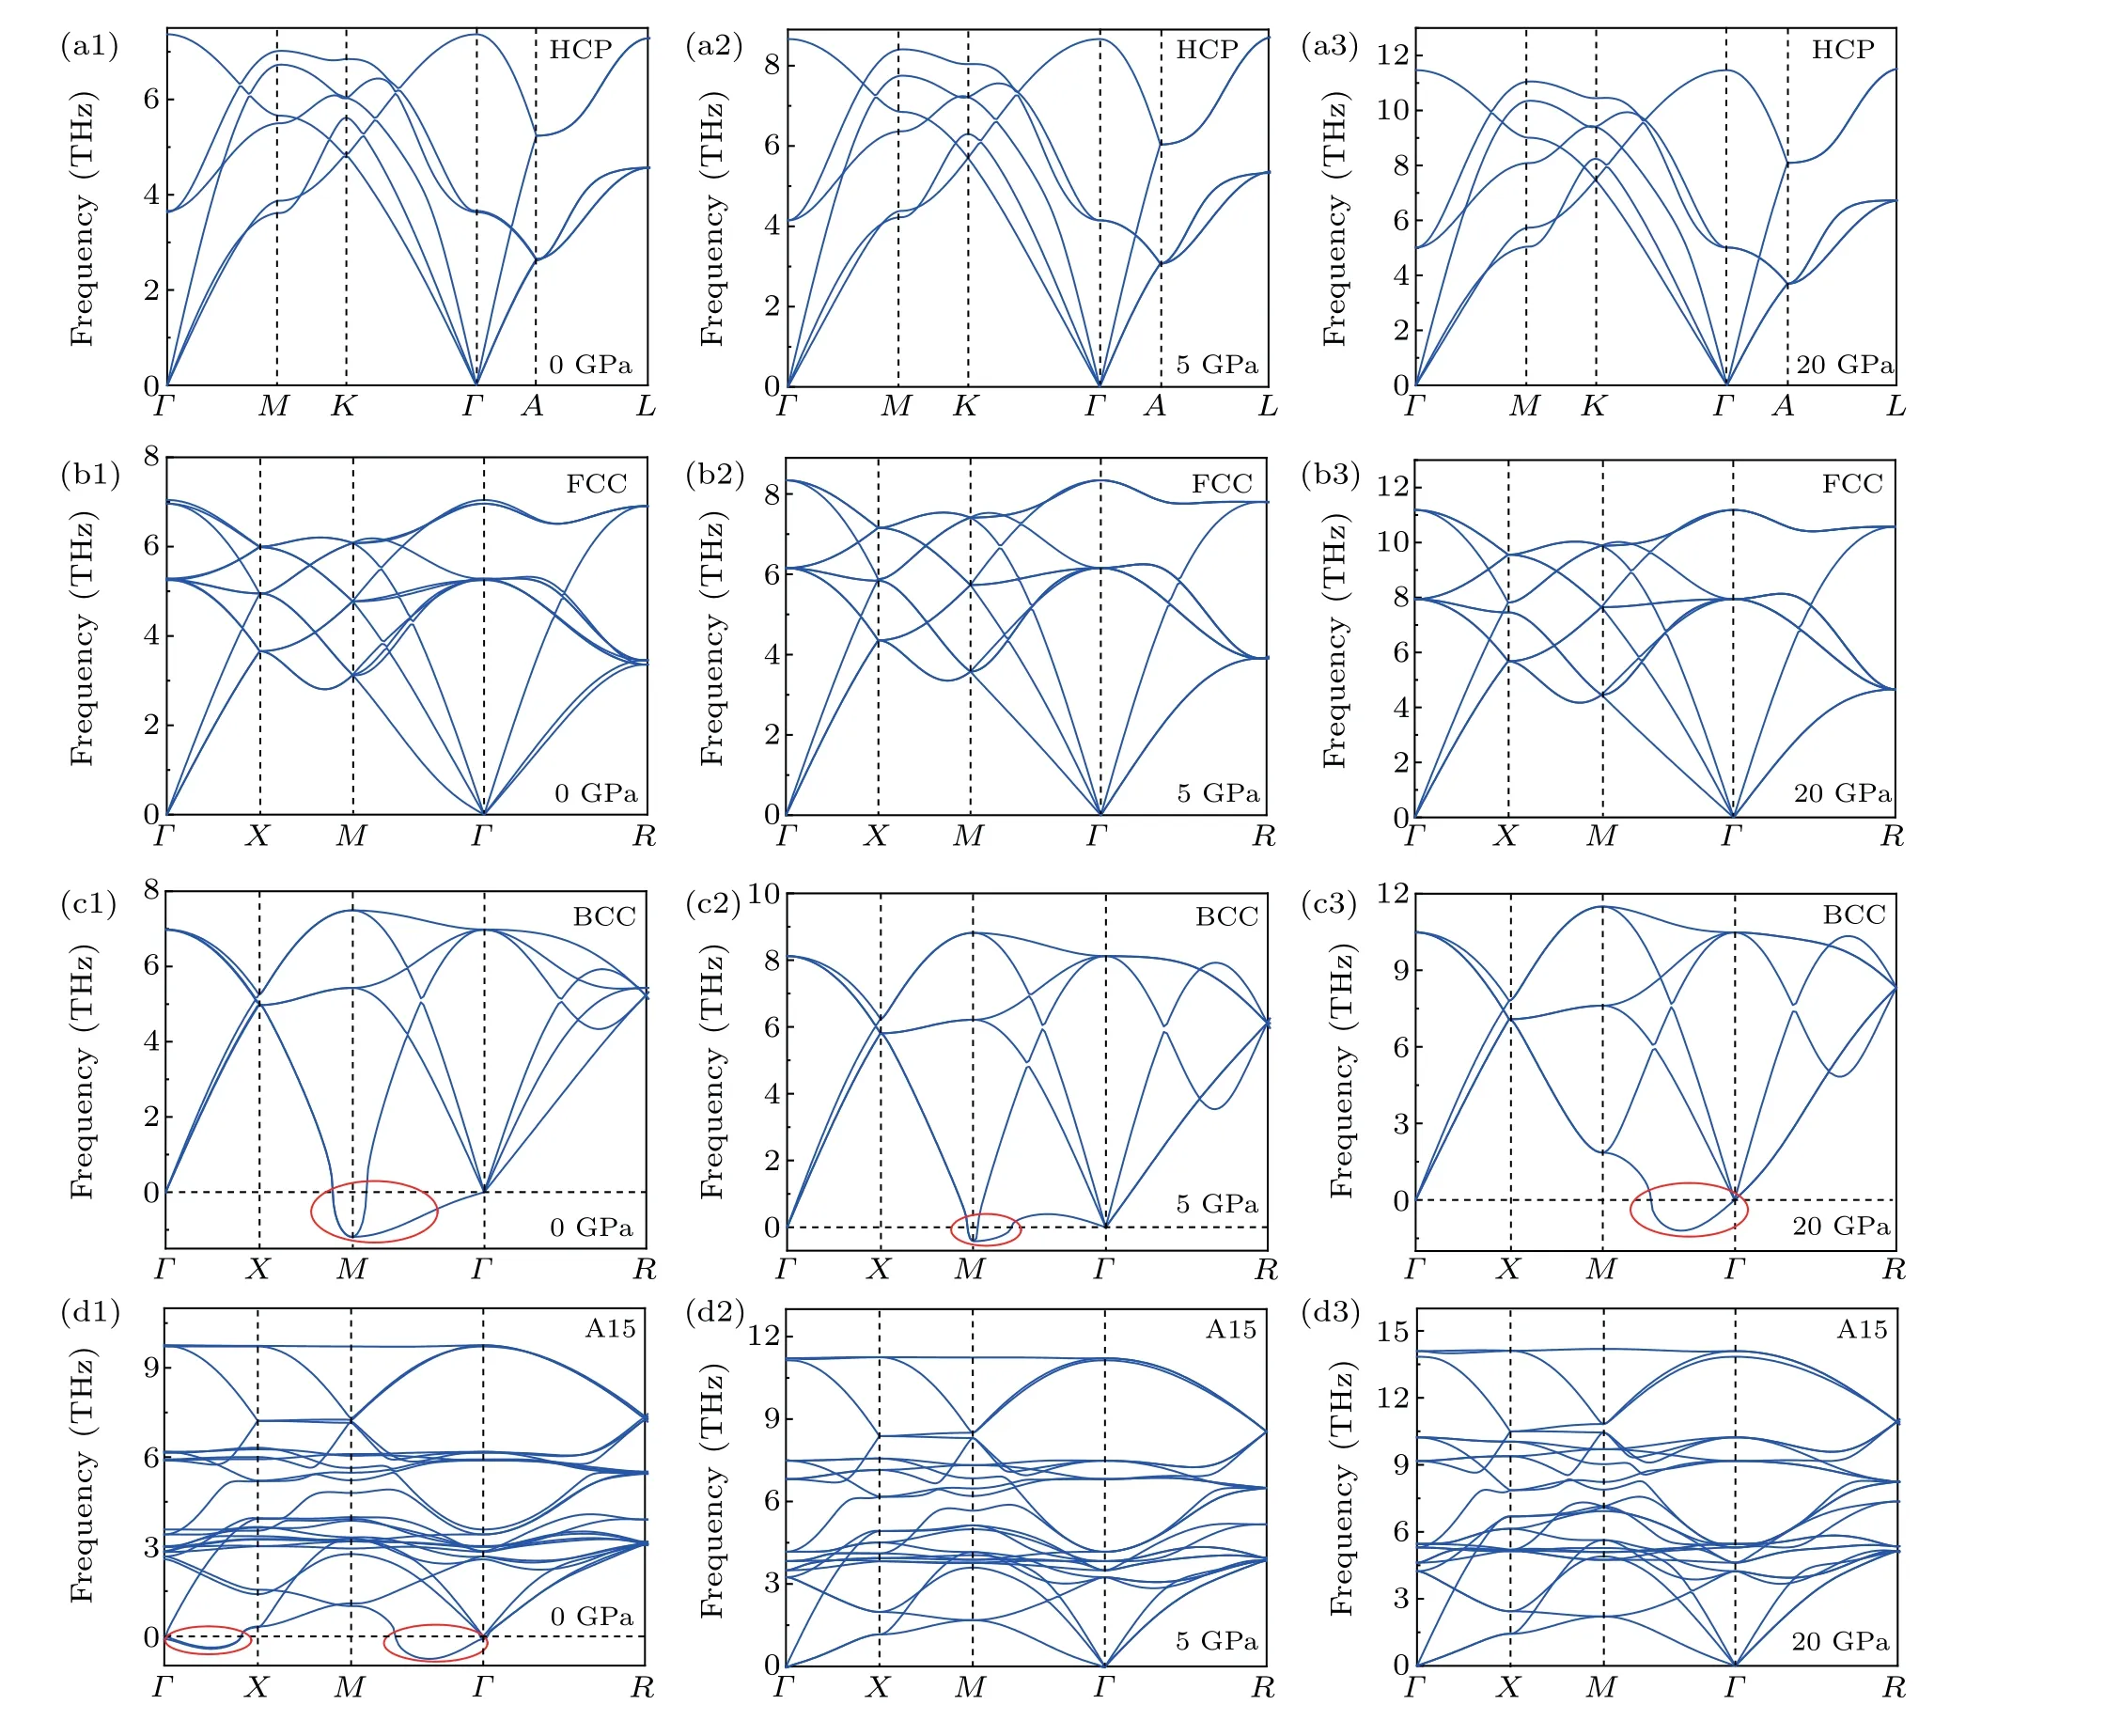
Fig.10. The vibration behaviors of Mg at ambient pressure,showing the phonon dispersion of Mg in the HCP phase(a),FCC phase(b),BCC phase(c)and A15 phase(d).
During the crystallization of Mg under different pressures, our results reveal that the dynamic properties of Mg melt change greatly with an increase in pressure at the same temperature. Also,the atomic movement is limited with an increase in pressure.Meanwhile,DHs are increased,resulting in local groups having more chances to form some random cluster structures, and the declining ability of the atoms to move hinders the local phase change. Thus,some structures are difficult to change after formation, for example the A15 phase was formed under 20 GPa. Second, the pressure changes the distribution of the potential energy surface of the free energy.As the BCC phase is always thermodynamically unstable at low pressure, the BCC phase either occasionally occurs during crystallization and eventually transforms into a more stable phase(for example HCP and FCC are the final structures under 0 GPa and 5 GPa,respectively)or it is almost absent during crystallization(for example there are almost no BCC clusters formed in the crystallization process of Mg under 10 GPa-20 GPa). In the low-pressure range, the HCP phase is more thermodynamically stable than the FCC phase.[42]However,FCC becomes the main crystal structure under 5 GPa with the change of pressure due to the changes in the dynamics of Mg during the rapid solidification process. Similarly, in the case of the A15 phase, the pressure actually changes the thermodynamic conditions of Mg by altering the interatomic distance and bonding pattern of the material,[18]triggering the formation of an A15 basin on the free energy surface. Consequently,we observed the formation of more of the A15 phase at 20 GPa and finally retained it.
Herein, it can be seen that pressure changes the thermodynamic conditions of crystallization,thus affecting the polymorph selection of Mg. The phase that eventually emerges during solidification is not necessarily to be the most stable(lowest energy) phase, but it has to be thermodynamically stable.[44]That is to say,the properties determined by thermodynamic conditions are usually deterministic,while the properties determined by dynamical factors exhibit a certain randomness. Polymorph selection of Mg has been a challenging subject and it is difficult for us to obtain some metastable phases of Mg by only changing the cooling rate. These findings not only reveal the thermodynamic mechanism of phase selection,but also provide a novel approach for industrial and metallurgical applications, i.e. the stability of the metastable phase can be tuned to obtain the desired phase.
4. Conclusion
In summary, to predict polymorph selection of Mg, MD simulations have been adopted to explore the effect of pressure on the microstructure and dynamic properties of liquid Mg during rapid solidification. The PDF, CTIM-3 and some statistical methods were utilized to reveal the structural and dynamic characteristics of Mg.The following conclusions can be drawn from current results:
(i) Under compression, the overall structure of Mg became dense.The results of MSD,SISF and NGP demonstrated that the dynamics of Mg melt slowed down sharply under pressure.A higher pressure enhanced the dynamic heterogeneities,which had a significant influence on the crystallization pathways of Mg.
(ii)The microstructural evolution during the solidification process under different pressures was analyzed by CTIM-3.The results revealed that pressure had an important influence on the polymorph selection of metallic Mg.At 0 GPa,the main structure was HCP;at 5 GPa,the main structure was FCC;atP ≥10 GPa, the main structure was A15 phase, which consisted of ICO and Z14 clusters with an atomic ratio of 1:3.The proportion of A15 phase gradually increased and became dominant. With an increase in pressure,the microstructure of Mg transitioned from HCP to the A15 complex crystal phase structure.
(iii) The phonon vibration behavior of Mg, including HCP, FCC, BCC and A15 phases, was calculated by the first principles phonon calculations. The results revealed that the BCC structure of Mg was unstable at a pressure of 0, 5, and 20 GPa. The A15 structure of Mg was unstable under 0 GPa,but became stable under 5 GPa and 20 GPa. These findings indicated that the increase in pressure could indeed alter the phase stability of Mg, thus affecting the polymorph selection of Mg.
Acknowledgment
Project supported by the National Key Research and Development Program of China(Grant No.2017YFGX090043).
猜你喜欢
杂志排行

Chinese Physics B的其它文章
- Superconductivity in octagraphene
- Soliton molecules and asymmetric solitons of the extended Lax equation via velocity resonance
- Theoretical study of(e,2e)triple differential cross sections of pyrimidine and tetrahydrofurfuryl alcohol molecules using multi-center distorted-wave method
- Protection of entanglement between two V-atoms in a multi-cavity coupling system
- Semi-quantum private comparison protocol of size relation with d-dimensional GHZ states
- Probing the magnetization switching with in-plane magnetic anisotropy through field-modified magnetoresistance measurement