A calculation model for breakdown time delay and jitter of gas switches under hundred-nanosecond pulses and its application in a self-triggered pre-ionized switch
2021-11-30TianchiWANG王天驰HaiyangWANG王海洋WeiCHEN陈伟YingchaoDU杜应超LinshenXIE谢霖燊TaoHUANG黄涛ZhiqiangCHEN陈志强JunnaLI李俊娜FanGUO郭帆andGangWU吴刚
Tianchi WANG (王天驰), Haiyang WANG (王海洋), Wei CHEN (陈伟),Yingchao DU (杜应超), Linshen XIE (谢霖燊), Tao HUANG (黄涛),Zhiqiang CHEN (陈志强), Junna LI (李俊娜), Fan GUO (郭帆) and Gang WU (吴刚)
1 Key Laboratory of Particle & Radiation Imaging (Tsinghua University), Ministry of Education, Beijing 100084, People’s Republic of China
2 Department of Engineering Physics, Tsinghua University, Beijing 100084, People’s Republic of China
3 State Key Laboratory of Intense Pulsed Radiation Simulation and Effect, Xi’an 710024, People’s Republic of China
4 State Key Laboratory of Electrical Insulation and Power Equipment, Xi’an Jiaotong University, Xi’an 710049, People’s Republic of China
Abstract In this paper, a calculation model for the breakdown time delay and jitter of gas switches under hundred-nanosecond pulses is proposed and applied in a self-triggered pre-ionized switch.The effects of injection time of pre-ionization,pulse rise time,and the pre-ionization jitter are discussed and verified through experiments.It indicates that the pre-ionization should be injected when the electric field is high enough in the gap,injection after 80%peak-time can ensure its effectiveness.Then the statistical time delay jitter will be determined by the pre-ionization jitter, which is an intrinsic restriction of the self-triggered switch.However, when the changing rate of the pulsed electric field exceeds a certain value, the breakdown time delay jitter can be partly offset in the formative stage because the formative time delay has an exponential relationship with the electric field.Therefore, lower time jitter can be obtained under pulses with a shorter pulse rise time.In general, the results of the calculation model agree with the experimental results, and the experimental parameters which lead to a low jitter can also be used as a reference.
Keywords: gas switch, nanosecond pulse, breakdown time delay, jitter, distribution model
Nomenclature
T0= 0 time that the voltage on the switch gap starts rising
Ttrtime that the trigger gap breaks down (preionization is injected)
Tstime that the first initial effective electron appears
Tbtime that the switch breaks down
td= Tb−T0switch’s breakdown time delay
tj= std(td) switch’s breakdown time delay jitter
ttr= Ttr−T0trigger gap’s breakdown time delay (time delay of pre-ionization)
tjtr= std(ttr) trigger gap’s breakdown time delay jitter(preionization jitter)
ts= Ts−T0switch’s statistical time delay
tjs= std(ts) switch’s statistical time delay jitter
tf= Tb−Tsswitch’s formative time delay
˙nej(t, Ttr) generating rate of initial electrons at the jth region
˙n0j(t) generating rate of initial electrons by natural radiation at the jth region
˙nfj(t) generating rate of initial electrons by field emission at the jth region
˙npj(t, Ttr) generating rate of initial electrons by preionization at the jth region
Ej(t) electric field strength at the jth region
p operating gas pressure of the switch
Sj(t) breakdown probability at the jth region (the probability that the breakdown will initiate at the jth region once there is an initial electron in that region)
Gj(t) number of initial electrons generated at the jth region
Fj(Ts) conditional cumulative distribution function of the statistical time delay at the jth region
Pjthe probability of something at the jth region
Y(Ttr) cumulative distribution function (CDF) of Ttr
YD(Ttr) probability density function (PDF) of Ttr
Hj(Ts, Ttr) joint cumulative distribution function of Tsand Ttrat the jth region
HDj(Ts, Ttr) joint probability density function of Tsand Ttrat the jth region
Bj(Ts) cumulative distribution function of Tsat the jth region
B(Ts) cumulative distribution function of Tsin the switch
BI(Ts) probability density function of Tsin the switch
du/dt rising speed of the pulsed voltage on the switch
E/p reduced electric field
Ubbreakdown voltage of the switch
Ujpercentage breakdown voltage jitter of the switch
Eselectric field of breakdown’s initiation
Neelectron density at the discharge region
vedrift velocity of electrons at the discharge region
αsphotoemission coefficient at the discharge region
γpphotoemission coefficient at the cathode surface
L the distance between two point
Ψ the angle between the straight line connecting a volume element of discharge area and an area element at the cathode surface and the normal direction of the area element at the cathode surface
μ absorption coefficient of photons in the background gas
1.Introduction
Large pulsed power drivers for Z-pinch facility [1] and electromagnetic pulse simulator [2] need superposition of multi primary pulses with the rise time of several hundred nanoseconds to output high voltage or high current fast pulses.MV low-jitter pulsed gas switches are the crucial components for energy transfer and pulse sharpening [3–6].MV laser-triggered switch’s time jitter can be less than 2 ns [3],and MV electrically-triggered switch’s time jitter can be less than 5 ns[4].However,both switches need external triggering sources, which add cost and complexity.Self-triggered preionized switches can reduce the jitter by introducing UVillumination [5, 6] or corona stabilization [7, 8].As the UVillumination is generated by spark discharge of a trigger gap,the self-triggering time is decided by the voltage division ratio between the main gap and the trigger gap [9, 10].While the self-triggering time jitter cannot be ignored like that in an external-triggering source, though optimal parameters can be obtained through qualitative analysis and experiments [11],there is still no semi-quantitative or quantitative model to analyze the influence factors and optimization principle of the self-triggered pre-ionized switch’s breakdown characteristics.
When multi pulses superposition is required, breakdown time delay jitter is more concerned.Though little research on the calculation model for pulsed breakdown time delay and jitter under hundred-nanosecond pulses was reported, the distribution model for DC or impulse charged gas gap’s breakdown voltage could be used for[12–17].A nanosecond spark switch’s breakdown time delay is composed of statistical time delay (ts), formative time delay (tf), and voltage collapse time delay [18–21].For a gas switch working under hundred-nanosecond pulses, voltage collapse time delay is related to the external circuit, and its jitter is relatively unimportant[22],and formative time delay(tf)is comparable to the statistical time delay (ts).
The statistical time delay(ts)is related to the spatial and temporal distribution of initial electrons and time-varying electric field [13–17, 23].Field emission is unlikely to be a source of initial electrons when the electrodes are mechanically polished and the working electric field is 30–140 kV cm−1[13, 14, 24–27].Photoelectrons generated by pre-ionization are related to the intensity and waveform of optical pulses.It is worth mentioning that the self-triggering time jitter (tjtr) might be much larger than the triggering source jitter in a laser-triggered or electric-triggered switch[28,29].Therefore,the triggering time jitter(tjtr)also contributes to the statistical time delay jitter (tjs).The formative time delay (tf) is influenced by the development process of electron avalanche, streamer, and gas heating,which is complex to numerically calculate, especially for a long gap.Empirical formulas indicate that tfis a function of electric field and gas pressure [30–33].Therefore, the time delay jitter of the switch(tj)might be smaller than that of the trigger gap (tjtr) due to the offset in the formative stage.
In this paper,a semi-quantitative calculation model of the pulsed breakdown time delay and jitter under hundrednanosecond pulses is established and applied in a self-triggered pre-ionized switch.The effects of injection time of preionization, input pulse rise time, and pre-ionization jitter are analyzed and verified through experiments.
2.Model and analysis
2.1.Calculation model of a gas switch’s breakdown time delay and jitter under hundred-nanosecond pulses
When the rise time of input pulses is several hundred nanoseconds, statistical time delay tsaccounts for a large portion of breakdown time delay td[10,19,30].Tsis the time that the first initial effective electron appears,which is related to both the number of initial electrons and the electric field strength[17, 23].To obtain the distribution function of Ts, the switch gap needs to be divided into regions of size n.For the convenience of analysis, we first assuming tjtr= 0 and the conditional cumulative distribution function of Tsat the jth region(Fj) can be derived.Supposing that at the jth region, the generating rate of initial electrons is ˙nej(t), the breakdown probability is Sj(Ej, p), the number of initial electrons generated in time interval dt is dGj(t), the (conditional) probability of the first initial electron’s appearance in dt is dFj(t),then we have


In dt, dFj(t) is the product of dGj(t) and the breakdown probability Sj(Ej,p)

Based on the conditional probability theory, the probability that the first initial effective electron appears during t and t+dt is

in equation (4), fj(t) = dFj(t)/dt is the derivative of Fj(t).Then we have

However,tjtris usually not much smaller than tjin a selftriggered switch.Therefore, Ttris also a variable.Assuming that the distribution function of Ttris known as

in equation (9), Y and YD are the CDF and PDF of Ttr,respectively.
For the sake of simplification, assuming that the difference of Ttrdoes not influence the shape and amplitude of ˙npj.
At the jth region, (Ts, Ttr) follows a joint distribution function Hj
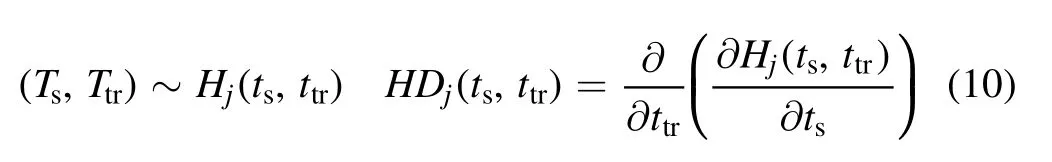
in equation (10), Hjand HDjare the joint CDF and PDF of(Ts, Ttr), respectively.
Then the conditional CDF Fj(Ts) is actually
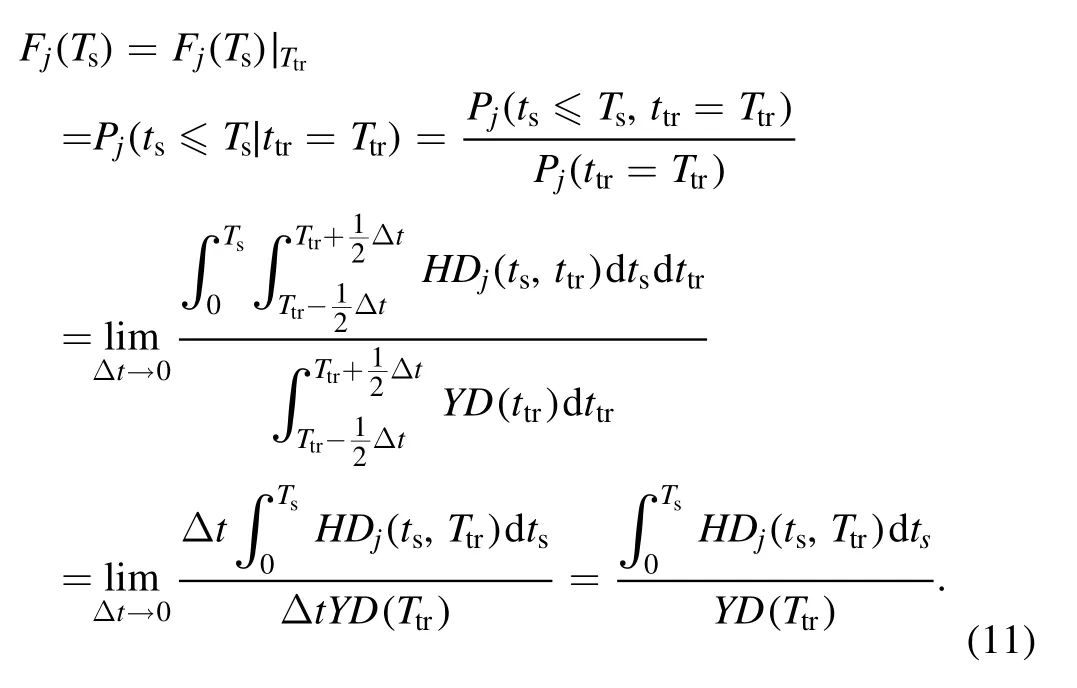
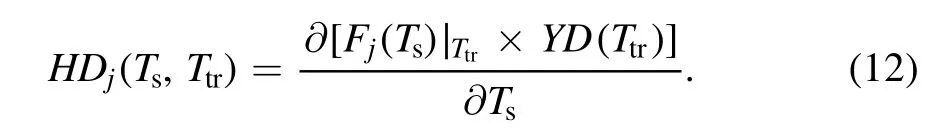
Then HDjcan be derived
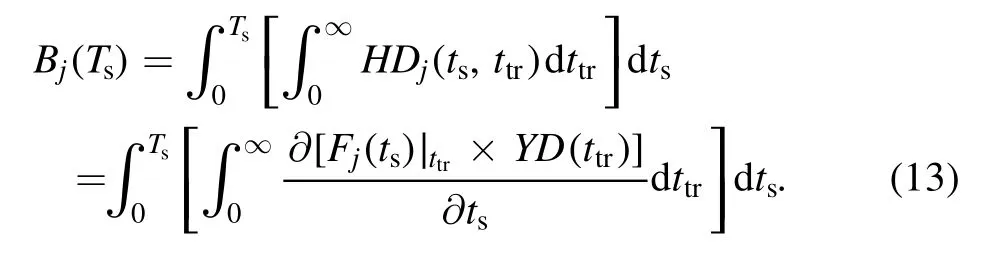
The unconditional marginal CDF of Tsat the jth region Bj(Ts) is
Considering that there are n regions in the switch gap,the cumulative probability that the first effective initial electron appears in the switch gap at t = Tsis
From equation(14)the CDF of Tsis obtained, the PDF of Tsis denoted as BI(Ts).
Because the formative time delay tffor a high pressure cm gap is difficult to calculate through analytical or numerical methods, Martin’s empirical formula (15) can be used when the breakdown time is from 0.5 ns to 10 μs and the average electric field is from 5 to 100 kV cm−1[30]
in formula (15), ρ is the gas density in g cm−3, tfis the formative time delay in second,E is the average electric field in kV cm−1[30].Under a pulsed electric field, E in formula(15) is set as the average electric field at t = Ts(E(Ts))[10, 19], so tf= tf(Ts) and Tb= Ts+ tf(Ts).
The expectation of Tb,Ts,and jitter of td,ts(tj,tjs)can be calculated as


Therefore, the mean value and 1 −σ jitter of the breakdown time delay can be obtained.
2.2.Analysis of influence factors of breakdown time delay and jitter of a self-triggered pre-ionized switch
The semi-quantitative analysis of the model in this paper is based on a self-triggered pre-ionized switch illustrated in figure 1.It consists of a main gap and a trigger gap.The trigger gap electrodes are fixed on the trigger plane, the trigger gap anode is connected with the trigger plane, while the trigger gap cathode is insulated from the trigger plane through a ceramic bushing.The main gap electrodes, the trigger plane, and the trigger gap anode are made of 304 stainless steel, while the trigger gap cathode is made of tungsten.The trigger gap distance is 1.5 mm, and the main gap distance is 7 cm.When a pulse voltage is applied to the switch,the trigger gap breaks down first,and initial electrons are generated in the main gap.
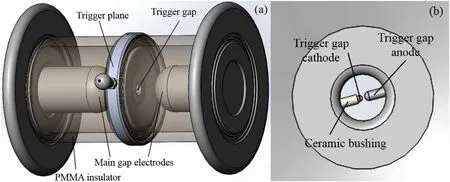
Figure 1.Schematic diagram of the switch, overall structure (a) and the trigger gap (b).
Figure 2 gives a simulation result of the electric field in the switch.The electric potentials on the cathode, trigger plane, and anode are set as −1000 kV, −500 kV, and 0 kV,respectively.The main gap electric field at the center of the trigger gap is only about 50 kV cm−1when the voltage on the main gap is 1 MV.In nitrogen,the breakdown voltage of the switch is lower than 300 kV per 0.1 MPa, so at the trigger gap,the main gap electric field is lower than 15 kV cm−1per 0.1 MPa (E/p is lower than 150 kV cm−1·MPa−1), the corresponding ionization coefficient α and drift velocity of electron veunder 0.1 MPa are smaller than 0.0083/cm and 0.58 cm/100 ns [34], respectively.The breakdown process is shorter than 200 ns, so the electrons in the spark channel of the trigger gap are unlikely to initiate the breakdown of the main gap.The first ionization energy of nitrogen is about 15.5 eV,which is much higher than the energy of UV photons generated by trigger gap discharge (3.1–3.9 eV) [11, 18].So the initial electrons can neither be generated by photoionization near the trigger gap.Therefore,it is most likely that the initial electrons are generated by the photoemission at the cathode surface.
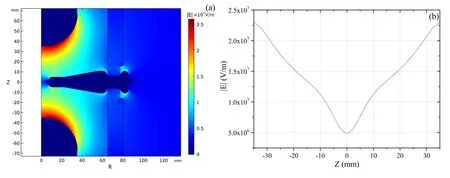
Figure 2.Electric field distribution in the switch (a) and at R = 0 (b).
2.2.1.Initial electrons.As equation (1) indicates, at region j,the initial electrons might be generated through natural radiation, field emission, and external pre-ionization.
The expectation of initial electrons generated by natural radiation is [13, 14]
in equation(20),D = 8.6 × 10⁻¹²J kg−1·s−1is the atmosphere absorbed dose rate for γ-ray [13, 14], ρ0= 1.25 g l−1is the density of nitrogen at atmosphere pressure,En= 34.6 ± 0.3 eV is the average ionization energy of nitrogen, p is the operating gas pressure, V = 320.7 cm3is the volume of the switch gap,and p0is the standard atmosphere pressure.The value of λ is about 614.6 s−1at p = p0.Considering the time scale of the breakdown process,the expectation of initial electrons generated by natural radiation in 200 ns is only 1.23 × 10⁻⁴,so the initial electrons generated by natural radiation can be neglected.
The field emission current can be calculated by Fowler–Nordheim formula (21) [35]

in equation (21), J is the density of field emission current in A cm−2, φ is the work function of the cathode material (for stainless steel,φ = 4.48 eV),E is the electric field strength in V cm−1.Generally, E should be 104–105kV cm−1to bring about an effective field emission [36].However, the maximum macro electric field at the cathode surface is only about 230 kV cm−1.Considering the micro protrusion at the cathode surface, the micro electric field at the protrusion Emicrois

in equation (22) βmis the micro field enhancement factor determined by the height h and radius r of the protrusion.
Figure 3 is a typical profile of the cathode surface scanned by an optical profilometer (NANOVEA ST400), it indicates that the maximum h/r of the protrusions is about 3(h ≈ 45 μm,r ≈ 15 μm).Berger[26]and Luo[13]has found that βmat the top of a protrusion is less than 10 when h/r is less than 5.When E = 230 kV cm−1and βm= 10, J is only about 2.4 × 10−109A cm−2,so the initial electrons generated by field emission can also be neglected.
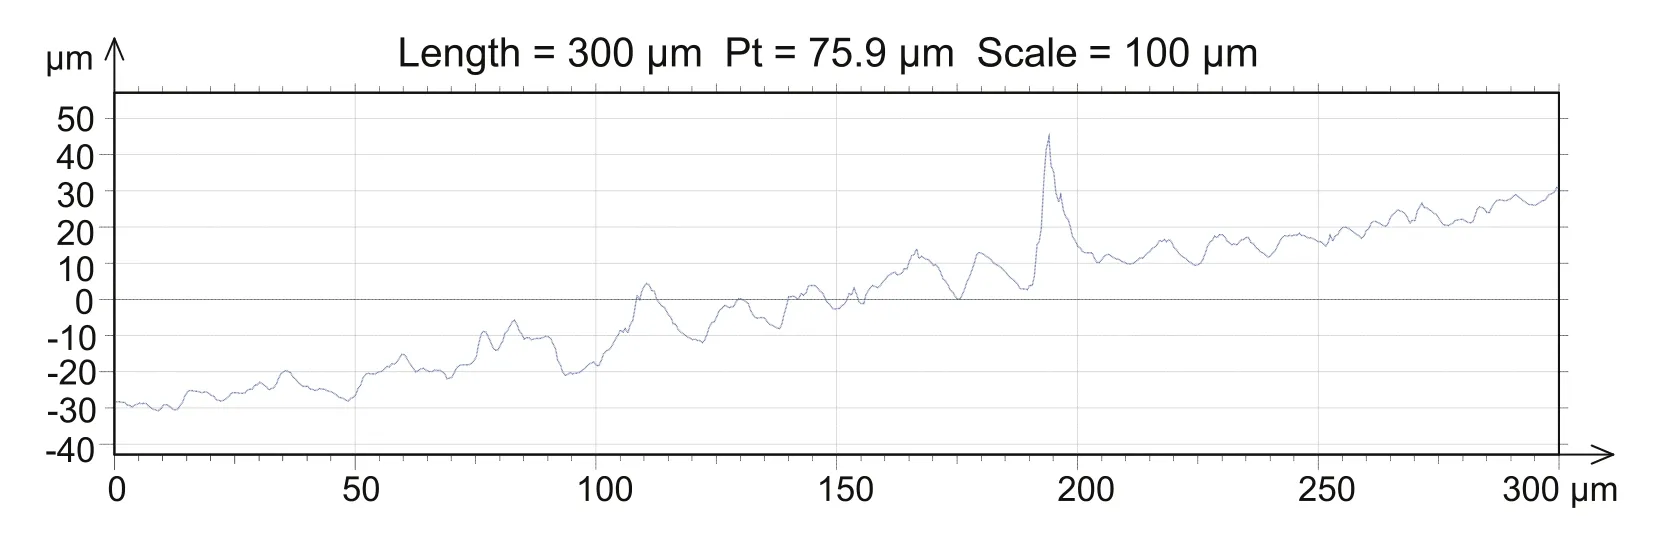
Figure 3.A typical profile of the cathode surface.
Therefore, the initial electrons are the photoelectrons generated by UV-illumination at the cathode.The excitation and de-excitation of nitrogen molecules will produce photons[37].The wavelengths of UV photons generated by the discharge of the trigger gap are mainly 337 nm and 357 nm[11, 18].However, it is difficult to figure out the distribution of initial electrons by the spectrum diagnosis.Instead, a supposed photoemission coefficient can be adopted for semiquantitative analysis.
Figure 4 is a schematic diagram of the photoemission process [33].Assuming that V1is a small volume element in the discharge area of the trigger gap, the number of the photons emitted from V1in time interval dt is

Figure 4.Photoemission at the cathode surface due to a discharge volume.
in expression (23), Neis the electron density, αsis the photoemission coefficient,veis the drift velocity of electrons,subscript 1 means the parameters are calculated in volume V1[33].
Assuming that dA2is a small area element at the cathode surface, the number of photons that arrives at dA2is

in expression(24),L12is the straight-line distance between V1and dA2, μ is the absorption coefficient, and Ψ12is the angle between L12and the normal direction of dA2[33].
Assuming that γpis the photoemission coefficient at the cathode surface,the number of electrons released from dA2in dt is
Figure 5 exhibits a simplified area division model at the cathode surface.First, assuming that the discharge area is a homogeneous cylinder whose radius and length are rdand ld= 1.5 mm, respectively.The discharge volume of the trigger gap V0is much smaller than the discharge volume of the main gap, so it can be supposed that photons are emitted from the origin (0, 0) in figure 5.Considering the structure parameters and time jitter of the trigger gap,the multi-channel discharge condition can be neglected [38], so rdcan be calculated as [39–42]
Figure 5.The area division at the cathode surface.
in equation (26) ρ is the gas density, σ is the conductivity of the gas, and ξ is a constant related to gas medium [39–42].
The equivalent discharge loop of the trigger gap is given in figure 6, RParallelis the paralleled resistor, CTriggerGap≈14 pF is the structural capacitance,LStructure≈ 12.4 μH is the structural inductance, LSpark≈ 14ld= 2.1 μH is the inductance of the spark channel [18], RSpark= ld/(σπis the dynamic resistance [39–42].Based on the Barannik formula,the spark resistance can be calculated as [42]
Figure 6.Equivalent discharge loop of the trigger gap.
A typical current waveform through the trigger gap(p = 0.4 MPa, ρ = 5 kg m−3, RParallel= 0, the breakdown voltage is 21 kV) is demonstrated in figure 7, the FWHM of the current waveform is around 15 ns,which is approximately the FWHM of the UV optical pulse in the previous measurement [11, 18].

Figure 7.A typical current waveform through the trigger gap.
As figure 5 demonstrates,the area at the cathode surface can be roughly divided into 12 pieces due to the difference in electric fields.While the cross point of the Z-axis and the tangent of an area element is on the left of the origin(0,0),the element can be neglected because the photons emitted from (0, 0) cannot reach that element.Due to the symmetry, a two-dimensional axisymmetrical coordinate can be adopted.For j = 1–12,assuming that L0jis the straight line distance from (0, 0) and the midpoint of each element.Z0jis the shortest distance between(0, 0) and the tangent of the jth element.Ψ0jis the arccosine of Z0j/L0j.Ejis the average electric field strength of two nodes.Table 1 demonstrates the above parameters and the areas of the 12 elements, in which U(t) is the time-varying voltage on the switch in kV.
Table 1.The parameters of 12 area elements at the cathode surface.
Based on the above assumption, the generating rate of initial electrons of the jth area element is [33]

The current through the trigger gap is

The generating rate of initial electrons can be simplified as
Considering the main wavelengths of photons [11, 18],the absorption coefficient μ is set as 1.2 × 10⁻³cm−1·Torr−1[43].As the efficiency of UV-illumination is around 1%[37],the coefficient γpαsis set as 0.004 in the calculations.
2.2.2.Breakdown probability.The breakdown probability Sjis defined as the probability that the breakdown is initiated at the jth region once there is an initial electron in this region.
The electric field of breakdown’s initiation Esobeys Weibull Distribution [13, 36, 44, 45], the CDF of this distribution is

In equation (31), k1is influenced by the surface of electrodes and is proportional to the area of electrodes,k2≈ 6.3 is a constant and is irrelevant to gas composition and electrode topography [44, 45], E0is the minimum electric field under which the breakdown can happen, and E0is a function of gas composition and pressure.The mean value of Esis [46]

To determine the value of k1and E0, assuming that the mean value of Esis equal to the expectation of the breakdown electric field of a 6 cm uniform gap.Given that the selfbreakdown probability for a nearly uniform gas gap (same electrode roughness,the area is 15.9 cm2)is about 0.02 when the operating coefficient is 0.95 [13].
The expectation of the self-breakdown electric field of a uniform gap Esbd(kV cm−1) in nitrogen can be calculated by[47]
in equation (33) p is the gas pressure in bar, d is the gap distance in mm.
Based on the simplification above, the following equations can be derived.
Solving equations (34) and (35) under 0.4 MPa, we get k1= 3.7 × 10⁻⁹per cm2and E0= 97.1 kV cm−1, then the breakdown probability of the jth region Sjis derived.
As the generating rate of initial electrons and breakdown probability is known, the distribution function of Tscan be calculated.
2.2.3.Formative time delay.Formative time delay of singleelectron initiated discharge and multi-electrons initiated discharge might be different [10].In the switch, the initial electrons are generated when the breakdown probability is smaller than 1.When the production of the number of initial electrons and the breakdown probability is near 1, the breakdown process is highly probable to be initiated.So the discharge type in the switch is likely to be multi-electrons initiated discharge, and the starting time of the formative stage can be seen as t = Ts.Once an initial effective electron appears at Ts, the average electric field in the switch gap is E(Ts) = U(Ts)/d.When the gas medium is nitrogen, formula(15) can be rewritten as
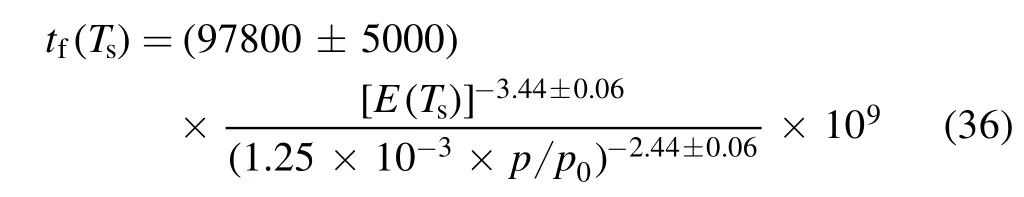
in formula(36)tfis in ns,E(Ts) = Umax[1 −cos(ωTs)]/(2d)is in kV cm−1, ω is determined by the pulse rise time, p is in MPa, and p0= 0.101 325 MPa.
As the distribution model of Tsand the calculation formula of tfare given, the mean time delay and jitter can be calculated by equations (16)–(19).
2.3.Analysis of influence factors of breakdown time delay and jitter of a self-triggered pre-ionized switch
Three key influence factors of switch time delay and jitter are analyzed for cases under 0.4 MPa.The breakdown time delay and jitter of the trigger gap are obtained by experiments, and Y(Ttr) is fitted by three-parameter Weibull distribution model based on experimental data.
2.3.1.Injection time of pre-ionization.The injection time of pre-ionization is a crucial parameter in the self-triggered pulsed switch.Earlier injection means that the trigger gap should share a larger fraction of voltage (larger du/dt on the trigger gap), and the jitter of the trigger gap is smaller.Early and late injection cases are calculated when the pulse rise time is 100 ns.
Figures 8 and 9 demonstrate the CDFs and PDFs of Ttrand Ts.As figure 8 indicates, if the pre-ionization is injected when the electric field is high enough in the switch gap (late injection), the CDFs of Ttrand Tsare nearly overlapped.When the pre-ionization is injected early, the CDF of Tsis tens of nanoseconds behind the CDF of Ttrbecause the effective initial electrons are generated at the falling edge of the trigger gap current inefficiently.Even worse, the CDF of Tsat the peak time is smaller than 1,namely,the switch might fail to break down during the pulse front edge or the whole pulse.This might severely threaten the insulation in practice.Therefore, a high efficient pre-ionization should make the PDFs of Ttrand Tsoverlap,then the distribution function of Tswill be determined by the distribution function of Ttr.
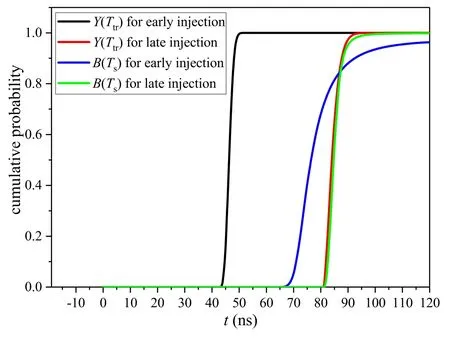
Figure 8.CDFs of Ttr and Ts under different injection times.
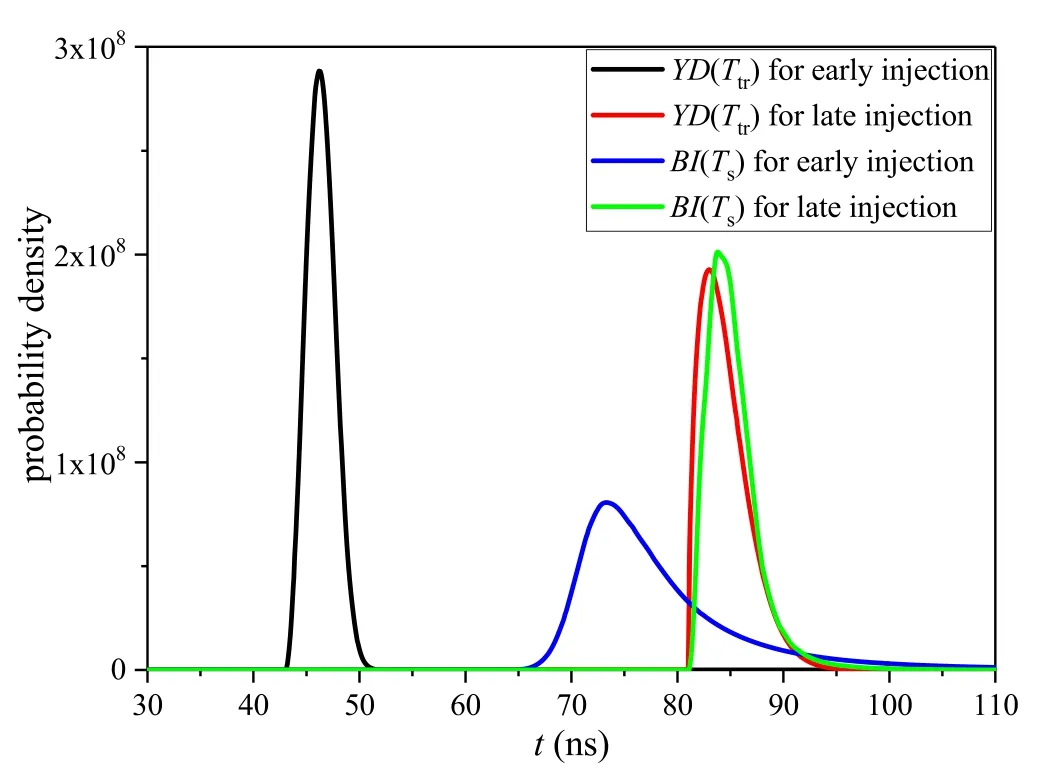
Figure 9.PDFs of Ttr and Ts under different injection times.
As figure 10 indicates,under the early injection case,the mean pre-ionization time delay is 46.5 ns, and the preionization jitter tjtris only 1.37 ns, but the mean statistical time delay is 75.9 ns, and its jitter tjsis 8.8 ns, due to the counteracting effect in the formative stage, the breakdown time delay jitter tjis reduced to 6.2 ns and the mean breakdown time delay is 110.2 ns.Under the late injection case, the mean pre-ionization time delay is 84.2 ns, and tjtris 2.05 ns, the mean statistical time delay is 85.1 ns, and tjsis 2.71 ns.The mean statistical time delay is approximately the mean pre-ionization time delay, and tjsis only a little larger than tjtr.This situation can be regarded as a highly efficient pre-ionization.Through the formative stage, tjis further reduced to 1.29 ns.The mean breakdown time delay is 117.0 ns,which is 6.8 ns longer than that in the early injection case due to a longer statistical time delay.

Figure 10.Time delay and jitter under different injection times.
2.3.2.Input pulse rise time.The rise time of primary pulses generated by our Marx generators is usually 100–200 ns.The 0%–100% pulse rise times in the following calculations are 100 and 180 ns.The pre-ionization is injected near the peak time to ensure high efficiency,and the mean breakdown time delay is also adjusted to be near the peak time to obtain a high energy transfer efficiency of the pulsed switch.
Figure 11 indicates that the PDFs of Tsand Ttrare almost overlapped if the pre-ionization is efficient as the pulse rise time varies.Figure 12 demonstrates further calculation results.Under both pulse rise times, the mean pre-ionization time delay is approximately the mean statistical time delay.The pre-ionization jitter tjtrincreases from 2.05 to 3.56 ns as the pulse rise time increases from 100 to 180 ns.Consequently, the statistical time delay jitter tjsincreases from 2.71 to 3.32 ns, and the breakdown time delay jitter tjincreases from 1.29 to 2.60 ns.The mean formative time delay is about 30 ns in both cases.Therefore,a shorter pulse rise time makes for obtaining a lower time delay jitter under the peak-time breakdown mode.

Figure 11.PDFs of Ttr and Ts under different pulse rise times.
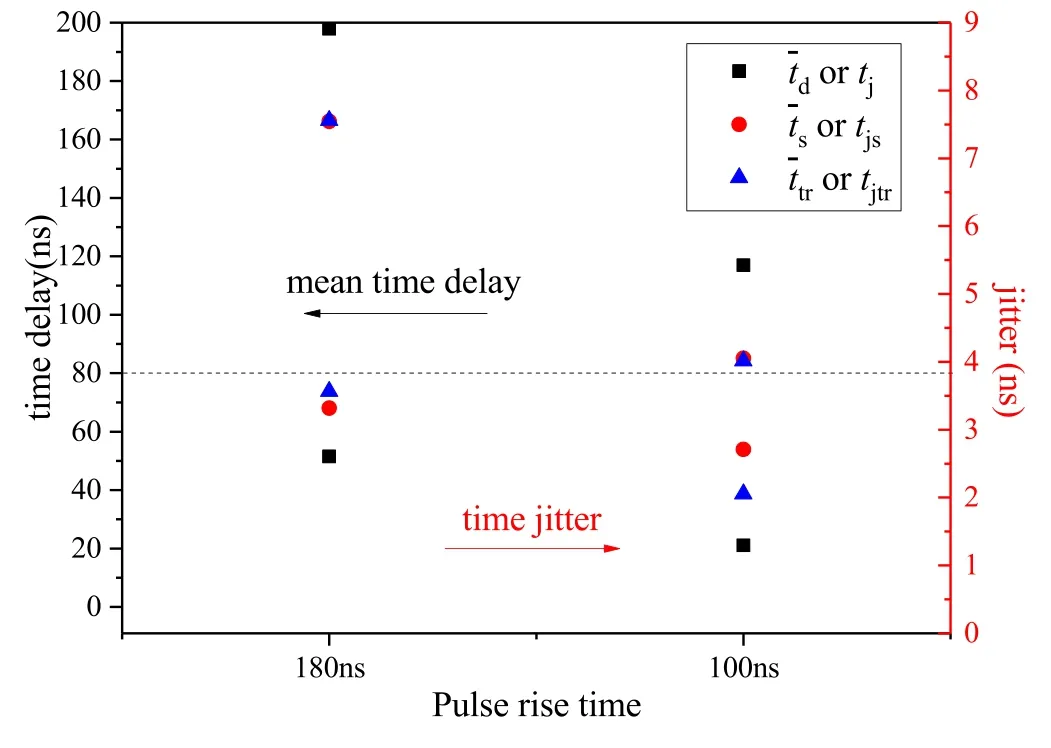
Figure 12.Time delay and jitter under different pulse rise times.
2.3.3.Pre-ionization jitter.Based on the analysis above, it is observed that the pre-ionization jitter tjtrmight be a crucial determinant of the breakdown time delay jitter tj.To analyze the importance of tjtr, the two cases in section 2.3.2 are recalculated on the condition that tjtr= 0.The PDF of Tswhen tjtr= 0 in figure 13 is similar to the shape of the absolute value of discharge current in figure 7 due to calculating formulas (7) and (30).While tjtr≠ 0, the PDF of Tswill be mainly determined by the distribution of Ttr,which is shown in figure 11.
Figure 13.PDFs of Ts with and without pre-ionization jitters.
As figures 13 and 14 indicate,with tjtr= 0,the statistical time delay jitter tjsis about 1.5 ns, and the PDFs of Tsare approximately the same under different pulse rise times.The breakdown time delay jitter tjincreases from 0.57 to 1.28 ns as the pulse rise time increases from 100 to 180 ns, which indicates that the offset effect in the formative stage is weakened because the electric field changes slower under longer pulse rise time.Considering tjtr≠0 and tjtrincreases as the du/dt on the trigger gap decreases, tjwill increase due to the increase of tjtrand a weaker offset effect in the formative stage as the pulse rise time increases.
On the whole, to reduce tjand make the self-triggered switch break down near the peak time to get a high energy transfer efficiency,the pre-ionization should be injected when the electric field is high enough to initiate the breakdown,and a shorter rise time helps for a lower time jitter, which is the same in a self-breakdown switch.
Figure 14.Time delay and jitter with and without pre-ionization jitters.

Figure 15.Equivalent circuits of the experimental platform of the switch (a), experimental platform of the trigger gap (b), and the trigger gap before its breakdown (c).
3.Experimental platforms and methods
3.1.Experimental platforms
Equivalent circuits of the experimental platforms and the selftriggered switch before breakdown are given in figure 15.
Figure 15(a) is the test platform of the self-triggered switch.The primary pulses are generated by a Marx generator.Cm, Lm, and Rmare the equivalent capacitance,inductance, and stray resistance of the Marx generator.Ct= 300 pF is the transfer capacitor.Lt= 2.5 μH is the equivalent inductance of the transfer stage.RL= 60 Ω is the load resistor.To alter the rise time of input pulses on the preionized switch, two Marx generators are developed.When Marx-1 is applied, the equivalent parameters are Cm1= 2.5 nF,Lm1= 5 μH,Rm1= 8.3 Ω,the 0%–100%pulse rise time on Ctis about 100 ns(10%–90%rise time is about 60 ns),and the amplitude of output voltage is from about 200 to 800 kV.When Marx-2 is applied, the equivalent parameters are Cm2= 1.67 nF,Lm2= 11.74 μH,Rm2= 7 Ω,the 0%–100%pulse rise time on Ctis about 180 ns (10%–90% rise time is about 120 ns), and the amplitude of output voltage is from about 400 to 800 kV.At CH1, the charging current of Ctis measured by a high-power small resistor r1(0.5 Ω), and the voltage on Ctis the integral of its charging current.Its upper cut-off frequency is about 13 MHz,and the (integral)voltage division ratio is 1370 ± 17, which is calibrated by the North Star Probe PVM-6.At CH2, small resistor r2(0.8 Ω) is installed in series with RLto measure the switch current merely for calculating the breakdown time delay.It actually forms a resistance voltage divider with RL, whose response time is theoretically less than 0.2 ns.A Tektronix DPO4104B is used to record the waveforms,its bandwidth is 1 GHz,and the sampling rate is 5 GS s−1.Considering that the equivalent frequency of the measured pulses is lower than 5.0 MHz and 2.8 MHz when the 0%–100% voltage rise time is 100 ns and 180 ns (the 0%–100% rise time of the charging current of Ctis about 50 and 90 ns), respectively, so the above measuring equipment can meet the requirements.
Because the breakdown time delay of the trigger gap ttrcannot be directly measured in the operation of the switch, it should be separately measured.Figure 15(b) is the separate test platform of the trigger gap.The primary pulses are also generated by a Marx generator, Cm3= 0.53 nF is the equivalent capacitance, and Lm3= 96 μH is the equivalent inductance.Ct3= 1.03 nF is a transfer capacitor.Rs= 204.5 Ω is the current-limiting resistor.Ra= 1.49 kΩ and Rb= 0.3 Ω form a resistance voltage divider, its voltage division ratio is 5900 ± 23, which is also calibrated by the North Star Probe PVM-6,and the response time is theoretically less than 5 ns.The charging voltage of the Marx is up to 100 kV and the full-wave rise time of the pulses on the trigger gap is longer than 250 ns, which makes sure the trigger gap can break down at the front edge of input pulses.Resistor r3(0.3 Ω) is used to measure the current through the gap after its breakdown, its upper cut-off frequency is about 8 MHz.The waveforms are also recorded by a Tektronix DPO4104B.Because the corresponding equivalent frequency of measured pulses is lower than 1 MHz, the measuring equipment can meet the requirement.
Figure 15(c) is an equivalent circuit of the self-triggered switch before breakdown.CAa, CaC, CAc, CcC, Cacare equivalent capacitances.RAa, Rac, and RcCare parallel resistors for voltage division.Based on the configuration in figure 1, equivalent parameters can be calculated as CAa= CaC≈ 6.6 pF, CAc= CcC≈ 0.2 pF, Cac≈ 14 pF.The voltage waveform on the trigger gap can be adjusted by changing RAa, RcC, and Rac.In the following experiments,RAaand RcCare fixed, and Racis changed to adjust the breakdown time of the trigger gap.The voltage waveform and its rising speed (du/dt) on the trigger gap under switch operating conditions can be obtained through circuit simulation based on figures 15(a) and (c), then we can set the same du/dt in the experiment of trigger gap to get its breakdown time delay.
3.2.Experimental procedures and data processing methods
Breakdown characteristics of the self-triggered switch are tested in the range of Marx generators’ capacities.The working medium of the switch is nitrogen, and the operating gas pressure is chosen in the range of 0.1–0.7 MPa.The electrodes are cleaned by alcohol, and 200 shots are fired before the formal experiment to eliminate the influence of metal burrs on the electrode.The trigger gap is tested separately after the switch experiment.Figure 16 provides key reference points and definitions in the experiments.
Figure 16.Key reference points and definitions in the switch experiment (a) and trigger gap experiment (b).
Figure 16(a) demonstrates the waveforms in the switch experiment, in which U and Isare experimentally measured,and Itis obtained by circuit simulation for the comparison.Because the time point t = 0 is difficult to read, the starting point is determined as the 10% peak time of U.The rising speed of pulsed voltage on the switch du/dt can be calculated approximately as
Comparison of the reference time lags helps the judgment of breakdown time and efficiency.The switch should be managed to break down near the point U-peak for a high energy transfer efficiency, so the breakdown time delay should be equal to or longer than the 10%-peak rise time of U.Under this condition, the peak voltage on Ctcan be considered as the breakdown voltage of the switch Ub.
Fifty shots of data are obtained under each condition to analyze the jitter.The calculating method of the mean breakdown time delay¯t,d breakdown time delay jitter tj,mean breakdown voltage ¯U,b percentage breakdown voltage jitter Ujis given in equations (38)–(41), n is the test number

Figure 16(b) shows the waveforms in the trigger gap experiment.As the pulsed voltage on the trigger gap is nearly in the form of Utrigger(t) = kt,its breakdown time delay under a specific du/dt is defined as the time from the starting point to the breakdown point.Then the actual ttrunder switch operating conditions can be obtained by adjusting du/dt and adding the phase-difference time.The calculating method ofand tjtris the same as shown in equations (38) and (39).
4.Experimental results and discussion
4.1.Effect of several influence factors on the breakdown characteristics of the self-triggered switch
Experiments are carried out on the platforms in section 3 to verify the model and analysis in section 2.
4.1.1.Injection time of pre-ionization.The controlled experiments are carried out using Marx-1.The parallel resistors for voltage division RAaand RcCin figure 15(b)are fixed as 24.5 kΩ,Racis changed from 4.5 to 2.2 kΩ,which correspond to the early injection and late injection cases,respectively.The charging voltages of both cases are the same when the gas pressure varies from 0.3 to 0.7 MPa, and the switch is adjusted to break down near the peak time to obtain a high energy transfer efficiency.
As figures 17 and 18 demonstrate, the breakdown time delay jitter tjof early injection cases is notably larger than that of late injection cases,and the mean breakdown time delay of early injection cases is a little shorter than that of late injection cases,which are in accord with the characteristic calculated in section 2.3.1.tjof late injection cases is no more than 1.6 ns,and the breakdown voltage jitter Ujof late injection cases is smaller than 0.75% as gas pressure changes from 0.3 to 0.7 MPa, which indicates that the pre-ionization is efficient.While tjof the early injection cases is larger than 6 ns when the gas pressure is 0.3 MPa,as the gas pressure increases,tjis reduced to a little more than 2 ns.The mean breakdown voltage of early injection cases is higher, and Ujis also regularly larger than that of late injection cases,which means the pre-ionization is not efficient enough under the early injection condition.
Figure 19 compares the breakdown time delay jitters and the percentage of front edge breakdown.Under 0.4 MPa,tjof early injection case is 3.93 ns(calculated value is 6.2 ns),and the probability of front edge breakdown is 98% (calculated value is 96.6%),tjof late injection case is 1.25 ns(calculated value is 1.29 ns),and the probability of front edge breakdown is 100% (calculated value is 99.8%).In practice, the probability of front edge breakdown should be 100% to protect the insulation of capacitors.For the multi-pressure operation of the switch in a sealed chamber, the parallel resistors for voltage division are troublesome to change, so the injection time of pre-ionization under the same voltage division ratio might be different under different gas pressures,which also contributes to the difference of tj.

Figure 17.Front edge breakdown time delay and jitter under different pre-ionization injection times (pulse rise time = 100 ns).
Figure 18.Front edge breakdown voltages and jitters under different pre-ionization injection times (pulse rise time = 100 ns).
Figure 19.Breakdown time delay jitters and percentages of front edge breakdown cases under different pre-ionization injection times(pulse rise time = 100 ns).
4.1.2.Input pulse rise time.The same switch with the same parallel resistors (RAa= RcC= 24.5 kΩ, Rac= 2.2 kΩ) is tested using Marx-1 and Marx-2, the pulse rise times are 100 ns and 180 ns, respectively.The voltage division structure for triggering can ensure a highly efficient preionization and charging voltage of the Marx generator is adjusted to make the switch break down near the peak time.
Figures 20 and 21 demonstrate the time and voltage characteristics of the switch under different pulse rise times.As figure 20 indicates, the breakdown time delay jitter tjincreases from 1.05–1.60 ns to 5.34–7.83 ns when the pulse rise time increases from 100 to 180 ns.Under 0.4 MPa,mean breakdown time delay under 180 ns rise time is 169.0 ns(calculated value is 167.9 ns after subtracting 0%–100% rise time of U), mean breakdown time delay under 100 ns rise time is 101.2 ns (calculated value is 97.0 ns after subtracting 0%–10%rise time of U),the calculated values agree well with the experiment results.
However, there is a gap between the calculations and experiment results for tj.When the gas pressure is 0.4 MPa,tjunder 180 ns rise time is 7.08 ns(calculated value is 2.60 ns),tjunder 100 ns rise time is 1.25 ns (calculated value is 1.29 ns).The calculations agree well with the experiment result under 100 ns rise time but underestimate tjunder 180 ns rise time.The probable reasons might be: (1) only the time jitter of the trigger gap is considered,while its voltage jitter is neglected, which will influence the generating rate of initial electrons in the calculations; (2) the operating voltage of the switch is about 20 kV lower under 180 ns rise time,the lower the electric field strength on the cathode surface, the higher the actual work function, while γpαsis the same in the calculations; (3) the pre-ionization jitter tjtris larger (3.56 ns)under 180 ns rise time, the electric field strength at the cathode surface is actually different when the trigger gap breaks down at different time Ttrdue to its jitter, then γpαschanges with Ttr, this is also neglected in the calculations.
Furthermore, the formative time delay tfis calculated using the Martin formula, but a slight variation of the exponential term leads to a remarkable difference of tfwhen the electric field E changes.The voltage waveform in practice also needs consideration because the changing rate of the pulsed electric field from U-90%to U-peak is rather small,the offset effect might be weakened more.
To prove the influence of changing rate of the electric field, the charging voltage of the Marx generator is increased to make the switch break down before the peak time of the input pulse, the changing rate of pulse voltage at the front edge is larger than that near the peak point.Figure 22 shows three reference time lags as du/dt changes under 0.5 MPa gas pressure.As du/dt increases from 4.32 to 4.61 kV ns−1(by 6.7%), the 10%-peak rise time of U gets longer than the breakdown time delay td,which means that the switch breaks down at the front edge of the input pulse, the mean breakdown time delay decreases from 169.7 to 132.1 ns, and tjdecreases from 5.72 to 1.77 ns.While du/dt further increases to 5.35 kV ns−1, tjmerely decreases from 1.77 to 1.53 ns, which indicates that increasing the electric field strength might not be the dominant factor for reducing tj.Increasing du/dt by a small percentage will not significantly reduce the pre-ionization jitter tjtr,so the remarkable reduction of tjmight be caused by the increase of du/dt and consequently a more effective offset in the formative stage.
Figure 20.Breakdown time delay and jitter under different pulse rise times (late injection of pre-ionization, breakdown near the peak time).
Figure 21.Breakdown voltages and jitters under different pulse rise times (late injection of pre-ionization, breakdown near the peak time).
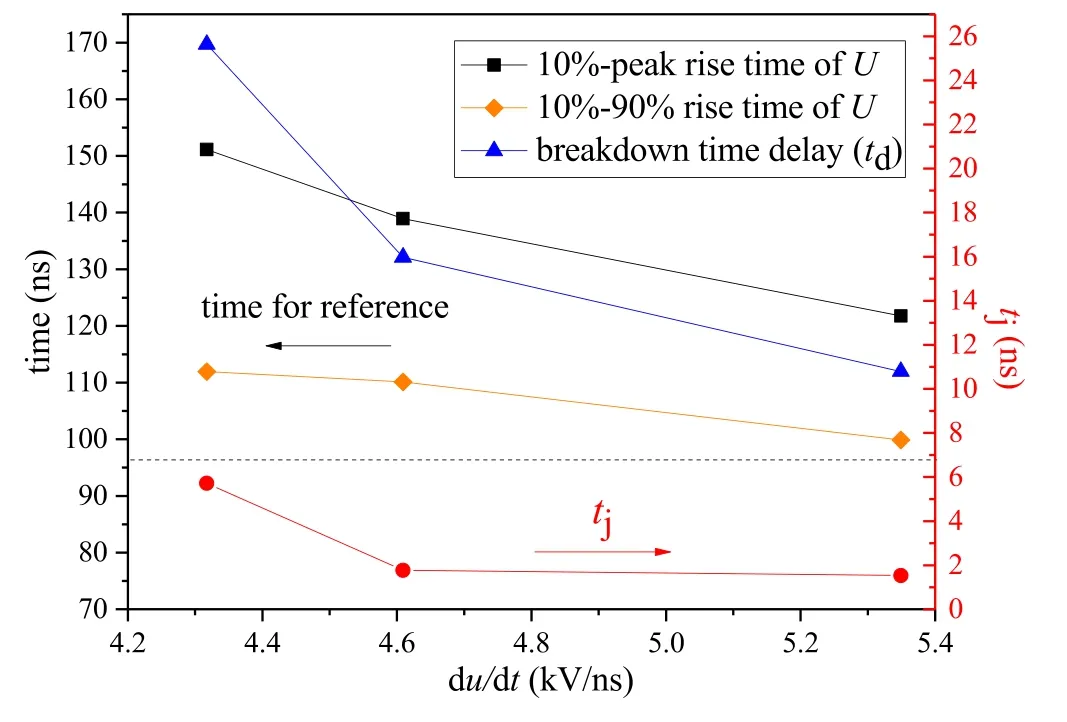
Figure 22.Reference time lags when du/dt of input pulses is different (pulse rise time = 180 ns, late injection of pre-ionization).
4.1.3.Pre-ionization jitter.As analyzed in section 2.3.3, the pre-ionization jitter tjtris a crucial factor determining the switch jitter characteristic when the injection time of preionization is proper,while tjtrcannot be eliminated due to the intrinsic limitation of self-triggering.However, tjmight be smaller than tjtrdue to the offset during the formative stage.To verify the assumption, figures 23 and 24 compare the breakdown time delay and jitter of the trigger gap and the switch when tjis small.Experimental methods are already given in section 3.2.
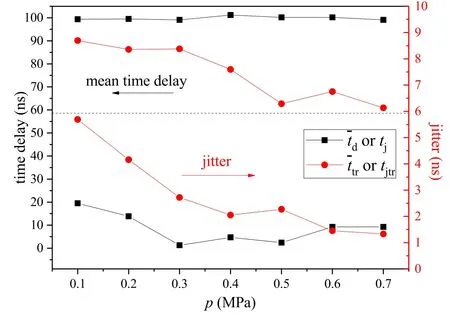
Figure 23.Breakdown time delay and jitter of the trigger gap and the switch (pulse rise time = 100 ns, late injection of pre-ionization).

Figure 24.Breakdown time delay and jitter of the trigger gap and the switch (pulse rise time = 180 ns, late injection of pre-ionization).
Figure 23 demonstrates the results under 100 ns pulse rise time.As the gas pressure varies from 0.1 to 0.3 MPa,the breakdown time delay of the trigger gap maintains at about 86.3–90.1 ns, as tjtrdecreases from 5.69 to 2.72 ns, tjdecreases from 2.48 to 0.89 ns accordingly.It proves to a degree that reducing tjtrcan reduce tjeffectively.As gas pressure increases from 0.4 to 0.7 MPa, tjtrfurther decreases from 2.05 to 1.33 ns,the breakdown time delay of the trigger gap decreases from 77.6 to 60.9 ns, while tjincreases from 1.25 to 1.60 ns.It indicates that injecting the pre-ionization earlier might slightly increase tjeven tjtris reduced.Nevertheless,tjis no more than 1.60 ns when the gas pressure varies from 0.4 to 0.7 MPa, showing that the pre-ionization is effective when injected at 90% peak time.
Figure 24 demonstrates the results under 180 ns pulse rise time.As the gas pressure varies from 0.4 to 0.7 MPa,the breakdown time delay of the trigger gap decreases from 115.4 to 96.9 ns(the injection time of pre-ionization decreases from about 90% peak time to 80% peak time), and tjtrdecreases from 3.82 to 2.67 ns.The breakdown time delay of the switch maintains at about 130.8–132.1 ns, and tjmaintains at about 1.53–1.99 ns.It further shows that the pre-ionization is effective when it is injected after 80% peak time, and the formative stage can partly offset the pre-ionization jitter.
4.2.Discussion
Experimental results basically prove the model analysis, but several deficiencies need further investigation.First, the distribution model of Tsshould be more precise considering both the time and voltage jitter of the trigger gap, the dynamic photoemission coefficient based on the time-varying electric field at the cathode surface.Second, a more refined calculation model of tfconsidering the dynamic generating rate and spatial distribution of initial/extra electrons, the strength and changing rate of electric field should be further studied,which will greatly help to learn the mechanism in the formative stage.Third, in the model, we only focus on the breakdown time delay and jitter characteristics, while the operating voltage and switch structure are fixed parameters, the model needs further refinement if we would like to analyze the margins of operating voltage,gap distance,and geometry,etc.Besides,the breakdown jitter of a self-triggered switch is restricted by the jitter of trigger gap to a great degree, a 1.5 mm trigger gap is adopted because as its gap distance is longer,its jitter is smaller(larger field enhancement factor and larger volume for the generation of initial electrons due to background radiation), and the illumination intensity is stronger (the breakdown voltage is higher and the energy stored in the trigger gap is in direct proportion to the square of breakdown voltage).Though surface flashover phenomena through the ceramic bushings are observed when the gas pressure is higher than 0.5 MPa, the capacitance and inductance of the trigger gap loop are determined by the structure parameter, the pre-ionization is proved to be effective under high gas pressure.However,it is thought-provoking that how the structure and parameter of the trigger gap can be further optimized to reduce its jitter and increase the efficiency of generating electrons.
5.Conclusion
A calculation model for the breakdown time delay and jitter of gas switches under hundred-nanosecond pulses is established, and the influence factors of breakdown characteristics of a self-triggered pre-ionized switch are analyzed based on the calculation model and experiments.The following conclusions can be obtained.
First, the injection time of pre-ionization is a decisive factor of the switch jitter.The pre-ionization should be injected when the electric field in the switch gap is high enough to make sure the photoelectrons become effective initial electrons once they are generated.Early injection might bring about a much larger statistical time delay jitter even the pre-ionization jitter is small, and there might be some probability that the switch cannot break down at the front edge of the input pulse.
Second, under pulses with a shorter rise time, it is easier to make the switch break down near the peak time because the pre-ionization jitter is reduced, and the statistical time delay jitter is better offset in the formative stage due to a faster changing rate of the electric field.Under pulses with a longer rise time, increasing the rising speed of pulse voltage du/dt by a few percent can also reduce the switch jitter remarkably because larger du/dt enhances the offset effect in the formative stage.
Third,the pre-ionization jitter is an intrinsic restriction of the self-triggered switch, when the pre-ionization is injected at a proper time, the breakdown time delay jitter is mainly determined by the pre-ionization jitter and the offset in the formative stage.When the pulse rise time is ∼100 ns and the injection time of pre-ionization is around 90%–100% peak time, the switch can stably break down near the peak time with tjsmaller than 2.5 ns.When the pulse rise time is∼180 ns and the injection time of pre-ionization is around 80%–90% peak time, the switch can stably break down around 90% peak time with tjsmaller than 2 ns.
Acknowledgments
The authors are grateful for the assistance of Prof Peitian Cong, Dr Jiahui Yin, Dr Xiaofeng Jiang, Dr Weixi Luo, Mr Le Cheng, Mr Kaisheng Mei, and Mr Jianli Zhang.
ORCID iDs
猜你喜欢
杂志排行

Plasma Science and Technology的其它文章
- Spatial and temporal evolution of electromagnetic pulses generated at Shenguang-II series laser facilities
- Numerical study on the loss of fast ions produced by minority ion cyclotron resonance heating in EAST
- Machine learning of turbulent transport in fusion plasmas with neural network
- Observation of coherent mode induced by a molybdenum dust on EAST
- Investigation of stimulated Raman scattering in longitudinal magnetized plasma by theory and kinetic simulation
- The influence of magnetic field on the beam quality of relativistic electron beam long-range propagation in near-Earth environment