Meta-Path-Based Deep Representation Learning for Personalized Point of Interest Recommendation
2021-10-22LIZhongWUMeimei吴梅梅
LI Zhong (李 重), WU Meimei (吴梅梅)
College of Information Science and Technology, Donghua University, Shanghai 201620, China
Abstract: With the wide application of location-based social networks (LBSNs), personalized point of interest (POI) recommendation becomes popular, especially in the commercial field. Unfortunately, it is challenging to accurately recommend POIs to users because the user-POI matrix is extremely sparse. In addition, a user’s check-in activities are affected by many influential factors. However, most of existing studies capture only few influential factors. It is hard for them to be extended to incorporate other heterogeneous information in a unified way. To address these problems, we propose a meta-path-based deep representation learning (MPDRL) model for personalized POI recommendation. In this model, we design eight types of meta-paths to fully utilize the rich heterogeneous information in LBSNs for the representations of users and POIs, and deeply mine the correlations between users and POIs. To further improve the recommendation performance, we design an attention-based long short-term memory (LSTM) network to learn the importance of different influential factors on a user’s specific check-in activity. To verify the effectiveness of our proposed method, we conduct extensive experiments on a real-world dataset, Foursquare. Experimental results show that the MPDRL model improves at least 16.97% and 23.55% over all comparison methods in terms of the metric Precision@N (Pre@N) and Recall@N (Rec@N) respectively.
Key words: meta-path; location-based recommendation; heterogeneous information network (HIN); deep representation learning
Introduction
With the popularity of mobile devices and the development of global positioning system, location-based social networks (LBSNs) have emerged in recent years (e.g., Gowalla and Foursquare), which enable people to share their check-in records at interesting places[1]. These check-in data incorporate rich information about users and point of interests (POIs), which brings new opportunities to mine the visiting preferences for personalized POI recommendation. A POI usually refers to a specific place, such as “New York Public Library”. POI recommendation can not only help users to discover new POIs but also help service providers to find potential customers.
Different from the traditional item recommendation, such as recommendation in Amazon, Netflix, and Taobao, POI recommendation in LBSNs is more complex and challenging. Due to geographical limitations, among millions of POIs, only a small portion can be visited by a user. Furthermore, a user may not post all his/her check-in activities online. Consequently, compared with the traditional item recommendation, the POI recommendation faces a more severe data sparsity problem (i.e., a sparse user-POI matrix). In our experiments, the data sparsity is higher than 99%. In addition, a user’s check-in activities are affected by many influential factors, such as geographical locations and temporal dynamics[2]. Hence, there are many studies using various methods to analyze different influential factors to obtain the recommendation results under the sparse user-POI data.
Collaborative filtering (CF) is the most widely used method for POI recommendation. Many CF-based studies[3-7]try to improve POI recommendation performance by integrating additional information, such as geographical locations, temporal information, social relations, and category information into their models. These approaches often utilize simple linear functions, such as weighting coefficients and regularization terms, to model different influential factors. However, linear models fail to model the complex relationship between users and influential factors in LBSNs, resulting in poor recommendation performance.
In recent years, the neural network has achieved great success as it can realize nonlinear transformations and automatically learn features. Some studies[8-12]had been made to mine the sequential context information from users’ check-in records utilizing sequential models, such as the recurrent neural network (RNN) and the long short-term memory (LSTM) network. Some studies[13-16]focused on feature extraction by utilizing embedding learning techniques. In addition, some researchers[17-18]utilized the multilayer perceptron to conduct non-linear modeling for interactions of users and POIs.
However, most of these studies capture only few influential factors. It is hard for them to be extended to incorporate other heterogeneous information in a unified way.
Moreover, most existing studies ignore the different importance of influential factors on a user’s specific check-in activity. However, this difference is very helpful to improve recommendation performance. For example, a person who enjoys reading, has a check-in record “New York Library at 11:00 a.m.”. This check-in activity is affected by many factors, such as time, geographical location, and category (Library). However, the most important reason for this check-in activity is the user’s preference for the category “Library”. To boost the recommendation accuracy, places with the same category of “Library” should be recommended to this person rather than places nearby “New York Library”. Through distinguishing the importance of different influential factors, we can provide more satisfactory recommendation results to users.
Based on the above analyses, we can see that to improve the recommendation accuracy, it is very important for us to incorporate various heterogeneous information and deeply mine their relationships with considering different importance of influential factors. As a promising direction, heterogeneous information network (HIN) can naturally model complex objects and their rich relations in the real world[19]. In recent years, few HIN-based item recommendation methods[20-21]have been proposed and achieved excellent performance. However, these studies mainly focused on item recommendation. Xieetal.[22]designed a graph-based embedding model, which captured the sequential effect, geographical effect, temporal effect, and semantic effect in a unified way by embedding four bipartite graphs into a shared low dimensional space. However, it ignored the correlations between users and POIs in LBSNs.
Considering all of these above, we propose a meta-path-based deep representation learning (MPDRL) model for personalized POI recommendation with returning the top-Nlist of unvisited POIs for each user. MPDRL is a unified model which can incorporate various heterogeneous information and deeply mine the correlations between users and POIs. We construct four POI similarity matrices according to our designed four meta-paths “POI-Location-POI”, “POI-Time-POI”, “POI-Category-POI”, and “POI-User-POI”. Although the direct links between users and POIs are sparse, the links among POIs, time, categories, and locations are abundant in the HIN. Hence, the meta-path-based similarity matrix can not only alleviate data sparsity but also incorporate various heterogeneous information. Based on these similarity matrices, we utilize non-negative matrix factorization to further extract crucial information for the representations of POIs and users. Then, we further establish another four meta-paths connecting users and POIs in LBSNs according to influential factors and design an attention-based LSTM network to learn the importance of different influential factors on a user’s specific check-in activity.
In summary, the main contributions of our paper are three-fold.
(1)We propose a meta-path-based representation method for POIs and users, which incorporates the geographical, temporal, categorical, and co-visiting information in an HIN.
(2)We design an MPDRL model with an attention-based LSTM network to further mine the complex correlations between users and POIs. This model can learn the different contributions of influential factors to a user’s specific check-in activity.
(3)We conduct extensive experiments on a real-world dataset to compare the performance of our model with the existing popular recommendation methods. The experimental results show the effectiveness of our model. Comparing with all baselines, our MPDRL model improves at least 16.97% and 23.55% in terms of the metric Precision@N(Pre@N) and Recall@N(Rec@N) respectively.
The rest of this paper is organized as follows. The recent development of our research domain is provided in section 1. Some definitions are given in section 2. The details of our proposed MPDRL model are given in section 3. Then, experimental results and analyses are given in section 4. Finally, we make a conclusion in section 5.
1 Recent Development
In this section, we will provide the recent development of our research domain, including POI recommendation based on CF, POI recommendation based on neural networks, and recommendation based on HIN.
1.1 POI recommendation based on CF
CF is the most widely used approach for POI recommendation. With easy access to additional information in LBSNs, many studies[3-7]have tended to improve POI recommendation performance by integrating geographical location, temporal effect, social relations, and content information of POI into collaborative filtering model.
Yeetal.[3]utilized power law distribution to capture geographical influence among POIs and developed a naive Bayesian-based collaborative recommendation algorithm to linearly integrate user preference, social influence, the geographical influence. Chengetal.[4]captured the geographical influence by a multi-center Gaussian model and then fused it along with social influence into matrix factorization for POI recommendation. Lianetal.[5]captured the spatial clustering phenomenon in terms of two-dimensional kernel density estimation and introduced it into a weighted matrix factorization model. Linetal.[6]utilized matrix factorization to predict the categories of the POIs where a user might check in and then linearly fused user preferences, temporal influence, and geographical influence. Yuanetal.[7]analyzed the similarities between time slots in a day and integrated temporal cyclic information with the geographical influence into a user-based collaborative filtering framework for time-aware POI recommendation. However, these approaches often incorporate different influential factors through a simple fusion strategy such as weighting coefficients and additional constraints, which ignores the deep information hidden in the network structure of LBSNs.
1.2 POI recommendation based on neural networks
Neural networks have been proved effective in learning non-linear and abstract features in recent years, which can bring new opportunities to further improve the recommendation quality of traditional models. Some studies utilized sequential models such as RNN and LSTM to mine the sequential context information from users’ check-in records. Liuetal.[8]extended RNN and proposed a spatial-temporal recurrent neural network (ST-RNN) that modeled local temporal and spatial contexts with time and distance transition matrices respectively. Zhaoetal.[9]proposed a spatio-temporal LSTM model (ST-LSTM) to distinguish short-term and long-term interests. In ST-LSTM, one pair of time gate and distance gate was designed to exploit time and distance intervals to capture the short-term interest, and the other was to memorize time and distance intervals to model the long-term interest. Huangetal.[10]designed an attention-based spatial-temporal LSTM (ABST-LSTM) model which utilized the attention mechanism to focus on the relevant historical check-in records in a check-in sequence. Zhaoetal.[11]proposed a state-based stacked recurrent neural network to integrate spatial and temporal contexts and learned the latent structures of the user’s check-in sequence. However, these models still faced the data sparsity problem. Yuetal.[12]proposed a category-aware deep model (CatDM) that incorporated POI category and geographical influence to overcome data sparsity. CatDM utilizes two LSTM encoders to mine user preferences in POI categories respectively.
Meanwhile, some studies focused on feature extraction of POIs and users by utilizing embedding learning techniques. For example, Fengetal.[13]proposed a POI2Vec model which jointly learned the latent representations of the users and POIs by considering both the user preference and sequential transition influence. This work incorporates the sequential transition and geographical influence in the framework of Word2Vec[23]. Xuetal.[16]proposed an embedding model which encoded spatial-temporal context, and sequential relation in a unified manner for fine-grained user location prediction.
In addition, Heetal.[17]developed a deep neural network based on matrix factorization approach for interaction modeling. Based on the embeddings of items and users, the multilayer perceptron (MLP) is used to extract the high-level hidden feature by maximizing user-item interactions. Gaoetal.[18]designed a time-aware POI recommendation method which learned the abstract interactions among users, POIs, and time. However, most of these studies captured only few influential factors. It was hard for them to be extended to incorporate all the aforementioned factors (i.e., geographical, temporal, and categorical influences) in a unified way. Besides, most of existing studies ignored the importance of different influential factors on user’s check-in behavior, which was helpful to improve recommendation performance.
1.3 Recommendation based on HIN
In recent years, few studies[20-22]began to adopt HIN in recommendation system such as item recommendation in Taobao, to integrate more information and represent user activity semantics. For example, Huetal.[21]proposed an HIN-based recommendation model which leveraged meta-path-based context for item recommendation. However, their work mainly focused on the representation of user-item interaction and lacked an effective representation method for users and items.
Based on the above analyses, in this paper, we propose an MPDRL model for POI recommendation to deal with the above shortages.
2 Preliminaries
In this section, we define some basic concepts in the HIN for our problem.
Definition1HIN[24]
An HIN is defined as a directed graphG=(V,ε), which consists of an object setVand a link setε. An HIN also contains an object type mapping functionφ:V→Aand a link type mapping functionψ:ε→R. NotationsAandRdenote the predefined object type set and link type set respectively, where |A|+|R|>2.
Definition2Network schema[24]
A network schema, denoted byTG=(A,R), is a meta template for an HING=(V,ε) with the object type mapping functionφ:V→Aand the link type mapping functionψ:ε→R, which is a directed graph defined over object typesA, with edges as relations fromR.
Figure 1 illustrates an HIN example and its corresponding network schema for LBSNs. We use “-1” to denote the opposite direction of an edge. From Fig. 1(a), we can see that the network consists of various types of objects and their semantic relations. In the corresponding network schema Fig. 1(b), apart from the user node, the POI node, and the user-POI relation, we have other types of objects and relations in the network.
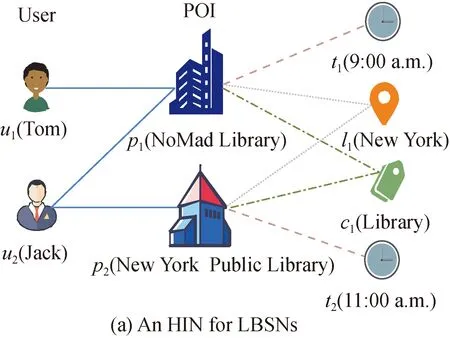
Fig. 1 Examples of an HIN and a network schema
(1) Location node. From a check-in record, we can obtain geographical information. Each location node indicates a geographical area. In our model, a city or a district is regarded as a location node.
(2) Time node. From a check-in record, we can obtain the check-in time stamp. In our experiment, we divide 24 h a day into 48 equal time slots. Then we can attribute the check-in time stamp to the corresponding time slot which is obtained through the above discretization.
(3) Category node. In LBSNs, POIs are divided into several categories to provide a semantic classification of various POIs. For example, in our experiment, the Foursquare dataset contains 10 top-level categories, such as nightlife spot and food, which have already been given in the dataset.
(4) POI-Location relation. Based on the check-in records, we establish a link between each POI node and corresponding location node to identify the region of a POI.
(5) POI-Time relation. Based on the check-in records, we can establish links between each POI node and corresponding time nodes to depict the semantic relation that a POI is visited at a specific time slot.
(6) POI-Category relation. Based on the check-in records, we assign each POI to its corresponding category. A POI can belong to several categories.
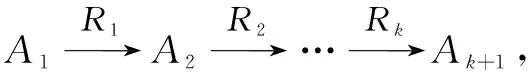
Definition3Meta-path[24]

Definition4Path Instance[24]
We say a pathm=(a1a2…ak+1) between object nodea1andak+1in networkGfollows the meta-path M, if ∀k,φ(ak)=Akand each linkek=〈akak+1〉 belongs to each relationRkin M. We call these paths as path instances of M, which are denoted asm∈M.
As illustrated in Fig. 1(a), the useru1and POIp2can be connected via different path instances,e.g.,u1p1l1p2andu1p1c1p2, which indicate different semantic correlations betweenu1andp2. The path instanceu1p1l1p2indicates thatu1has previously checked in POIp1which belongs to the same location as POIp2. The meta-pathu1p1c1p2indicates thatu1has previously checked in POIp1which belongs to the same category as POIp2.
3 MPDRL Framework
In this paper, we propose an MPDRL model for personalized POI recommendation. Figure 2 shows the architecture of the MPDRL model. In MPDRL, there are four main components, including: (a) learning representations of POIs from meta-path-based similarity matrices; (b) learning representations of users, locations, time slots, and categories; (c) an MPDRL with comprehensive influential factors; (d) predicting and model training.
Firstly, we learn the representations of POIs which incorporate geographical, temporal, categorical, and co-visiting information, as shown in Fig. 2(a). Next, to obtain general representations of a user, a location, a time slot, and a category, we aggregate the representations of POIs visited by this user, POIs located at this location, POIs visited at this time slot, and POIs belonging to this category respectively, as shown in Fig. 2(b). Then, we introduce an attention-based LSTM network to learn the representation of the correlation between a user and a POI, as shown in Fig. 2(c). Finally, we concatenate the representations of users, POIs, and the correlations as the input of MLP to predict the check-in probability, as shown in Fig. 2(d).
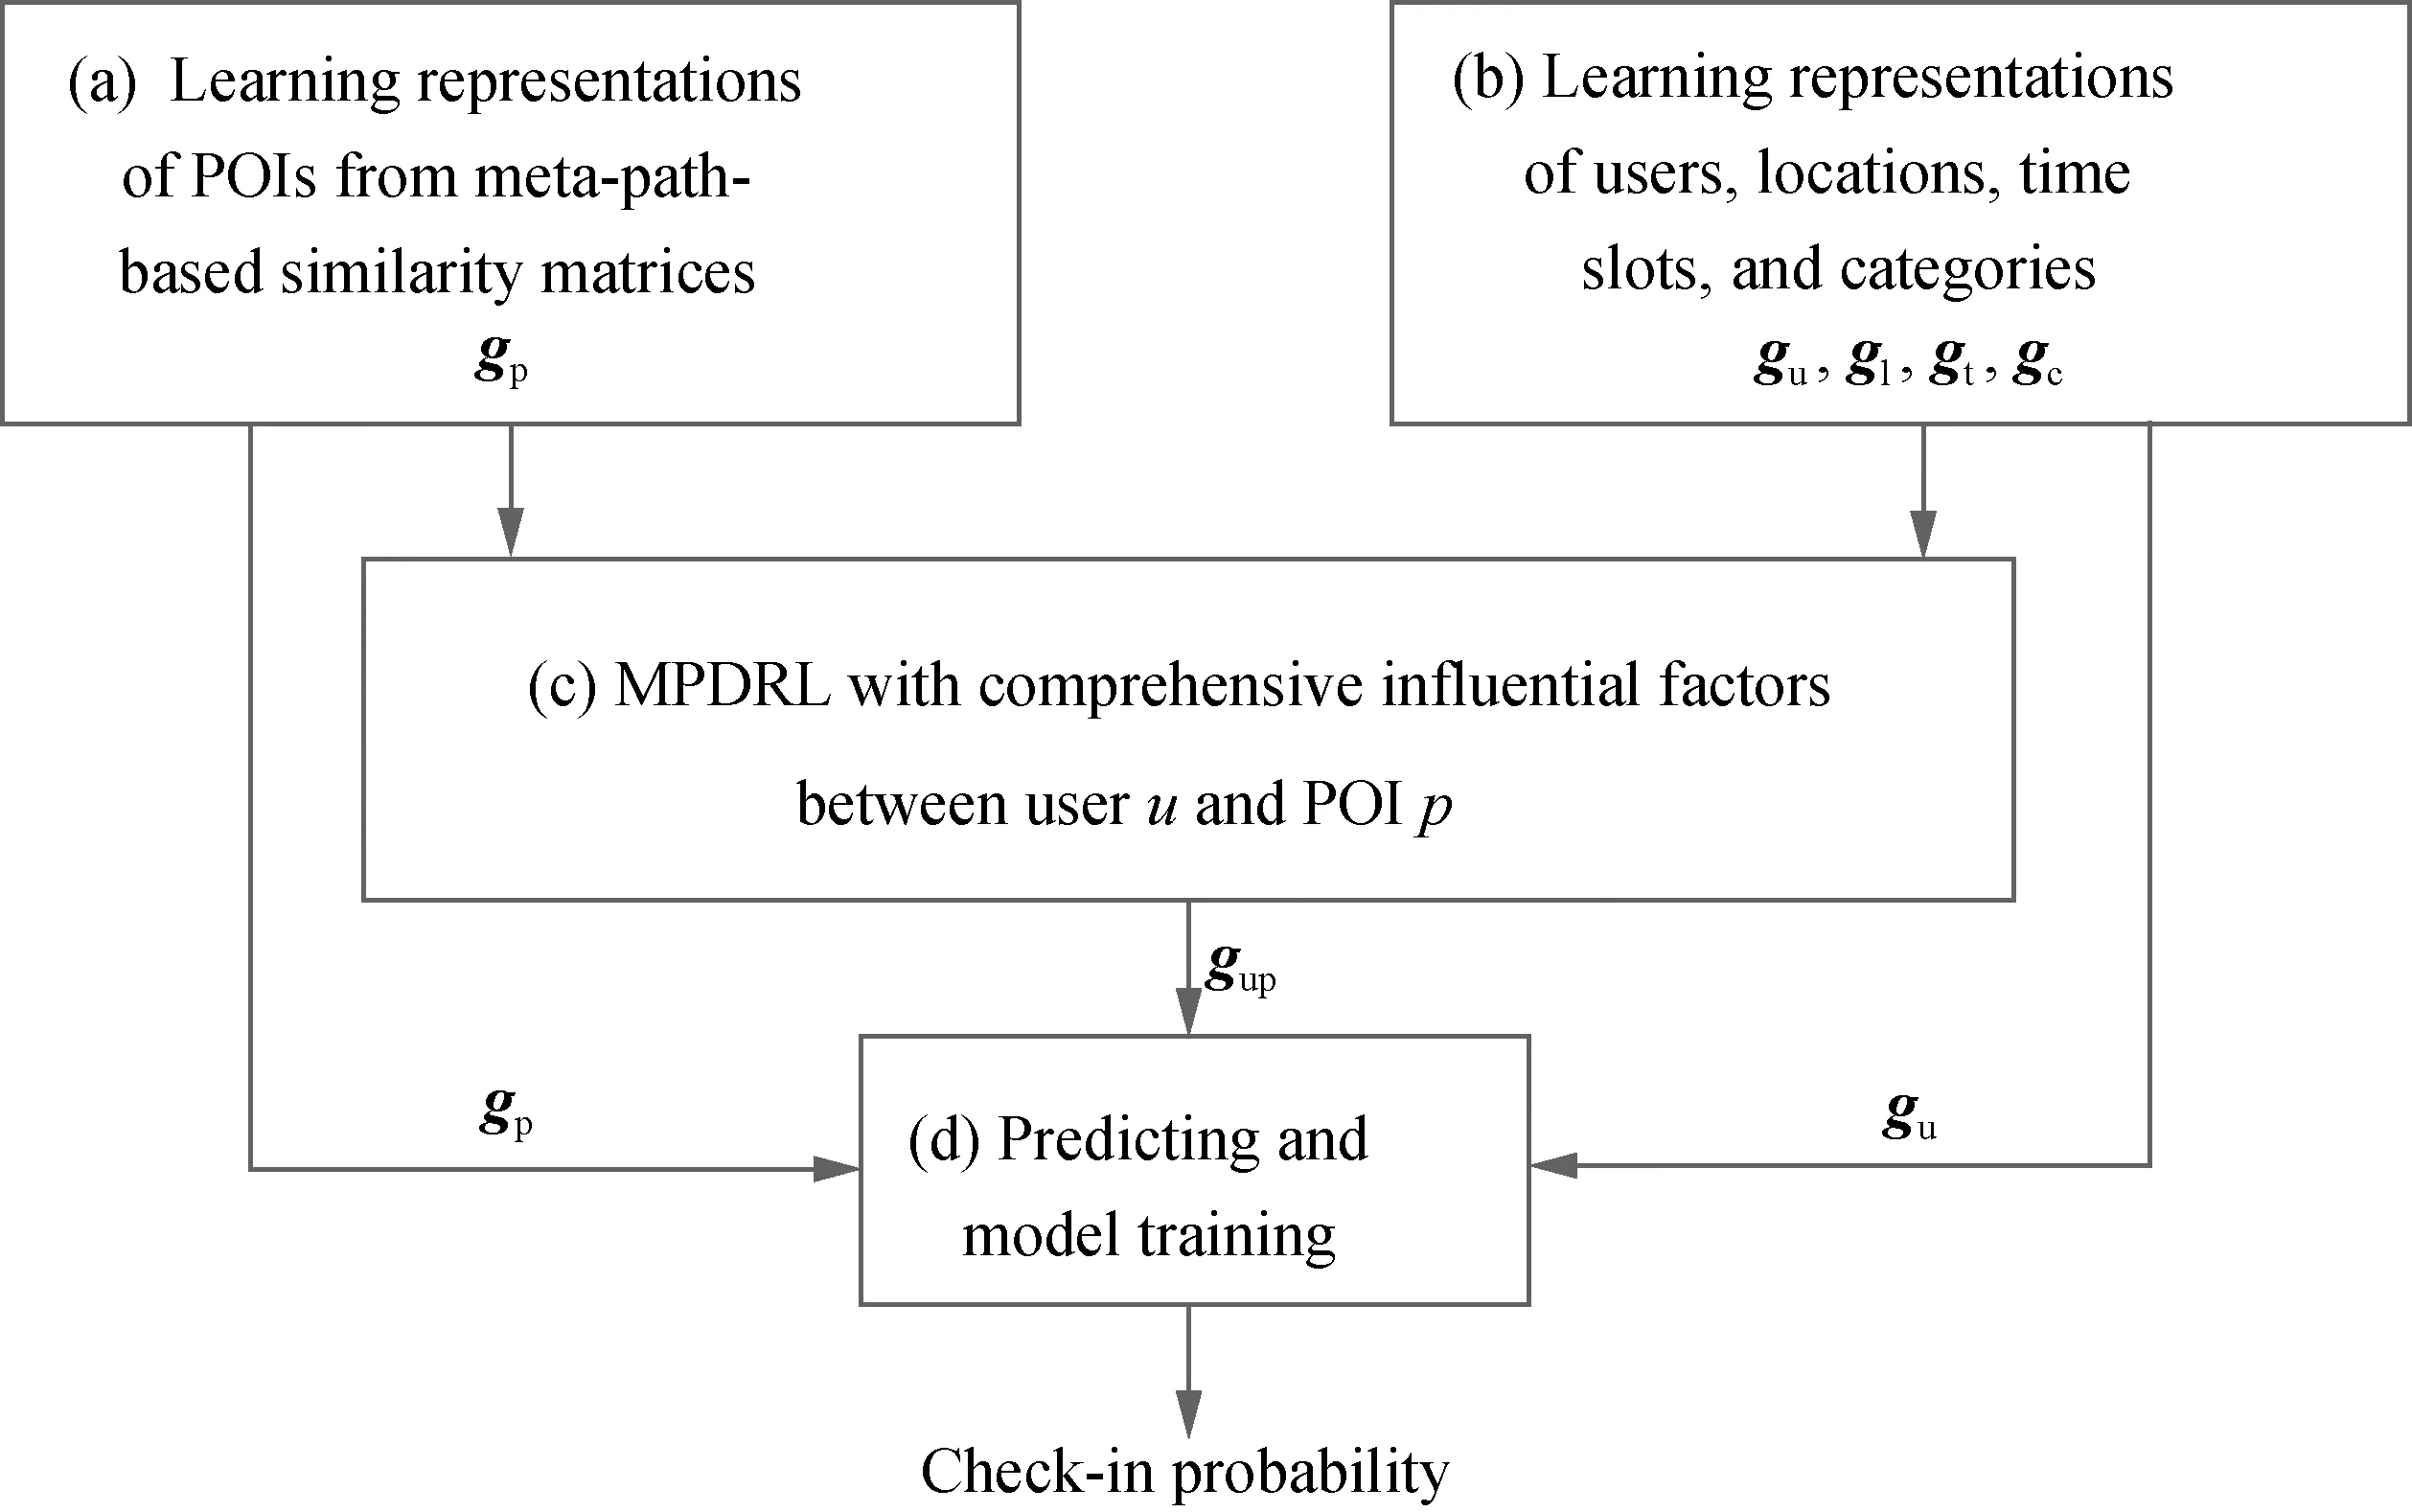
Fig. 2 MPDRL model
3.1 Learning representations of POIs from meta-path-based similarity matrices
An effective representation method for POIs is required to embody relationships between different POIs. Meta-paths in an HIN can capture the properties of objects and establish relationships between different objects. Intuitively, utilizing meta-paths which reflect the relationships between POIs is helpful to the representations of POIs.
In this paper, we first establish four meta-paths PLP, PTP, PCP, and PUP to learn the representations of POIs. First, if two POIs are located in the same city or district, a meta-path PLP will be established. For example, “Times Square” and “Wall Street” are located in the same city “New York”, which can be expressed as a path instance “Time Square — New York — Wall Street”. Obviously, the meta-path PLP indicates the geographical correlation between two POIs. Similarly, we establish meta-path PTP, PCP to capture the temporal and categorical correlations between two POIs. Furthermore, if different POIs are frequently visited by the same user, these POIs usually exist some latent correlations, such as belonging to the same category or locating nearby. So, we employ the meta-path PUP as the supplement of correlations. The utilized meta-paths and their meanings for POI representation are shown in Table 1.
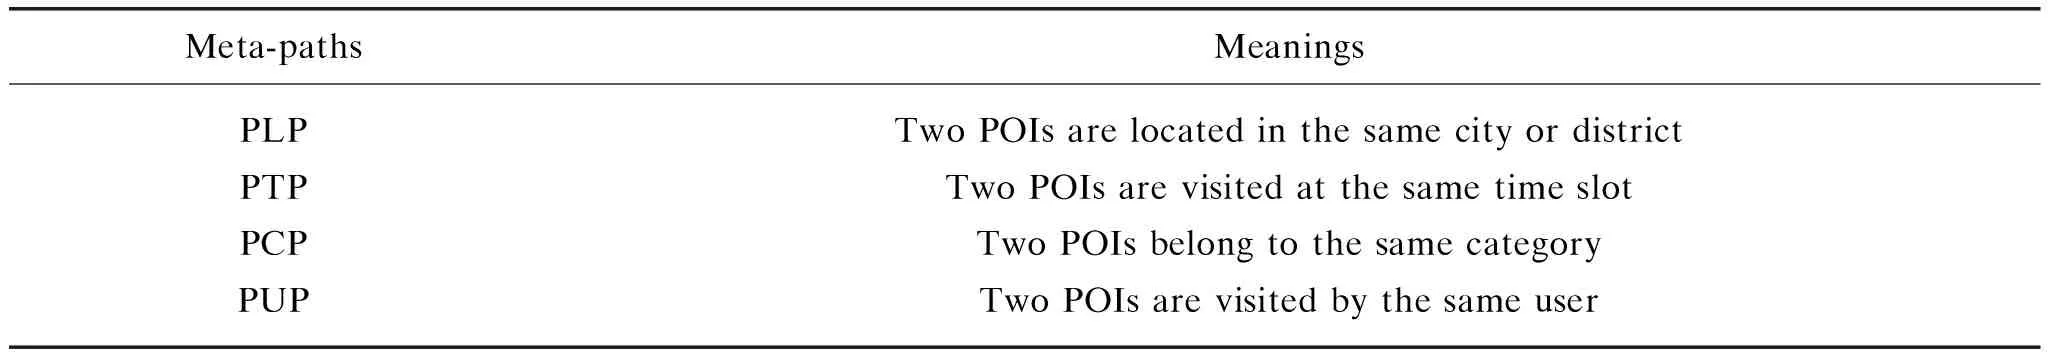
Table 1 Extracted meta-paths and meanings for POI representation
Based on the four meta-paths established above, we utilize PathSim[25]to calculate four similarity matrices between POIs under different meta-paths. Given a meta-path M, the similarity between a POIpiand a POIpjcan be defined as
(1)
wherempi→pjdenotes a path instance between POIpiandpj, |{mpi→pj:mpi→pj∈M}| denotes the number of path instances betweenpiandpjfollowing the meta-path M.|{mpi→pi:mpi→pi∈M}| and |{mpj→pj:mpj→pj∈M}| denote the total number of path instances between themselves following the meta-path M. Intuitively, two POIs are similar if they are connected by many path instances in the network. So, the numerator of Eq. (1) (i.e., the number of path instances between different POIs) is used to define the connectivity of POIs. However, the connectivity is biased to highly visible POIs (i.e., POIs associated with a large number of path instances). The visibility is defined as the number of path instances between themselves. So, the denominator of Eq. (1) (i.e., path instances between themselves) is used to balance the visibility. Overall, the similarity of POIs is defined in terms of two parts: their connectivity and the balance of their visibility.
Thus, based on the designed meta-paths PLP, PTP, PCP, and PUP, we can obtain four POI similarity matrices, denoted bySL,ST,SC, andSU, which respectively reflect the geographical, temporal, categorical, and co-visiting similarity among different POIs. These similarity matrices are of the same size |P|×|P|, where |P| denotes the number of all POIs. The value of each element in the similarity matrix is a positive real number belonging to[0, 1].
Then, since the dimension of the above similarity matrices is very high and many values in these matrices are small, we have to transform each above POI similarity matrix into a low-dimensional matrix, in which the crucial information of the similarity matrix is reserved. There are many popular dimension reduction techniques for matrices, such as non-negative matrix factorization (NMF), principal component analysis (PCA), and singular value decomposition (SVD). However, in the practical application, the data in the similarity matrices have real physical meanings, and the values are required to be non-negative. Because PCA and SVD usually have negative values in the decomposed matrix, which is not allowed for our similarity matrices. Thus, here we choose NMF to complete the dimension reduction. We use the similarity matrix of locationsSLas an example to show how to obtain the related low-dimensional matrix. Given the similarity matrixSL, the goal of non-negative matrix factorization is to factorizeSLinto a low-dimensional matrixQLthrough the following optimization
(2)
whereλis a regularization parameter. During the training, we utilize coordinate descent[26]to minimize Eq. (2) and optimizeQL. Once the training achieves convergence, we can obtain the decomposed matrixQL.
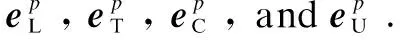
Thus, the representation of a POIpcan be defined as the concatenation of these four vectors, denoted bygp. We have
(3)
From Eq. (3), we can see that the representation of a POI incorporates the geographical, temporal, categorical, and co-visiting information.
3.2 Learning representations of users, locations, time slots, and categories
Since this paper mainly focuses on the recommendation task, a user’s representation should embody preference for POIs. Here we utilize a user’s check-in records to obtain a general representation of a user. Given a useruwith a set of visited POIsPu, the representation of a userucan be defined asgu, which can be calculated as
(4)
wherefpis the check-in frequency at POIp.
Similarly, for a locationl, we can obtain a set of POIs located at locationl, denoted byPl. Then, we aggregate these POIs’ representations to generate a representation vectorglfor locationl, which can be calculated as
(5)
For a time slott, we can obtain a set of POIs visited at this time slot, denoted byPt. Then, we can generate a representation vectorgtfor the time slott, which can be calculated as
(6)
For a categoryc, we can obtain a set of POIs belonging to this category, denoted byPc. Then, we can generate a representation vectorgcfor the categoryc, which can be calculated as
(7)
Through above definitions, we obtain the representations of users, locations, time slots, and categories. These representations will be used in the subsequent section.
3.3 MPDRL with comprehensive influential factors
In the previous sections, we have obtained the representations of POIs, users, locations, time slots, and categories through utilizing the rich HIN in LBSNs. Furthermore, we need to establish correlation between a user and a POI and obtain the correlation’s representation between the user and the POI.
(1) Since we concern on the correlation between a user and a POI, we have to find several meta-paths connecting the user and the POI to reflect the correlation from the perspective of geographical, temporal, categorical, and co-visiting relations. (2) We have to give a quantitative expression of the correlation between the user and the POI.
3.3.1Meta-pathsconnectingusersandPOIs
A user’s check-in records usually show the following characteristics.
(1) A user usually acts in geographically constrained areas and prefers to visiting POIs nearby those where the user checked in previously.
(2) A user’s check-in activities in LBSNs show an apparent periodic pattern from a macro perspective due to a fixed lifestyle.
(3) A user usually visits some categories of POIs more frequently due to the user’s personal preference.
(4) From check-in records, if two users have checked in some of the same POIs, they may have similar interests and would like to visit some other POIs which are also the same in the future.
Based on the above characteristics of check-in records, we design another four corresponding meta-paths (UPLP, UPTP, UPCP, and UPUP) to reflect the correlations between users and POIs. The meanings of these meta-paths are shown in Table 2.
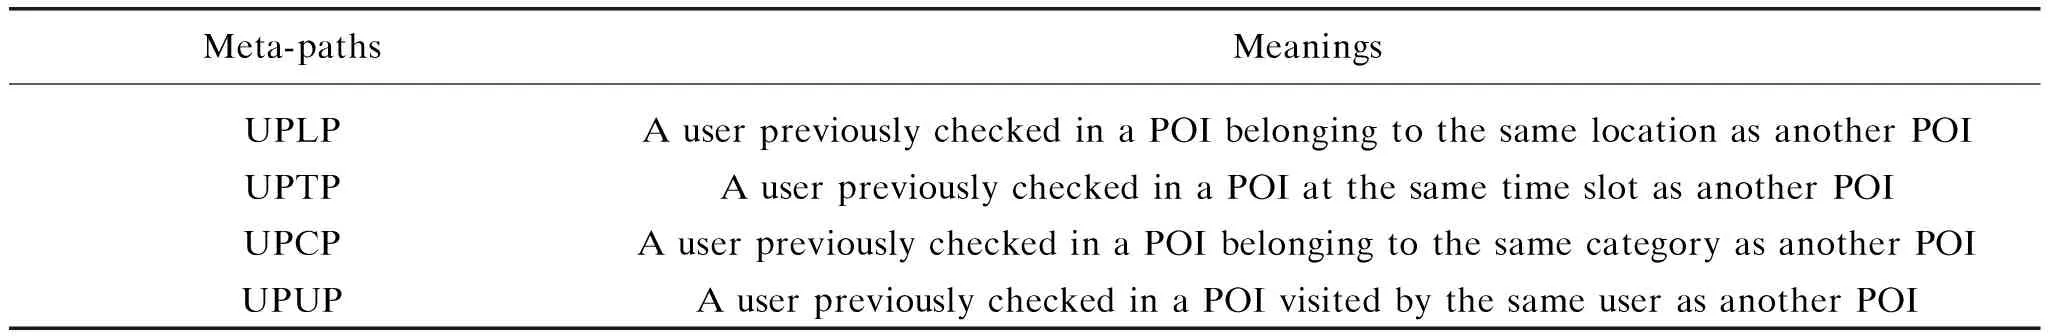
Table 2 Extracted meta-paths and meanings between users and POIs
3.3.2Correlation’srepresentationbetweenauserandaPOI
Given a user-POI pair, several path instances may exist between the user and the POI. The path instances under a type of meta-path are a group of node sequences with semantic meanings. The LSTM network is good at dealing with sequential data and has shown promising performance in some applications, like natural language processing (NLP)[27-28]. Here we utilize an LSTM network to process our meta-paths with semantic sequences to obtain the representation of the correlation between the user and the POI.
For a given user and POI, we first utilize an LSTM network to obtain the representation of the correlation between the user and the POI along a specific path instance connecting the user and the POI. Figure 3 illustrates an example of an LSTM network used in this paper. We letxkdenote the representation ofk-th object nodeakalong the sequence of a path instancem. The representations of object nodes have been given in section 3.1 and section 3.2. Given a path instancem=(a1a2…akak+1) connecting a user and a POI,k≤3, the LSTM network processes the type node in path instancemsequentially. Finally, we can obtain the correlation’s representation between the user and the POI under the path instance.
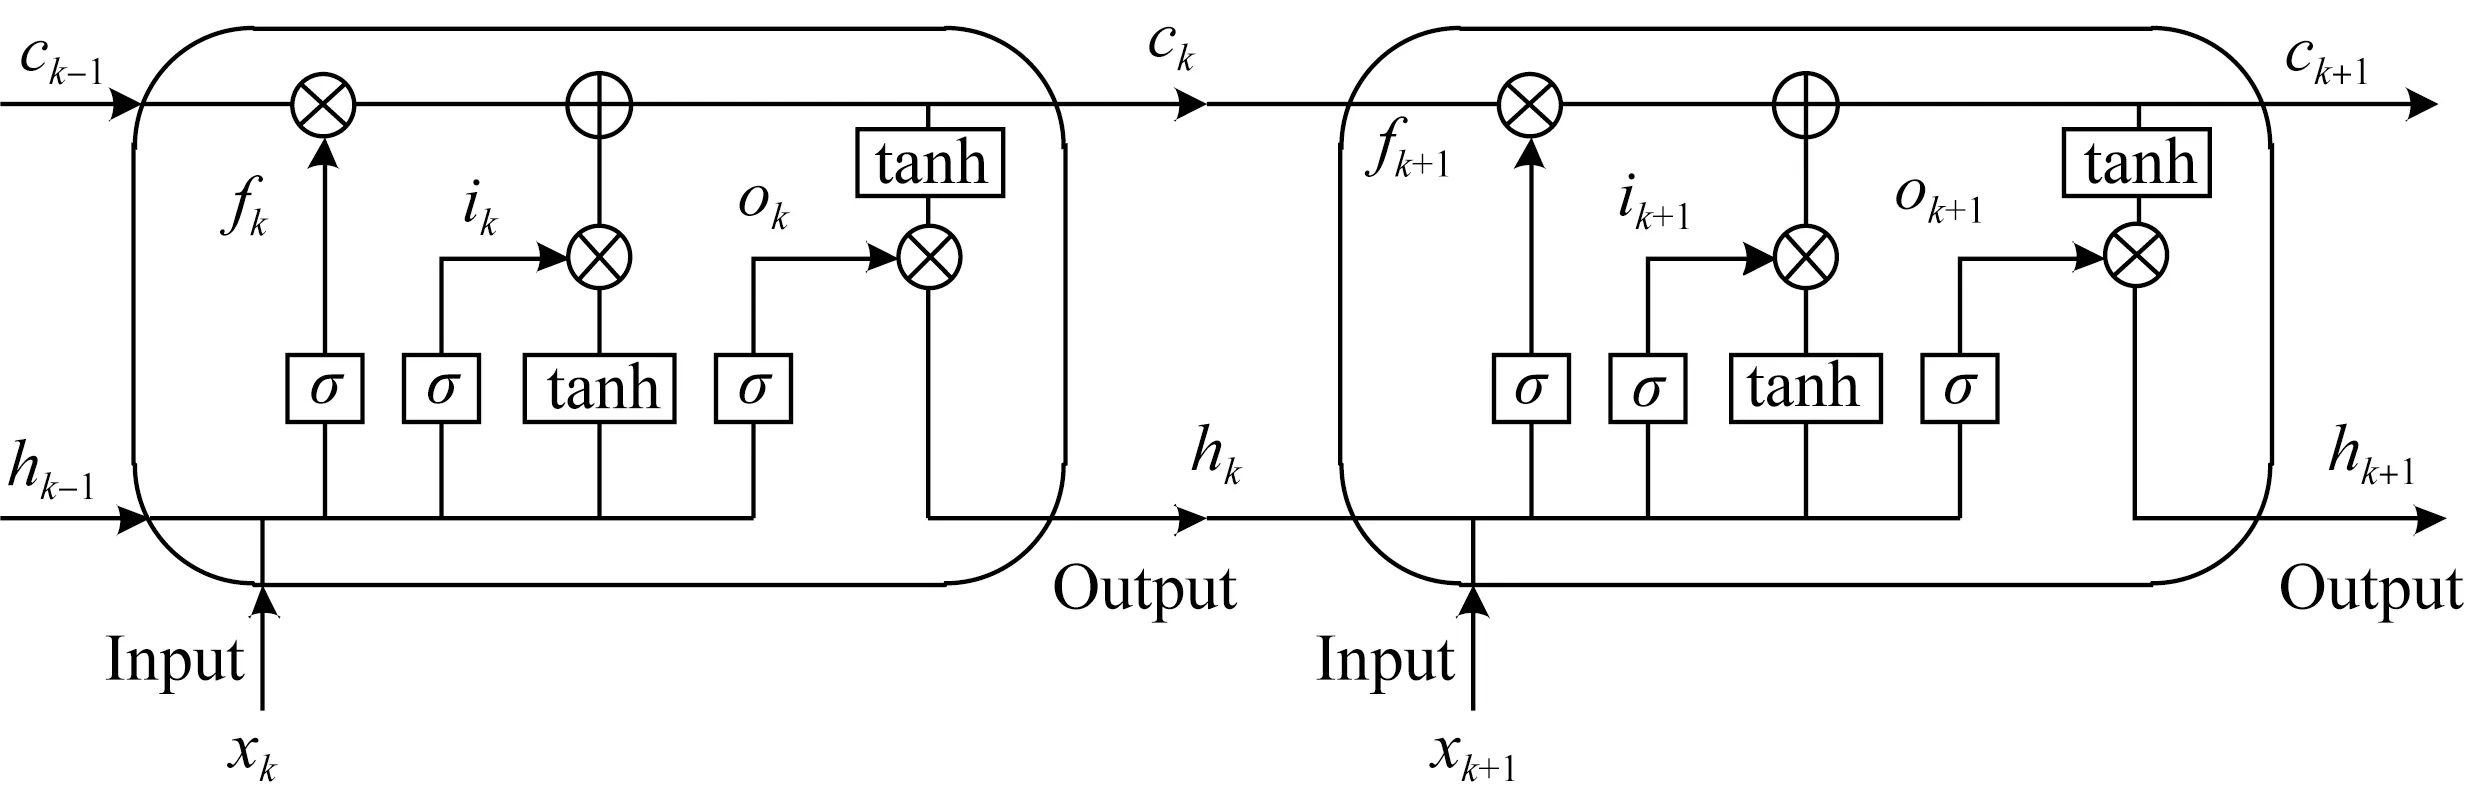
Fig. 3 Example of an LSTM network used in this paper
The basic unit of an LSTM network is an LSTM layer that has multiple LSTM cells. In Fig. 3, LSTM cells in the LSTM layer take the representations of object nodes along a path instance as the input. Herexkis the input ofkth LSTM cell in the LSTM layer. The cell stateckis the memory of thekth LSTM cell, which contains the state information of the previous LSTM cells. The hidden statehkrepresents the information obtained through further processingck. At the beginning,h0andc0are initialized to two zero vectors.
There are also three gates in an LSTM cell. As illustrated in Fig. 3, the forget gate,fkcontrols information in the cell state to be forgotten.fkcan be calculated as
fk=σ(Wf[hk-1,xk]+bf),
(8)
The input gateikselectively incorporates information from the inputxkand the previous outputhk-1to the cell state. Notationikcan be calculated as
ik=σ(Wi[hk-1,xk]+bi),
(9)
whereWiandbidenote the weight matrix and bias of the input gate respectively.
Notationokis the output gate that determines the information moving forward to the outputhk. It can be calculated as
ok=σ(Wo[hk-1,xk]+bo),
(10)
whereWoandbodenote the weight matrix and bias of the output gate respectively.σ(·) in Eqs. (8)-(10) maps the values between 0 to 1, where 1 means maintaining all information conveyed in the corresponding gate, while 0 means removing all the information.
Notationckis updated as Eq. (11), in which the forget gatefkand the input gateikselectively retain previous information and add new information to the cell state.
ck=fk*ck-1+ik*tanh(Wc[hk-1,xk]+bc),
(11)
whereWcandbcdenote the weight matrix and bias of the cell state respectively.
hk=οk*tanh(ck).
(12)
To sum up, given the previous outputhk-1and cell stateck-1, the current LSTM cell utilizes the input gateik, the forget gatefk, and the output gateοktogether to generate the next outputhkand cell stateck. By updating step by step, the output of the final LSTM cell can represent a path instance.


(13)
As mentioned in the introduction, not all influential factors have the same impact on a user’s specific check-in activity. Since different meta-paths can represent the impacts of different influential factors on useruvisiting POIp, we next explore the importance of different meta-paths on a user’s specific check-in activity. Here we design an attention layer to capture the different contributions of different meta-paths on a user’s specific check-in activity. We first introduce a preference vectorPupfor a user-POI pair (u,p). The preference vector measures the importance of different meta-paths on this check-in activity. The more important meta-paths should be assigned with higher attention scores. The preference vectorPupis a parameter learned during the training process.

(14)
(15)

(16)
wheregupcan carry the importance of different influential factors on a user’s specific check-in activity.
3.4 Predicting and model training
So far, given useruand POIp, we have the representations of useru, POIp, and the correlation between useruand POIp. Then, based ongu,gp, andgup, our goal is to approximate a function that can predict the check-in probability with the representations of users, POIs, and correlations. The MLP has been proved to be capable of approximating a mapping function and modeling complex relations[29]. Therefore, we adopt MLP to model the complex relations amonggu,gp, andgupto approximate a function that can predict the check-in probability. The MLP used in our model is constructed by an input layer, two hidden layers, and an output layer. We take the concatenation ofgu,gp, andgupas the input of the MLP, denoted by
g0=gu⊕gp⊕gup,
(17)
where ⊕ denotes the vector concatenation operation. Then, we utilize two hidden layers to model the interactions amonggu,gp, andgup. Forjth hidden layer,j=1,2, we have
(18)
(19)
whereWoutdenotes the weight matrix andboutdenotes the bias in the output layer.
We adopt the cross entropy loss as the loss function, which can be calculated as Eq. (20). To minimize the loss, we use the adaptive moment estimation (Adam) optimizer[30]and the backpropagation algorithm to update the parameters in our MPDRL model.
(20)

4 Experiments
In this section, we conduct experiments to compare our methods with several classical personalized POI recommendation methods on a real-world dataset. We evaluate the effectiveness of our proposed MPDRL model.
4.1 Experimental settings
4.1.1Datasets
In this paper, we perform our evaluation on the Foursquare[31]dataset. This dataset contains 241 407 check-in records published by 3 046 users among 9 231 POIs from December 2009 to July 2013 in California, USA. Each check-in record includes a user ID, a POI ID, and a time-stamp, where each POI has its location and category. The basic statistics of the dataset are shown in Table 3.
In our experiments, we take the first 80% of a user’s check-in records as the training set (including 10% as the validation set), the last 20% as the test set.
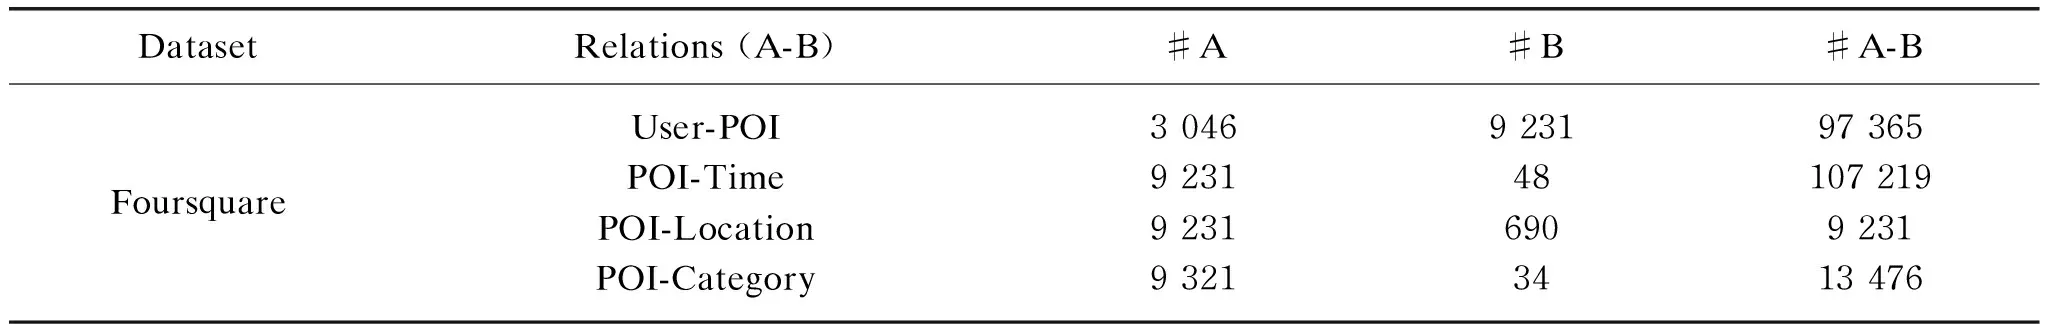
Table 3 Statistics of the dataset
4.1.2Metrics
To evaluate the performance of our proposed model MPDRL, we adopt two metrics widely used in top-Nrecommendation, including Pre@Nand Rec@N, whereNdenotes the number of POIs in the recommendation list of each user. The Pre@Nrepresents the percentage of correctly predicted POIs in the recommendation list of a user. The Rec@Nrepresents the percentage of correctly predicted POIs in the testing dataset. The formal definitions of Pre@Nand Rec@Nare given as
(21)
(22)
4.2 Baselines
We evaluate the performance of MPDRL by comparing it with four classical personalized POI recommendation methods.
(1) User preference, social influence and geographical influence based recommendation (USG)[3]. USG is an improved user-based collaborative filtering recommendation framework.
(2) POI-to-vector representation method (POI2Vec)[13]. POI2Vec is a latent representation model that jointly captures the POI sequential influence and user preference. It incorporates the geographical influence of POIs into the framework of Word2Vec[23](a classical word vector generation technique for natural language processing developed by Google) to learn the latent representations of POIs.
(3) Graph-based embedding model (GE). It jointly learns the embeddings of POIs, locations, time slots and adopts a linear combination of these influential factors.
(4) Neural network based collaborative filtering (NCF)[17]. In addition, the MLP is used to learn the non-linear interaction function for users and POIs.
(5) Meta-path-based context for recommendation (MCRec)[21]. MCRec is an HIN-based method which leverages meta-path-based context for top-Nrecommendation. The meta-path-based information is extracted by the convolution neural network and the representation of users and POIs are obtained from jointly learning during the training process. To compare with our model fairly, we implement it with the same meta-paths used in our model.
4.3 Parameter settings
We implement the experimental evaluation on the PyTorch platform and adopt the Adam optimizer to optimize the model. According to Ref. [32], reasonable values of regularization parameterλrange between 0 and 0.1. In our experiment, we test the following values 0.001, 0.005, 0.010, 0.050, 0.100 forλin Eq. (2) and obtain the optimal effect ofλ=0.001. The dimension valueqof the decomposed matrix in Eq. (2) is set to 16. The experimental test on the dimension valueqis given in section 4.6.1. All biases are initialized to 0 and weight matrices are initialized with Kaiming Uniform. The initial learning rate of Adam optimizer is set to 0.001, which is suggested in Ref. [30]. In fairness, all models achieve the best performance at appropriate parameter settings.
4.4 Performance comparisons with baselines
Figure 4 shows the performance (Pre@Nand Rec@N) of MPDRL and comparative approaches on the Foursquare dataset. Clearly, our proposed model MPDRL always achieves better performance than comparative approaches in terms of both precision and recall. Specifically, MPDRL at least outperforms USG, POI2Vec, GE, NCF, and MCRec, in terms of the metric Pre@N, by 71.12%, 59.55%, 54.22%, 45.19%, and 16.97% respectively. As for the metric of Rec@N, MPDRL at least outperforms USG, POI2Vec, GE, NCF, and MCRec by 69.08%, 55.57%, 44.97%, 41.30%, and 23.55% respectively.
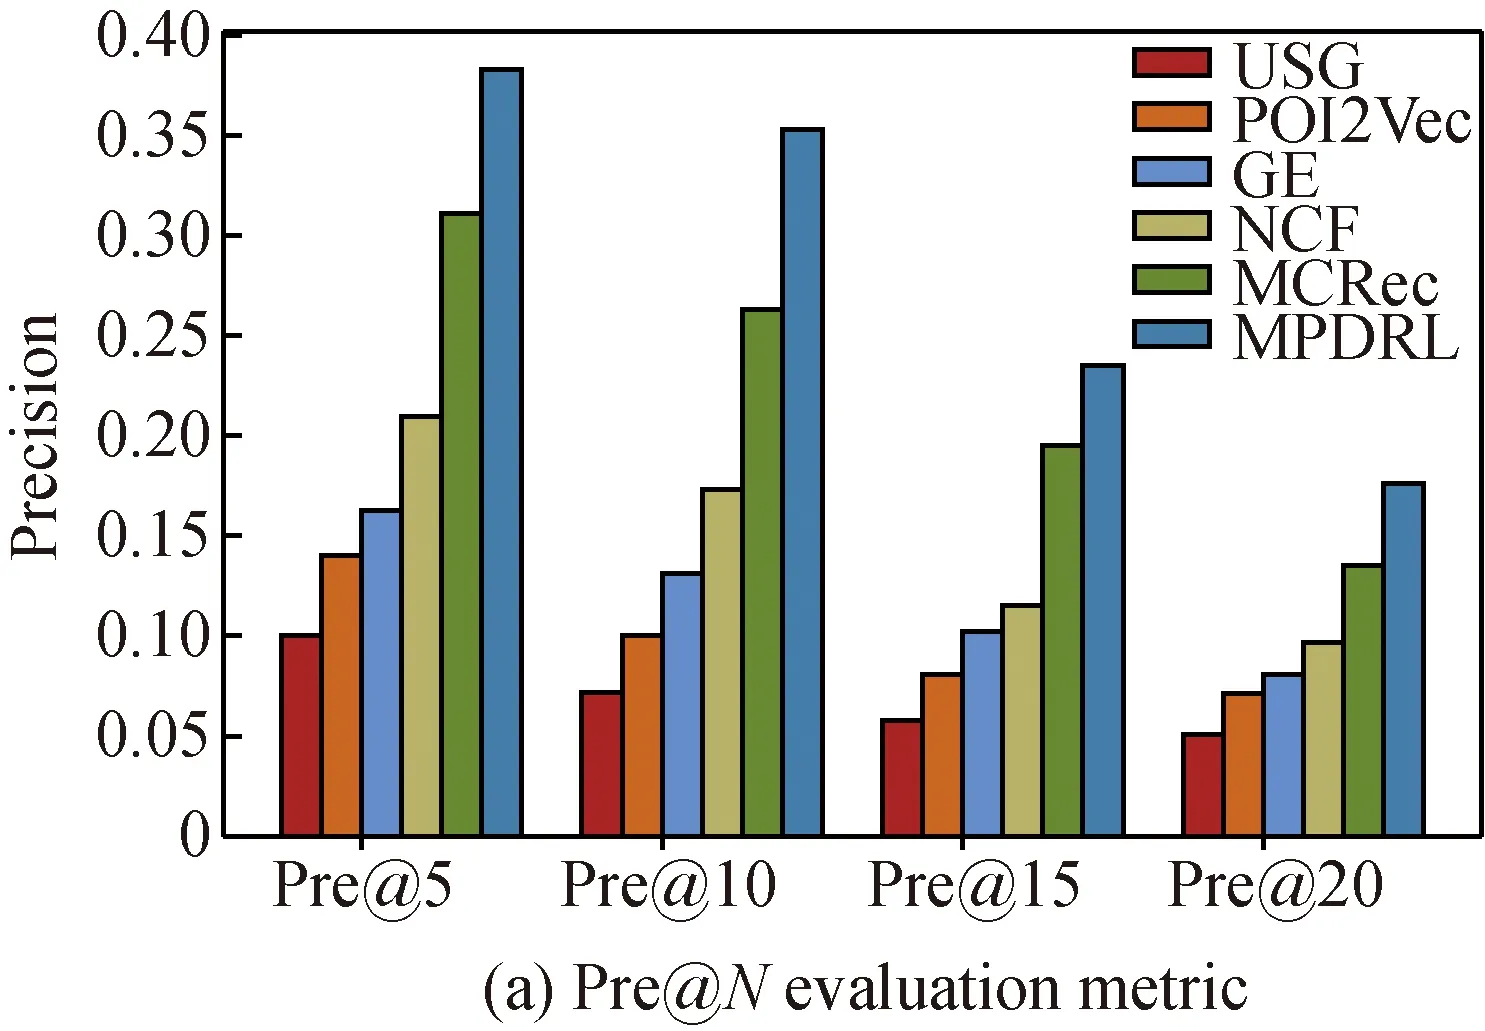
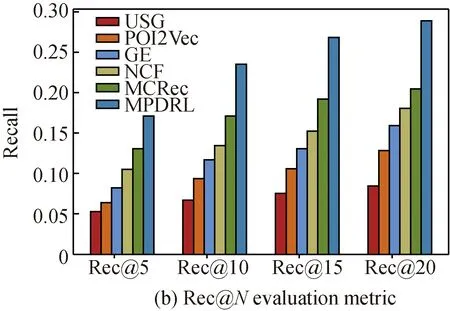
Fig. 4 Comparisons with baselines on the Foursquare dataset
Several observations are obtained from Fig. 4. (1) MPDRL and MCRec achieve much better performance than other comparative approaches, which verifies the advantage of utilizing meta-path-based information in LBSNs. Compared with MCRec, MPDRL achieves improvements at least 16.97% for all metrics. The representations of POIs and users in MPDRL are learned from meta-path-based similarity matrices, which fully utilize heterogeneous information in LBSNs. Moreover, MPDRL utilizes an attention-based LSTM network to deeply mine the correlation between users and POIs, which further improves the recommendation performance. (2) It is worth noting that NCF achieves the third best performance. This proves the effectiveness of hidden high-level features extracted by the deep neural network compared with hand-crafted features. However, NCF still performs worse than MPDRL at least 41.30% for all metrics because NCF only utilizes the user-POI check-in matrix. (3) Although GE and POI2Vec both utilize the embedding learning technique, GE performs better than POI2Vec. This is reasonable because GE utilizes more heterogenous information while POI2Vec only utilizes geographical information. (4) USG performs the worst in all comparative approaches. This is because USG uses common distributions to model users’ preference, social influence, and geographical influence. A common distribution is hard to model the personalized influence for different users. This simple feature extraction engineering brings limited improvements under a very sparse (99.83%) user-POI check-in matrix.
4.5 Performance evaluation on three variants
Based on the previous section, the overall performance comparison demonstrates the effectiveness of our proposed model MPDRL. To further understand the working mechanism of MPDRL, we carry out experimental evaluation on three variants of MPDRL in this section.
(1)MPDRL-Rand. It is a variant of MPDRL, which replaces the meta-path-based representation method for POIs and users with random initialization.
(2)MPDRL-MLP. It is a variant of MPDRL, which removes the LSTM network and straightly takes the representations of POIs and users as the input of MLP to predict the check-in probability.
(3)MPDRL-Ave. It is a variant of MPDRL, which replaces the attention mechanism that models different importance of influential factors on a user’s specific check-in activity with an average sum of influential factors’ representations.
We also use Pre@Nand Rec@Nas experimental evaluation metrics withNbeing 5, 10, 15, 20. The experimental results are shown in Fig. 5. We can observe MPDRL outperforms all variants in all metrics. Specifically, MPDRL at least outperforms its variants MPDRL-Rand, MPDRL-MLP, and MPDRL-Ave, in terms of the metrics Pre@N, by 34.57%, 8.50%, and2.91%. As for the metrics Rec@N, MPDRL at least outperforms MPDRL-Rand, MPDRL-MLP, and MPDRL-Ave by 30.68%, 13.23%, and 6.40%.
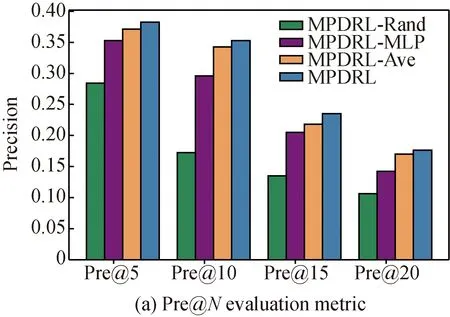
Fig. 5 Evaluation on three variants of MPDRL
For these variants, we find that the performance of MPDRL-Rand is significantly inferior to the other two variants. The main difference between MPDRL-Rand and MPDRL is the representation method of POIs and users. The representations of POIs and users in MPDRL-Rand are randomly initialized and jointly learned during the training process. MPDRL incorporates geographical, temporal, categorical, and co-visiting information into the representations of POIs and users. This result indicates that fully utilizing heterogeneous information in LBSNs can greatly improve the recommendation performance. In addition, we find that MPDRL-Ave shows better performance than MPDRL-MLP. MPDRL-MLP straightly feeds the representations of POIs and users into MLP to predict the check-in probability, ignoring the correlation between a user and a POI in LBSNs. MPDRL-Ave feeds the representations of POIs, users, and an average sum of different influential factors’ representations into MLP to predict the check-in probability. MPDRL-Ave achieves better performance compared with other two variants, but still worse than MPDRL by 4.66% in all metrics on average. This reflects that distinguishing the importance of different influential factors on a specific check-in activity is helpful to further improve the recommendation performance.
4.6 Tests on some impacts
4.6.1Impactofdimension
Here, we investigate the impact of the decomposed matrix’s dimension valueqin Eq. (2). Table 4 shows the performance of MPDRL with different values ofq. From the results, we observe that the recommendation performance of MPDRL is not very sensitive to the dimension value. At first the recommendation performance increases with the value ofq, and then drops down gradually whenqis larger than 16. Hence,q=16 is used in this paper.
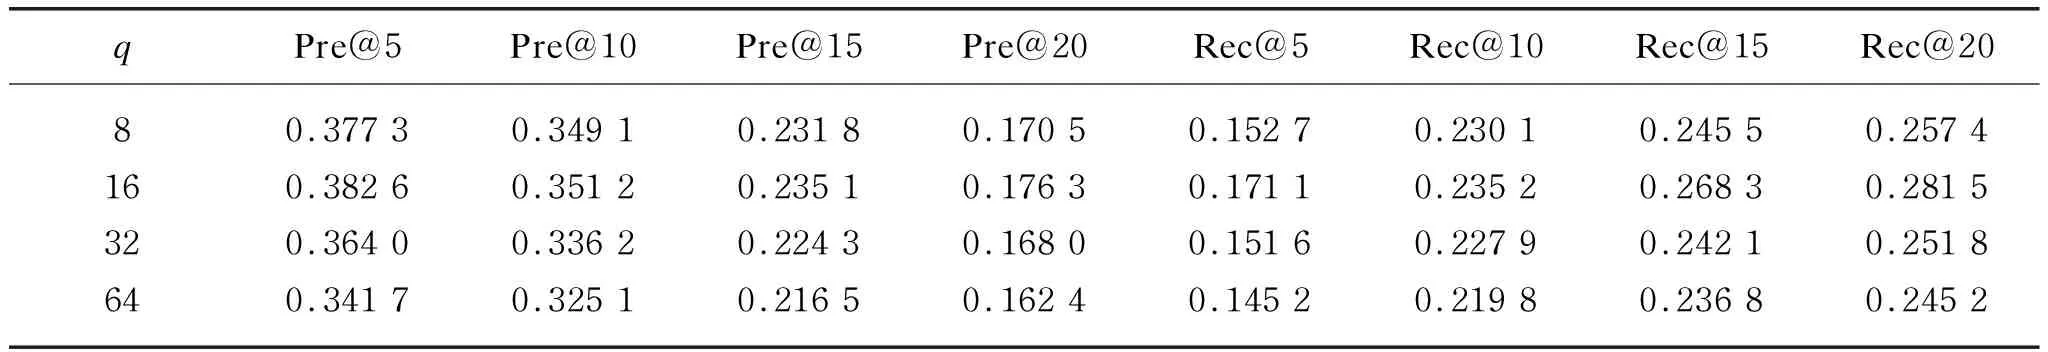
Table 4 Impact of dimension
4.6.2Impactofmeta-paths
To analyze the impacts of different meta-paths on the recommendation performance, we gradually incorporate our designed meta-paths into MPDRL. Table 5 shows the performance of MPDRL when gradually incorporating meta-paths. The symbol “+” in Table 5 means that a new meta-path is added based on the previous one. As a whole, the performance of MDPRL improves with the incorporation of more meta-paths. We can also observe that different meta-paths have different impacts on the recommendation performance. From Table 5, we can find that +UPCP and +UPLP have greater influence on the recommendation performance than the other two meta-paths. This is because, when incorporating UPCP, the average growth rates of MPDRL are 5.57% and 6.41% in terms of the metric Pre@Nand Rec@Nrespectively; when incorporating UPLP, the average growth rates of MPDRL are 4.53% and 6.67% in terms of the metric Pre@Nand Rec@Nrespectively. The average growth rates of performances in +UPCP and UPLP are higher than in +UPUP and +UPTP. This result can be explained by the fact that most users’ check-in activities are more susceptible to personal interest and geographic locations.
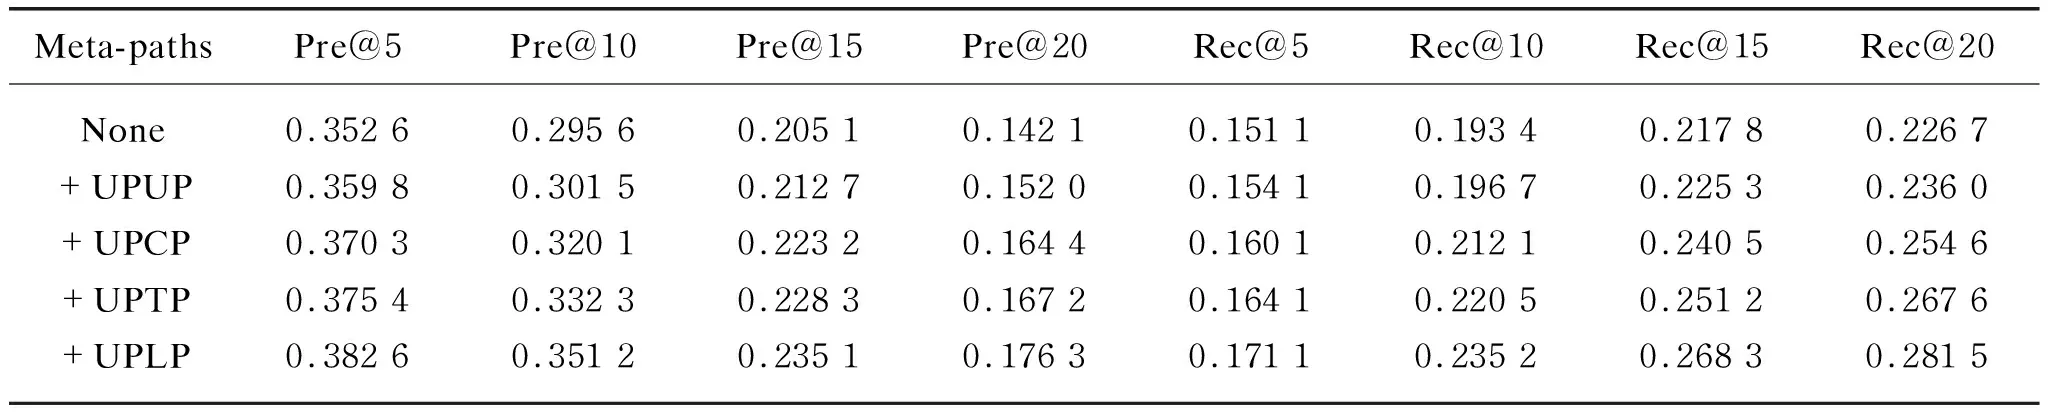
Table 5 Impact of meta-paths
5 Conclusions
This paper proposes an MPDRL model for personalized POI recommendation. We propose a meta-path-based representation method to incorporate heterogeneous information in LBSNS such as geographical, temporal, and categorical information. Besides, to further improve the recommendation performance, we design an attention-based LSTM network to deeply mine the correlations between users and POIs. Extensive experiments demonstrate that our proposed MPDRL model can achieve the best performance compared with the popular methods. In the future, we will consider how to automatically select more appropriate meta-paths in LBSNs for POI recommendation.
杂志排行

Journal of Donghua University(English Edition)的其它文章
- Long Text Classification Algorithm Using a Hybrid Model of Bidirectional Encoder Representation from Transformers-Hierarchical Attention Networks-Dilated Convolutions Network
- Influence Mechanism of Clothing Anchor Features on Consumers’ Purchase Intention
- Estimating Mechanical Vibration Period Using Smartphones
- Effects of Eco-Friendly Carrier on Low-Temperature Dyeing of Recycled Polyester Knit Fabrics
- Application Research on K/S Value in Determination of Reactive Dyes Fixation Rate
- Influence of Fe2O3 on Release Mechanism of NH3 and Other Nitrogen-Containing Compounds from Pyrolysis of Three Typical Amino Acids in Urban Sludge