TOD typology: A review of research achievements
2021-10-21BianYangLiLingHanTangshanJiaDazhi
Bian Yang Li Ling Han Tangshan Jia Dazhi
(Beijing Key Laboratory of Traffic Engineering, Beijing University of Technology, Beijing 100124, China)
Abstract:To comprehensively and systematically review the research achievements of transit-oriented development (TOD) typology, a total of 41 papers were collected from the Scopus and Web of Science Core Collection databases. These papers were analyzed by bibliometric indicators, in adopting VOSviewer software to draw graphical visualizations. A review of international and domestic research progress in TOD typologies was conducted. The results indicate that the number of published papers has increased over time. Luca Bertolini is the most contributive author, and the top three contributing organizations are Queensland University of Technology, the University of Amsterdam, and the University of Lisbon. The United States is the most active source country, followed by the Netherlands and Australia. TOD typology methods were analyzed from the aspects of principles, indicators, advantages, and disadvantages and their applications. In recent years, domestic scholars have paid attention to the importance of TOD typologies and applied them in different urban contexts to facilitate the TOD development in China. The understanding of the TOD typology research progress is helpful for developing context-based TOD typology approaches.
Key words:transit-oriented development (TOD); literature review; bibliometrics; VOSviewer
With the rapid development of urbanization and motorization,urbanization problems have become increasingly prominent, such as the disorderly spread of urban lands and inefficient traffic operations. Therefore, the interactive relationship between transportation and land use should be understood. In 1959, Hansen’s research showed that heavily accessible areas were more likely to be developed compared to remote areas[1]. Subsequently, the land-use transport feedback cycle was proposed, which attracted some scholars to this area of research[2-3]. In the 1990s, disordered and sprawling suburbanization in the United States brought a series of urban problems, which raised various planning concepts, such as smart growth and new urbanism. Peter Calthorpe, one of the leading New Urbanists, put forward the concept of transit-oriented development (TOD) in his bookTheNextAmericanMetropolis[4], which linked land use to transportation planning in essence, promoting urban function agglomeration in transit systems.
Although the definition of TOD seems to be the same in all contexts,the research presents no “one-size-fits-all” approach to TOD development[5-6]. Scholars have attempted to classify TOD into various characteristics of stations and surrounding areas. Each type of station area possesses similar characteristics, which diagnose existing problems and support urban planners in proposing targeted improvements for specific stations. Currently, several articles have offered reviews related to TOD typologies, including studies[6-8]on specific subjects and even TOD review[9]. However, they emphasize the development of context-based TOD typologies or tend to be wider with respect to themes. Thus, it is difficult to grasp the research progress of TOD typology in more detail. Accordingly, this article attempts to provide a comprehensive, systematic, and up-to-date review of TOD typology research achievements.
In recent years,bibliometrics has been commonly used to analyze the development of specific themes or journal topics, such as connected and autonomous vehicles[10], city logistics[11], and shipboard decision support systems[12]. To celebrate the anniversaries of certain journals, numerous studies have used bibliometrics to analyze previous achievements[13-15].
In this study,various bibliometric indicators are adopted to explore influential papers and leading authors, organizations, and countries in the field of TOD typologies. Then, bibliometric networks are computed and visualized through the VOSviewer software. Finally, research progress in the field of TOD typologies is reviewed.
1 Methods
1.1 Data source
The Scopus database covers a variety of literature sources, such as journal papers, conference papers, and series books[16]. As keywords for our search, we entered “TOD” and “typology” into the Scopus database. Thirty-two documents were obtained, including articles, conference papers, reviews, and book chapters. Due to the small number of documents found, the Web of Science Core Collection, which mainly includes articles and conference papers, was used to retrieve data again, as it is a database commonly used for bibliometric analysis[16]. As a result, nine documents were obtained. After manually excluding repeat documents and those not related to TOD typologies (e.g., air quality and key success factors of TOD best practices), a total of 26 documents were collected, with the last data update conducted on June 23, 2020. After identifying highly cited papers referenced in these works, a total of 41 documents were obtained for the bibliometric analysis.
1.2 Analytical methods and tools
Bibliometrics is a science focused on the quantitative analysis of the literature and is distinct from scientometrics and informetrics in terms of research objects and purposes[17]. Bibliometrics selects formal scientific or information exchange literature as research objects, including books, journals, and electronic publications. It can be used to effectively evaluate a specific field’s development. Multiple bibliometric indicators, such as the total number of papers (TP), total number of citations (TC), citations per paper, andHindex[13], were considered to evaluate the research of certain countries, institutions, and scholars in the field of TOD typologies. The present study also adopts indicators, such as citations per year and the number of papers with equal to or more than 100, 50, and 10 citations.
We used the VOSviewer software developed by Van Eck and Waltman from Leiden University in the Netherlands in our bibliometric analysis[18]. The program draws from the relationships between literature knowledge units to create knowledge maps using a similarity matrix and VOS mapping techniques[18]. These tools are not discussed in depth in this paper due to limited space. The VOSviewer software can create three types of visualizations: network, overlay, and density visualizations. Multiple functions, such as co-occurrence, co-authorship, and bibliographic coupling, were implemented to reveal relationships between authors, keywords, and cited references.
2 Statistical Analysis
2.1 Publication and citation structure
2.1.1 Analysis of annual papers
The number of papers published in a given area reflects trends in that field. Within the scope of our search, papers focused on TOD typologies first appeared in 1996. Fig.1 illustrates the number of papers on TOD typologies published from 1996 to 2020 and shows that the number has increased over time.
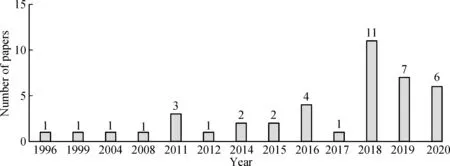
Fig.1 Annual number of papers
2.1.2 Influential papers
Influential papers are determined by the total number of citations, reflecting the influence of articles. Tab.1 presents the ten most frequently cited papers, among which the top two were published by L. Bertolini in 1996 and 1999, receiving 153 and 131 total citations and 6.12 and 5.95 citations per year, respectively. The former work[19]focuses on the integration of nodes and places and different redevelopment strategies, whereas the other[20]examines the relationships between nodes and places in Amsterdam and Utrecht railway stations. The newest paper listed in Tab.1 was published by Higgins and Kanaroglou in 2016[21]and has generated a total of 39 citations and 7.8 citations per year. This paper uses a latent class analysis to classify 372 existing and planned rapid transit stations in the Toronto region[21]. The paper with the most frequent citations per year was published by Kamruzzaman et al. in 2014[6]. In this paper, a two-step cluster analysis was used to classify census collection districts (CCDs) in Brisbane, Australia, where the mode choice behaviors of individuals verify typologies[6].
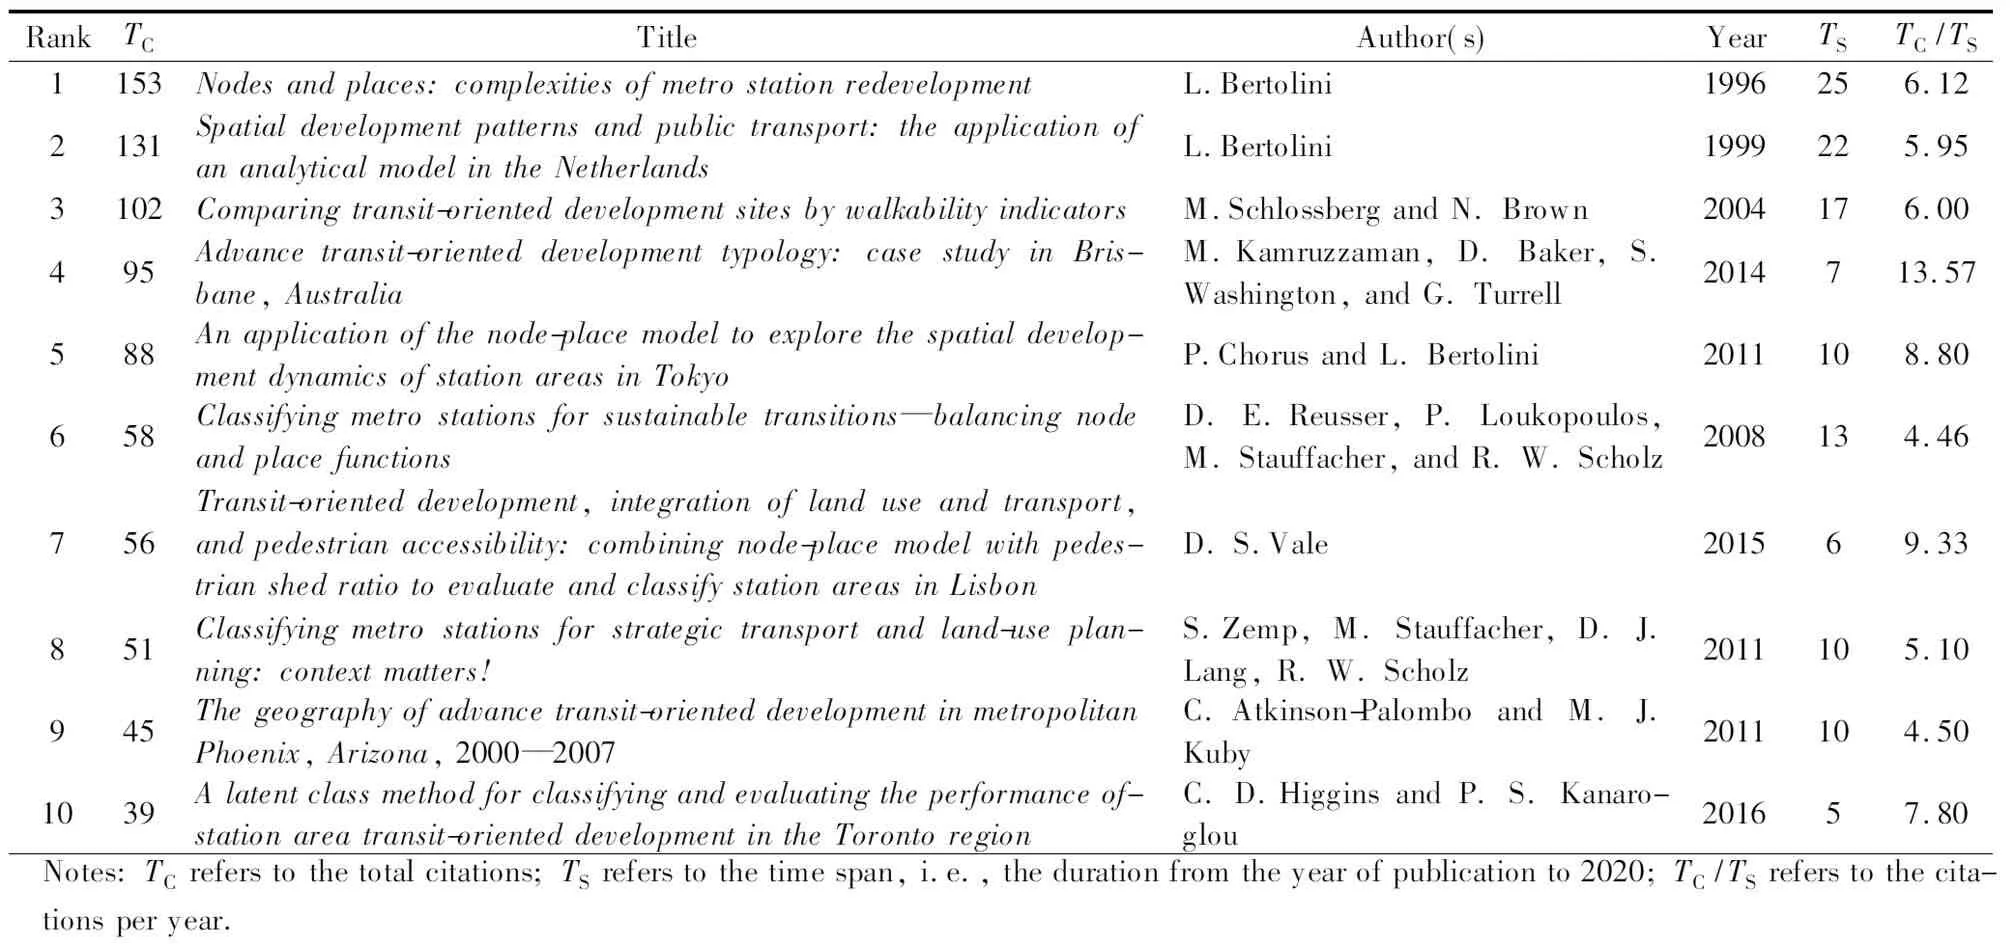
Tab.1 Ten most frequently cited published papers
2.2 Leading authors, organizations, and countries/regions
2.2.1 Leading authors
Aided by the VOSviewer software, Tab.2 presents the top 10 leading authors in the field of TOD typologies by theTP, listing the authors’ names, current or latest affiliations, and nationalities. It depicts the contributions of these authors in different bibliometric indicators, such as the total number of citations (TC), citations per paper (TC/TP),Hindex, and the number of papers with equal to or more than 100, 50, and 10 citations. The author with anHindex ofnindicates that more thannof the author’s articles have been cited at leastntimes. If more than one author has the sameTPvalue, then the author with a higherTCvalue ranks higher.
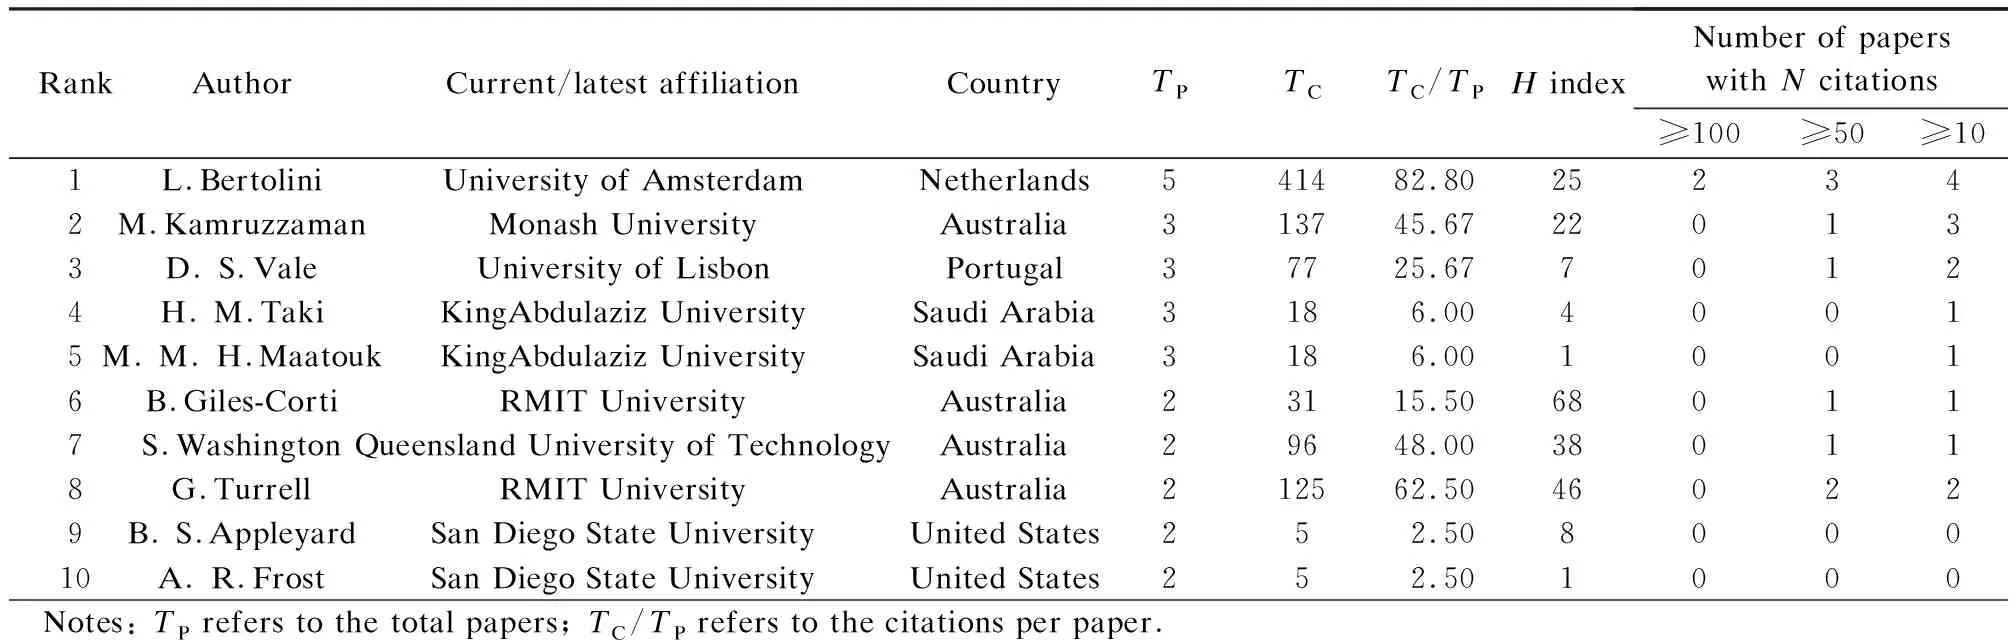
Tab.2 Top 10 leading authors with the most papers published
L.Bertolini of the University of Amsterdam leads the list in three categories (total papers (5), total citations (414), and citations per paper (82.80)), whereas B. Giles-Corti of RMIT University leads the list in theHindex category. Five authors have more than 20 citations per paper. L. Bertolini has published two papers with more than 100 citations. In terms of the number of papers with more than 50 or 10 citations, Bertolini is also the most influential, with three and four papers, respectively. In addition, three authors on the list have anHindex of more than 30. Tab.2 shows that the most influential authors are mainly from Australia.
2.2.2 Leading research organizations
The aggregation of thousands of researchers contributes to influential organizations in specific fields. After introducing major authors, this section identifies the main organizations in the field of TOD typologies. Tab.3 lists the top 10 organizations based on theTPand the organizations’ countries,TCvalues, and citations per paper.
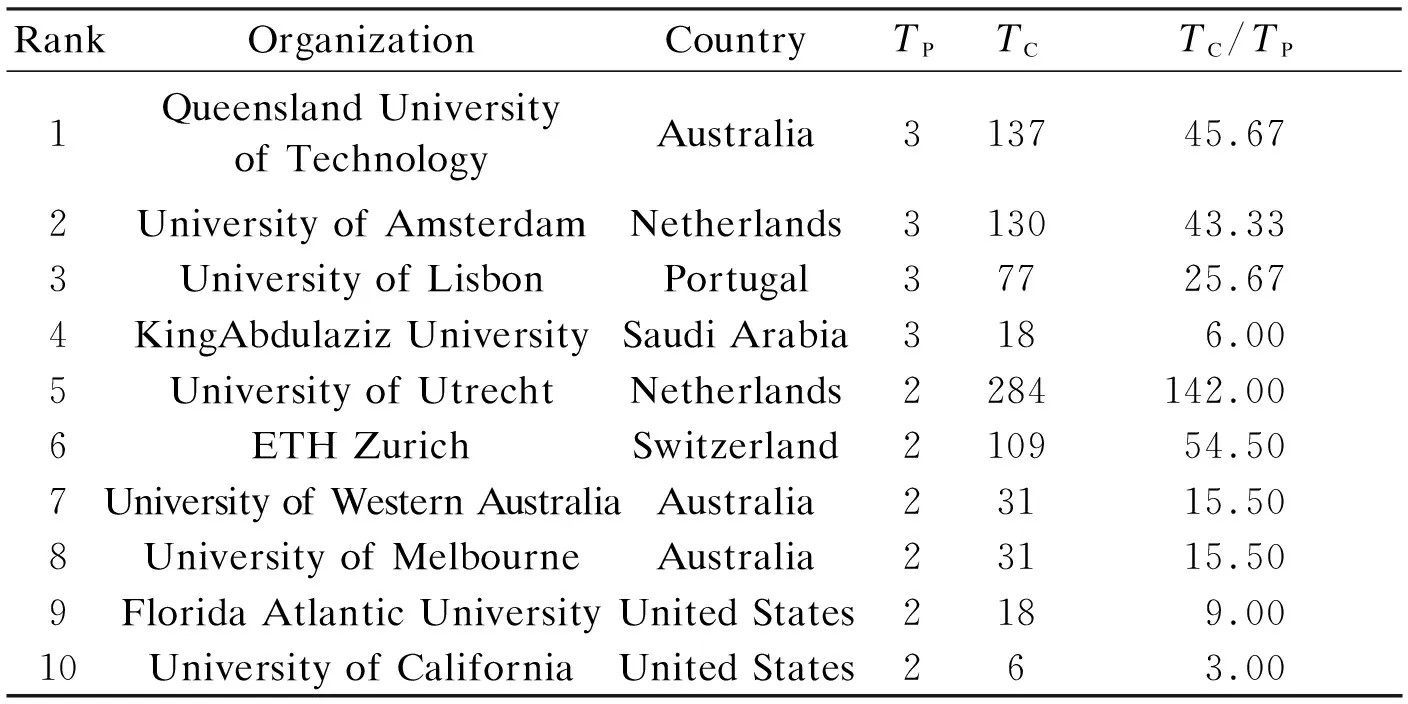
Tab.3 Ten Organizations with the Most Papers Published
Tab.3 demonstrates that the top three organizations are Queensland University of Technology, the University of Amsterdam, and the University of Lisbon, each with aTPvalue of 3. Among them, Queensland University of Technology has a total of 137 citations and 45.67 citations per paper, the University of Amsterdam has 130 citations and 43.33 citations per paper, and the University of Lisbon has 77 citations and 25.67 citations per paper. Australia dominates the top 10 leading organizations with three universities listed, followed by the United States and the Netherlands. Other organizations, such as the University of Lisbon, are the only entries from their countries listed in Tab.3.
Interestingly, the affiliations of four of the top five most contributing authors listed in Tab.2 correspond to three of the top four leading organizations shown in Tab.3. The affiliations of authors listed in Tab.2 are related to the organizations shown in Tab.3. Indeed, of the three papers contributed by Queensland University of Technology, two (2/3=66.67%) were written by S. Washington. All three papers contributed by the University of Amsterdam were coauthored by L. Bertolini and colleagues, whose organizations are the University of Amsterdam and the University of Naples Federico Ⅱ. Similarly, the three papers contributed by the University of Lisbon were coauthored by D. S. Vale and colleagues, whose organizations are the University of Lisbon, Ghent University, and Vrije Universiteit Brussel. All three papers from King Abdulaziz University were coauthored by H. M. Taki and M. M. H. Maatouk, whose organization is King Abdulaziz University. The University of Utrecht of the Netherlands, which ranked fifth in Tab.3, takes the lead in terms of the total citations (284) and citations per paper (142) (due to the high citations (414) and citations per year (82.80) of L. Bertolini).
2.2.3 Leading countries/regions
In ranking leading countries on total papers, Tab.4 presents the top 10 most productive countries in the field of TOD typologies. In terms of the total papers, the United States, the Netherlands, and Australia are ranked as the top three countries. The United States is the most contributive country with eight papers, followed by the Netherlands with seven papers and Australia with five. The three countries rank the highest on the list forTC. In terms ofTC/TP, seven papers from the Netherlands received 422 citations, resulting in 60.29 citations per paper, the highestTC/TPvalue found for all countries, followed by Switzerland with 54.50 citations per paper. Other countries with highTC/TPvalues of over 20 include the United States (22) and Australia (27.80).
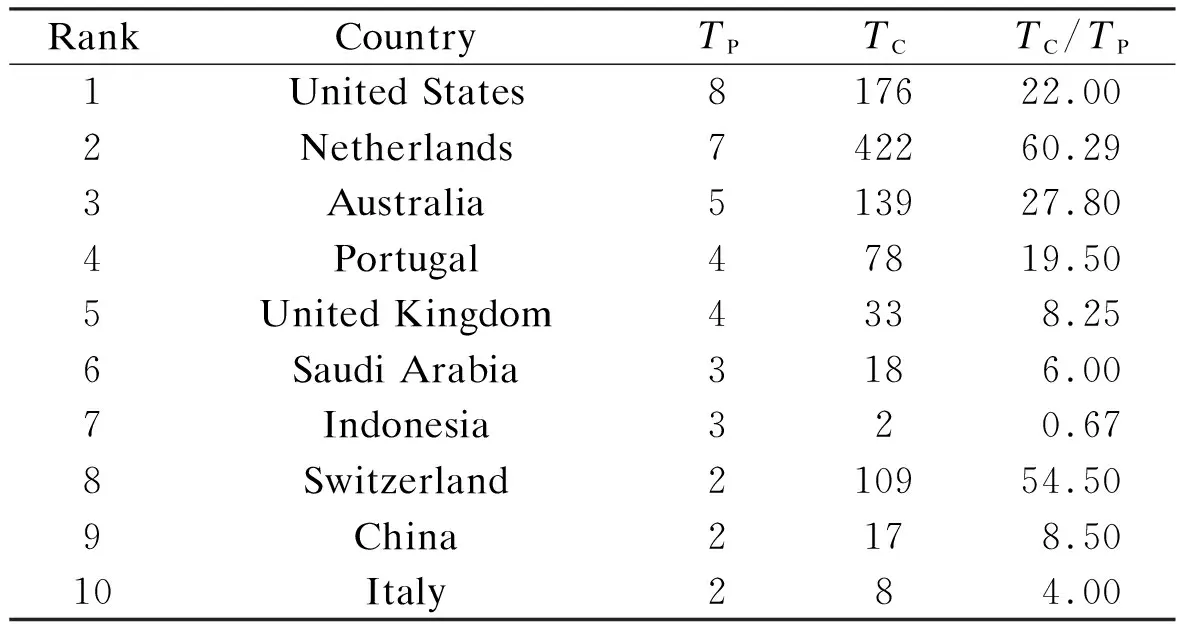
Tab.4 Ten countries with the most papers published
2.3 Co-occurrence of author keyword analysis
To analyze the bibliographic materials more thoroughly, a graphical visualization of the co-occurrence of author keywords using VOSviewer is presented in Fig.2. Author keywords are keywords that appear below abstracts, reflecting the focuses of papers. The co-occurrence of author keywords embodies the relatedness of authors in terms of the number of papers in which they occur together. Note that the figure considers a minimum threshold of two occurrences of author keywords. According to Fig.2, “TOD,” “node-place model,” and “TOD typology” are the three keywords used most frequently. The keywords can be divided into three main clusters: cluster 1 (red) stresses planning and urban design in TOD, cluster 2 (green) is mainly related to the application of the node-place model in station areas, and cluster 3 (blue) mainly adopts clustering techniques, such as latent class analysis and self-organizing maps, to develop TOD typologies. In addition, Fig.2 reflects the emphasis of the study areas on railway and metro stations.
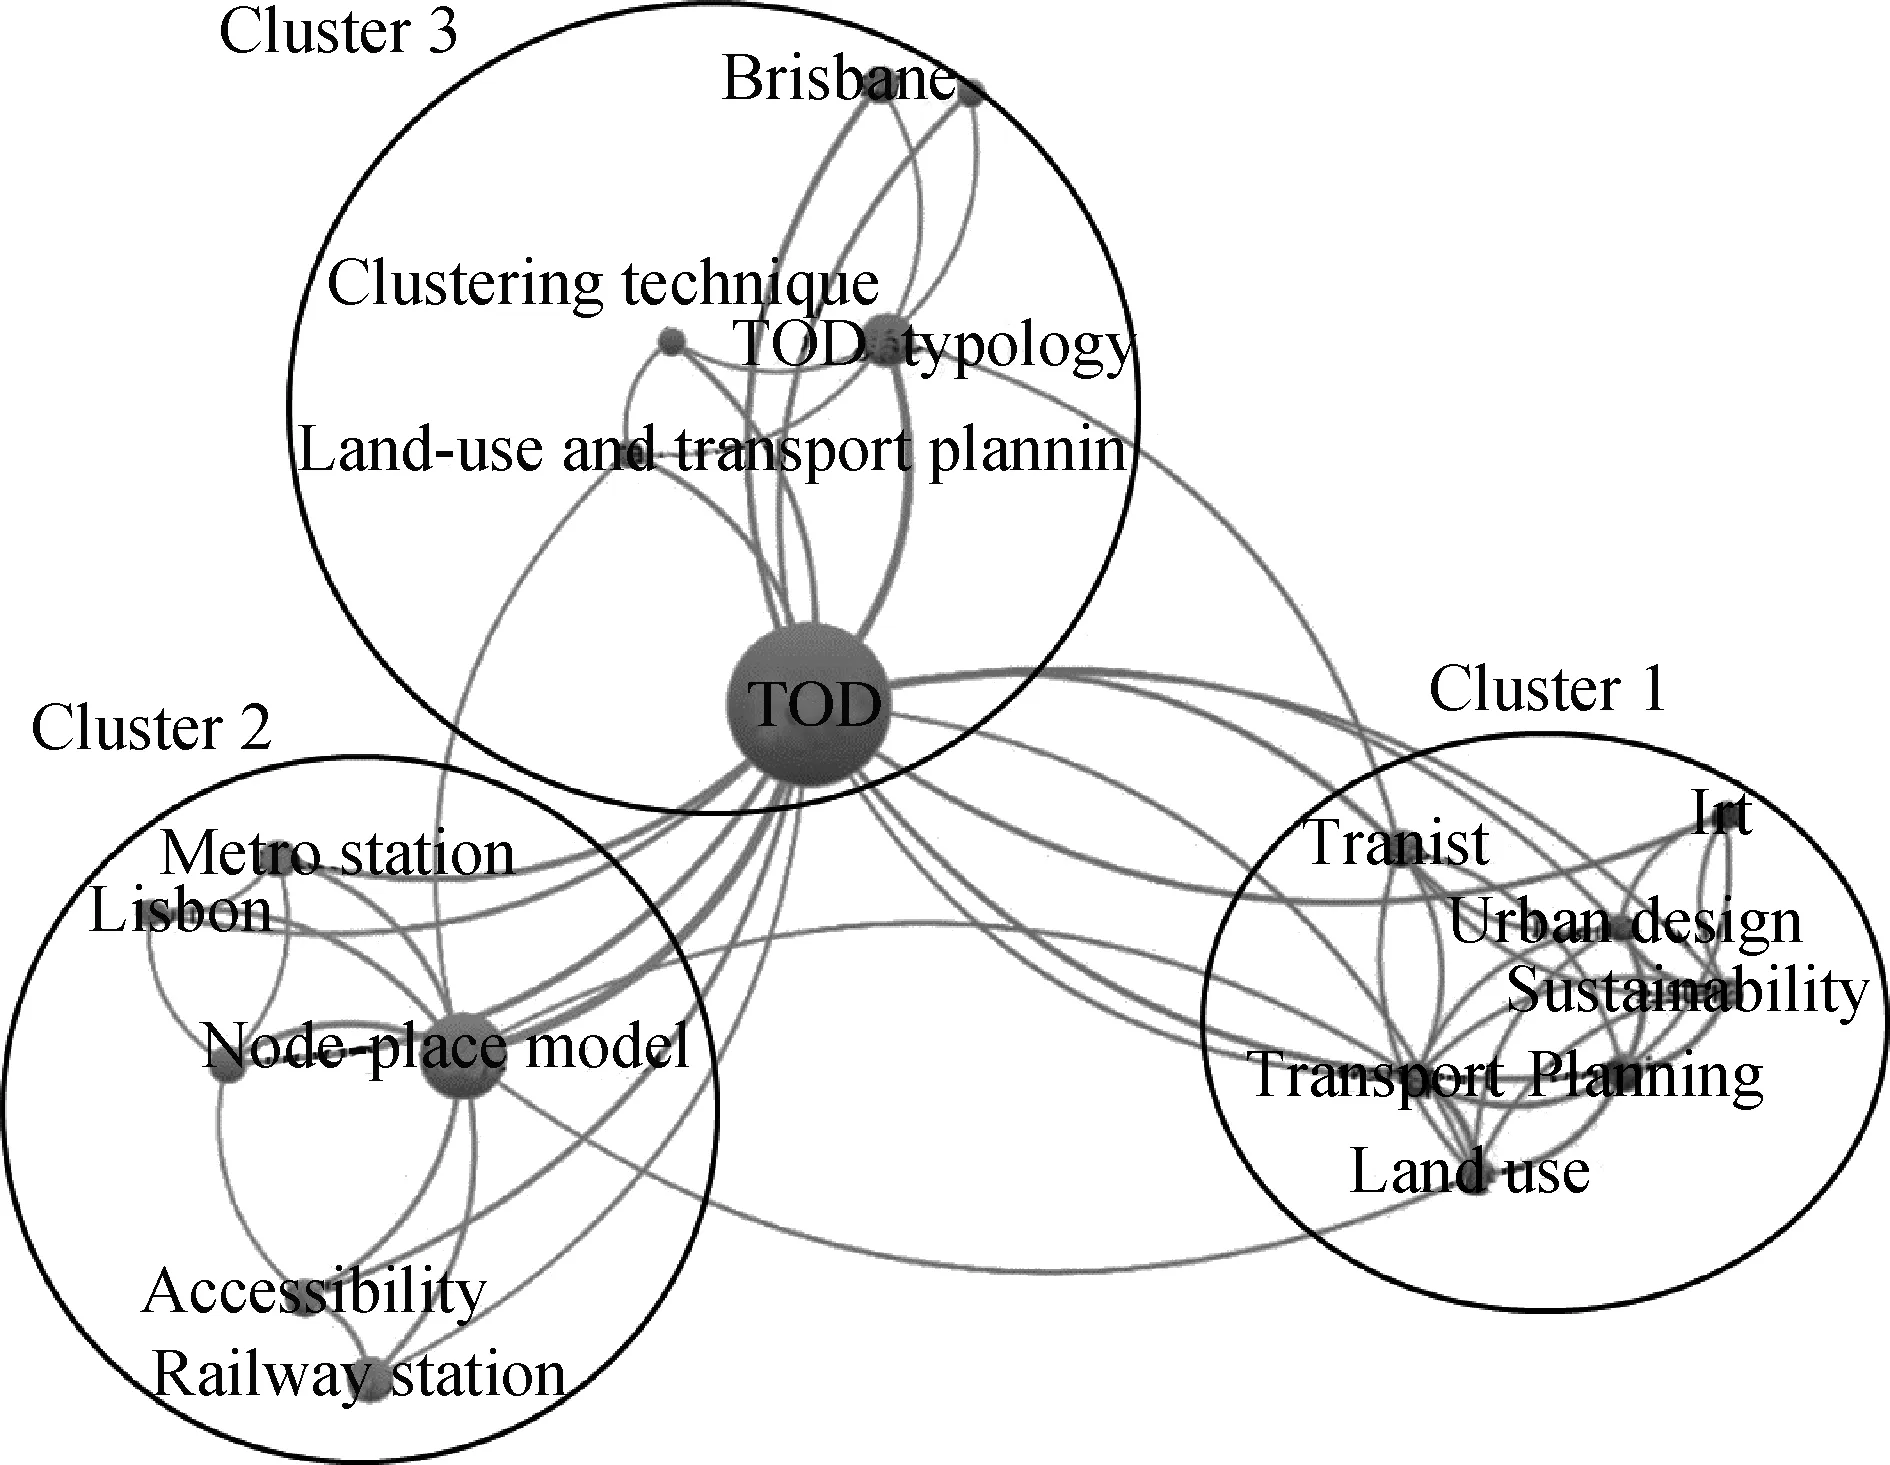
Fig.2 Co-occurrence of author keywords
3 International Research Progress on TOD Typologies
A TOD typology is the grouping of study areas covering a similar set of morphological and functional characteristics[22]to guide urban planning and design. This area adopts two main approaches: qualitative description and quantitative approaches. The former involves classification based on the spatial location and functions of an area, whereas the latter involves the classification by quantitative approaches using the node-place model (including the modified node-place model) and clustering techniques. Fig.3 demonstrates the research progress of three methods, i.e., qualitative description, node-place modeling, and clustering. The development of these methods is explored in the following sections.
3.1 Qualitative description
3.1.1 Basic types
In 1993, Calthorpe classified TOD areas into two basic categories, namely, urban TOD and neighborhood TOD, according to relationships to transit[4]. The former occurs on arterial lines of regional public transport with higher levels of development intensity and mixed land-use functions. The latter occurs off the arterial lines of public transport and is connected to arterial lines through public transport feeder lines, serving surrounding areas.
3.1.2 Development based on basic types
With the development of the TOD concept, some research has developed TOD typologies in the context of TOD for different regions. In 2004, Dittmar and Ohland[23]analyzed case studies to further detail urban and neighborhood TOD from the perspective of regional functions. The region is classified into six types: urban downtown, suburban center, urban neighborhood, suburban neighborhood, neighborhood transit zone, and commuter town center. These various areas have different characteristics in terms of land use, residential features, regional accessibility levels, public transport modes, and frequency levels.
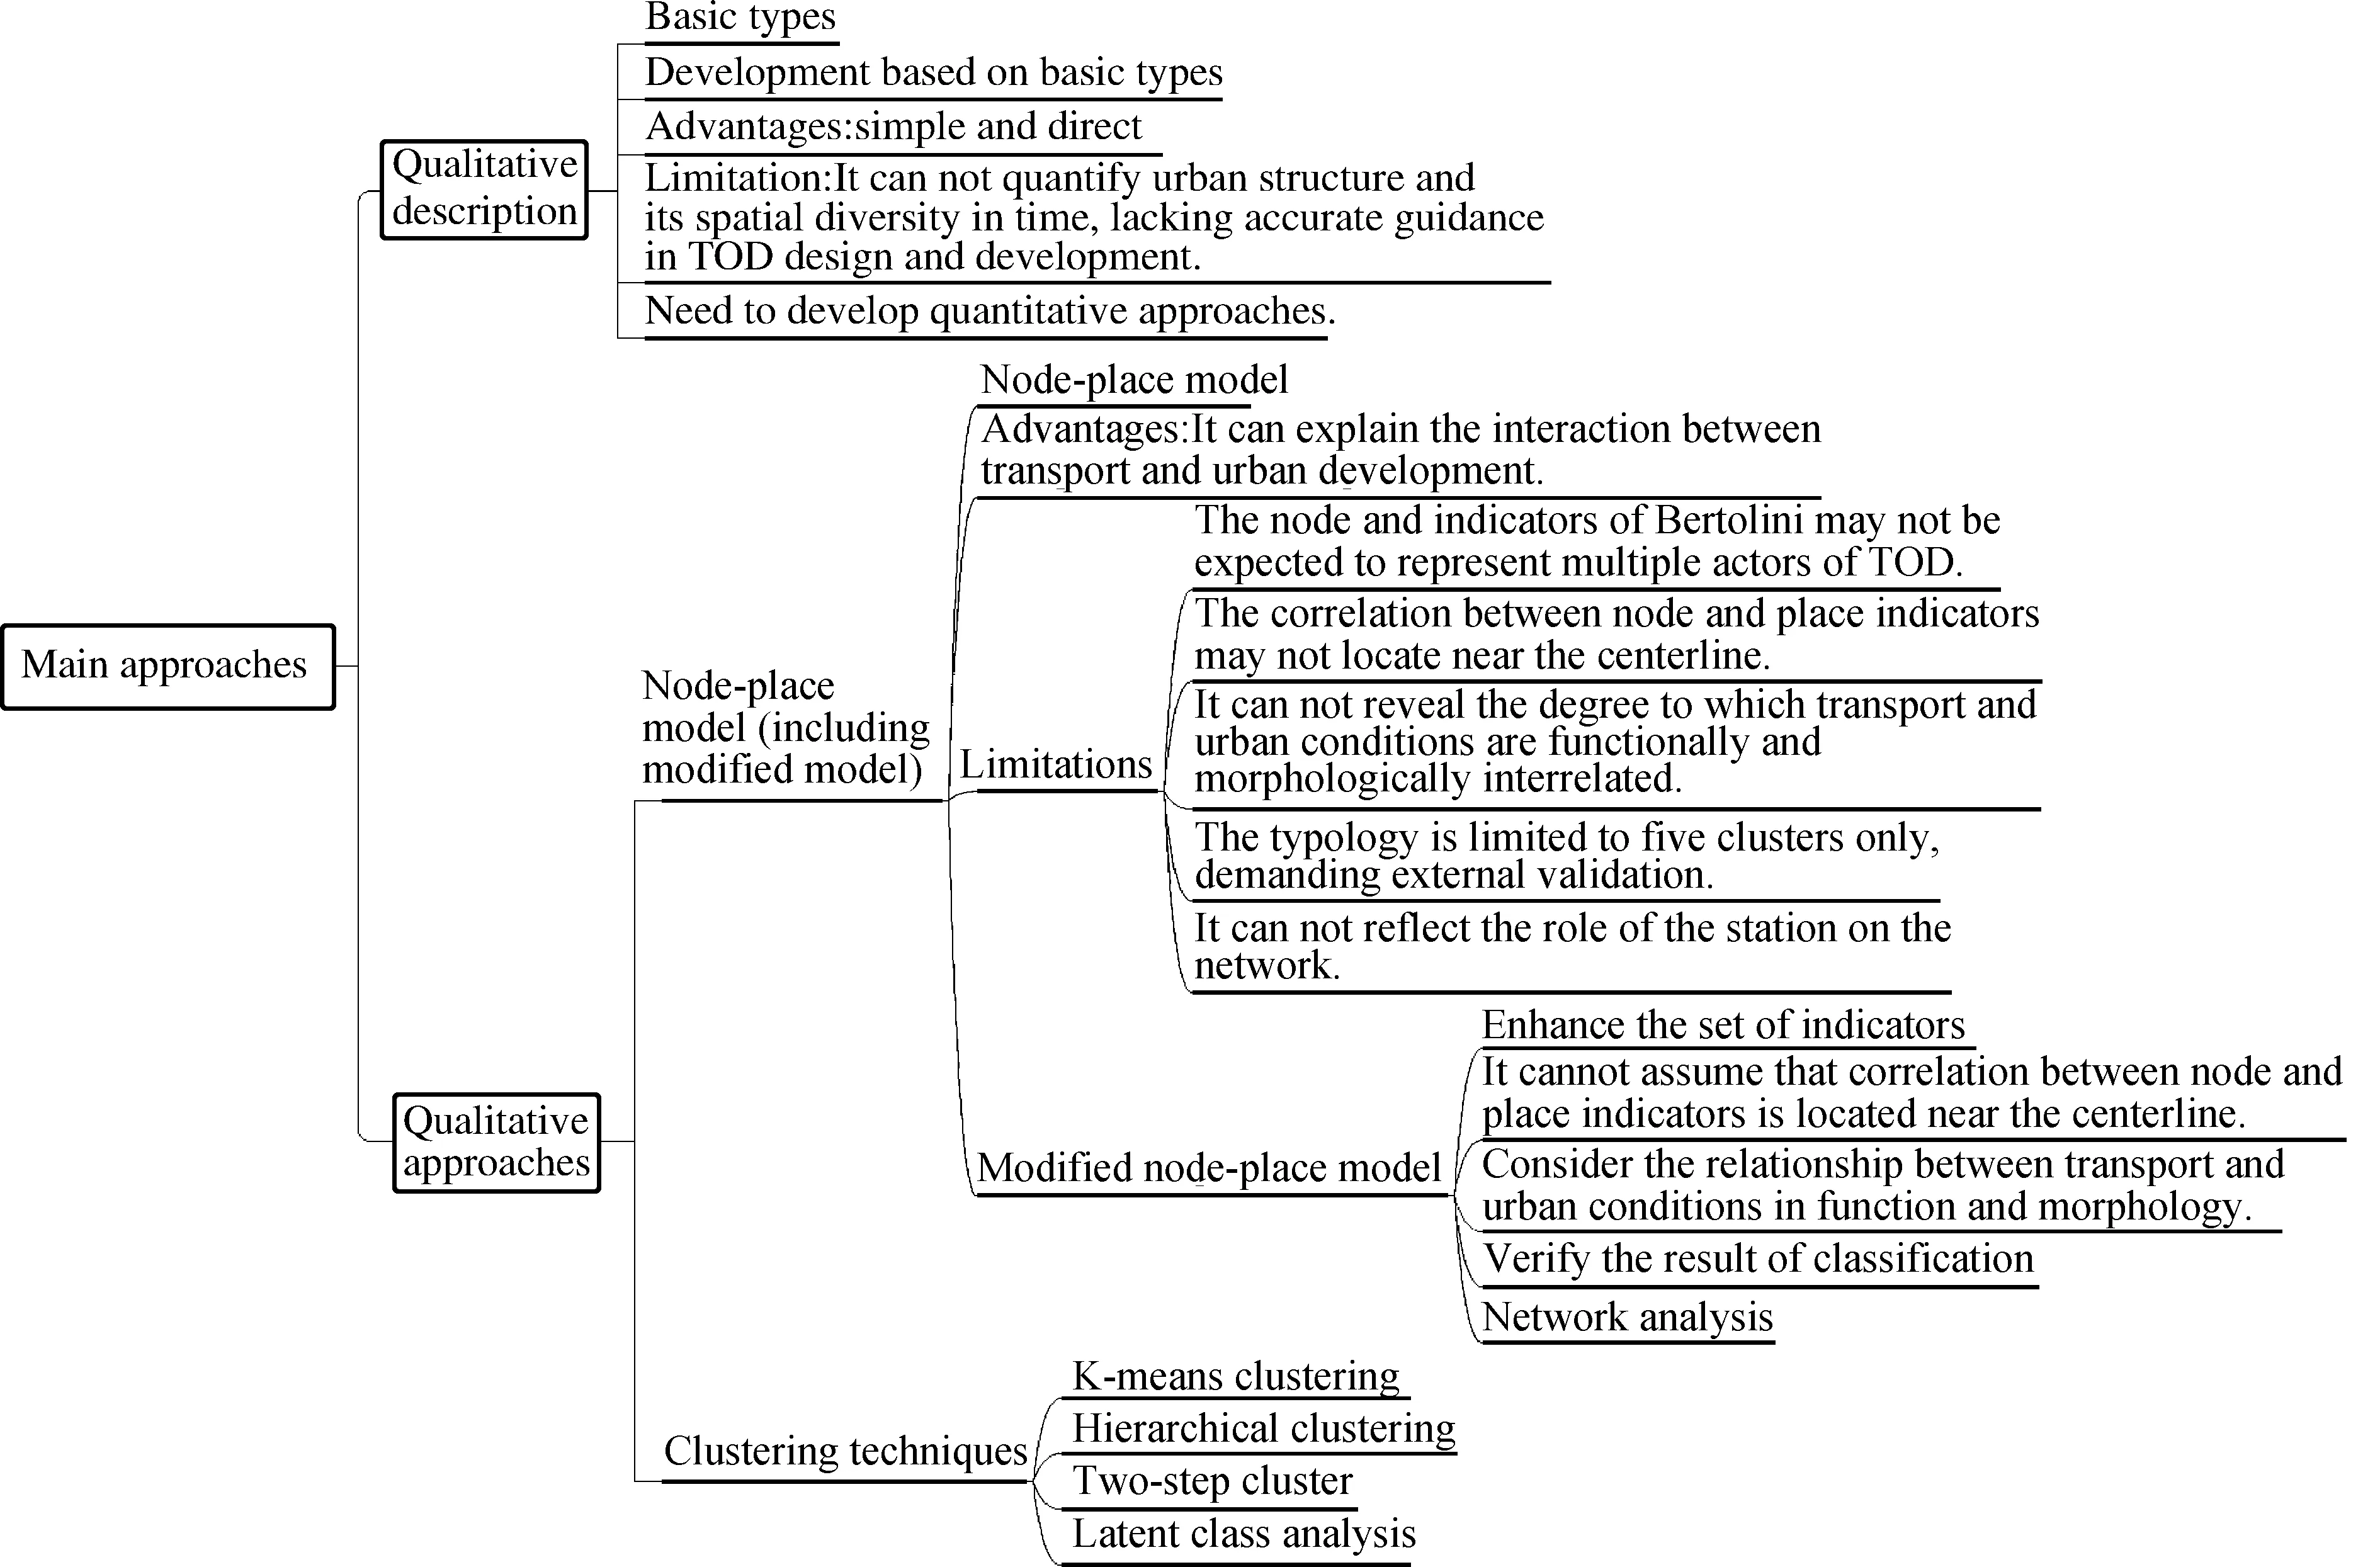
Fig.3 Progress of the TOD typology approaches
Some cities also adopt qualitative descriptions to guide urban TOD planning. In 2010, the Queensland Government in Australia identified TOD types, including city centers, activity centers, specialist activity centers, urban areas, suburban areas, and neighborhoods[24]. Design parameters are recommended for different types of TODs in terms of dwelling density, land-use diversity, commercial plot ratios, and transit. TheFloridaTODGuidebook[25]divides station typologies across three scales (i.e., regional, community, and neighborhood) that provide parameters for each type (e.g., density levels, mixed-use functions, urban forms, and street networks). Similarly, theTODGuidanceDocumentused in India classifies stations into seven types[26]according to station area characteristics, land availability, mixed land use, density, and planning and development challenges.
Qualitative description mainly classifies areas in terms of their locations and functions, directly guiding TOD planning. However, it cannot quantify urban structures and spatial diversity in time or guide TOD planning accurately[7]. Therefore, the development of quantitative typology methods is important considering that such methods can be tested, analyzed, and compared[7,22].
3.2 Node-place model and its modified model
3.2.1 Node-place model
The node-place model is foundational to TOD typologies and elaborates on the relationship between transportation (node) and urban development (place)[20]. Fig.4 illustrates five ideal and typical situations. The middle diagonal line denotes the area in which a node and place are equally strong and is also divided into stress, accessibility, and dependency levels in terms of the value of the node and place. The area in which the node value is significantly higher than the place value denotes an unsustainable node, and the area in which the place value is significantly higher than the node value denotes an unsustainable place. A neighborhood’s position in Fig.4 can be determined by calculating the node and place value from the node and place indices.
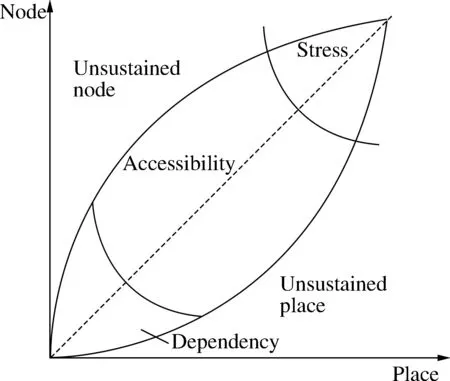
Fig.4 Node-place model
The node-place model has been widely used in different contexts[20,22,27-31]and was first constructed by Bertolini[20]and applied to Amsterdam and Utrecht railway stations in the Netherlands. The node indicators considered in this paper cover the connectivity (e.g., the number of directions served and distance from the closest motorway access), frequency (e.g., the daily frequency of services), and diversity (e.g., trains, buses, trams, underground transport, cars, and bicycles) of transport services. Place indicators include the number of residents in an area, the number of workers per economic type, and the degree of the functional mix. Most stations occupy balanced conditions, but a few stations are located in stressed and unsustainable nodes.
To better comprehend the spatial development dynamics of station areas, Chorus and Bertolini[31]applied the node-place model to 99 stations in Tokyo, selecting typical stations to analyze consistency with reality and the model. Most stations were found to be balanced, some were found to be under stress and unbalanced, and no stations were found to be dependent. Typical stations include Ueno Station, Urawa Station, and Shinjuku Station, and the results indicate that the development of Ueno Station and Urawa Station is consistent with that of the node-place model, but that of Shinjuku Station is an exception due to the influence of government policies.
The node-place model serves as a conceptual framework elaborating on the relationship between transportation and urban development. Although it cannot predict the future development of station areas, it is conducive to developing a stronger comprehension of development dynamics and potential for (re)development, supporting proposals from the land use and traffic sides.
However, the model shows the following limitations: First, the node and place indicators developed by Bertolini[20]cannot represent multiple actors of TOD[28,32]. Second, the balanced situation is defined as the middle diagonal line, but a straight line with other angles or concave curves may be more suitable[28]. Third, the model fails to reveal the degree to which transport and urban conditions are functionally and morphologically interrelated[22]. Fourth, because the weight of indicators is equal in dimensions, the importance of the difference between indicators is ignored. Fifth, the model classifies five situations only, and its results have not been externally verified[6]. Finally, the model cannot reflect the distinct roles of stations at regional levels[33]. Accordingly, some attempts have been made to enhance the model based on these limitations[6-7,22,28-30,32-35].
3.2.2 Modified node-place model
The modified node-place model overcomes the node-place model’s inadequate representation of indicators and linear assumptions.
Reusser et al.[28]operationalized the node-place model to 1,684 railway stations in Switzerland. In addition to the eleven indicators developed by Bertolini[20], this work develops six node indices and place indices based on expert questionnaires and interviews. The added indicators include passenger frequency, the ratio of the number of long-distance and regional services, presence of staff, number of full-time jobs with educational facilities, distance to a town center, and presence of grocery stores, restaurants, pharmacies, and florists. Node and place indices were drawn to verify whether the stations follow the node-place typologies. A two-step cluster analysis was conducted to classify stations into five types using 17 indicators. The results indicate that relationships between node and place values follow a concave curve, and the improved model with added indicators is highly suitable for Switzerland.
In a subsequent study of Switzerland, Zemp et al.[32]divided 1 700 railway stations into seven types relying solely on contextual factors. Ten indicators were taken into account as a result of expert interviews. The researchers adopted a principal component analysis to classify the indicators into two types: density (e.g., jobs, population, reachability, intercity trains, regional trains, and buses) and use (e.g., frequency distribution and tourism). Density was further divided into nodes (e.g., reachability, intercity trains, regional trains, and buses) and places (e.g., jobs and population). Their results show that the density-use typology constitutes a methodological improvement of the node-place model because some small stations cannot be easily distinguished with the node-place model but are significantly differentiated in the density-use model.
Many researchers have realized that the node-place model cannot explain the functional and morphological relationship between transportation and urban conditions[22,29,36-37]. For example, the functional interrelation is weak when the distribution of high densities and mixed uses does not gravitate toward a station. Equally, the morphological interrelation is weak when a street network is not friendly to pedestrians and cyclists.
In 2004, Schlossberg et al.[36]quantified the walking environments of 11 TOD sites in Portland, Oregon. Six indicators were selected at two geographic scales (0.25 and 0.5 mi), including the number of accessible paths, the number of impedance paths, pedestrian catchment area (PCA) ranking, impeded PCA ranking, intersection density, and density of dead ends. If a given indicator of a site was ranked in the top or the last three, then the site receives a chart. This paper shows that not all TOD sites are set in the same pedestrian environment.
Vale[29]also argued that the combination of the node-place model with walkability evaluates TOD more deeply in adding the ped-shed ratio indicator. In terms of node values, place values, and ped-shed ratios, their cluster analysis classifies train and ferry stations in Lisbon. Their results indicate that pedestrian infrastructure is poor in some areas where nodes and places are balanced.
Later, some scholars expanded the node-place model with a third dimension, considering other factors, such as quantifying pedestrian- or cycling-friendly built environments[22,34,37], the experience of travelers[35], and background traffic[38]. Cluster analyses were used to classify station areas. The results demonstrate that adding the third dimension enables the extended model to explain the subtle differences between stations and to better distinguish the balanced conditions of the node-place model.
In addition to adding different dimensions, some scholars determine the weight of indicators in different dimensions through surveys to distinguish the importance of indicators. After expanding the model as a node-place-functionality model, Su et al.[34]used the analytic hierarchy process to determine the weight of indicators under the same dimension and calculated the TOD degree according to the equal weight of three dimensions. Similarly, based on the node-place-experience model, Groenendijk considered that the three dimensions are equally important. A literature review provided the criteria for the experience value, and the weights were obtained through a questionnaire survey as the input for a multi-criteria decision-making method called the best-worst method[35].
The existing research on TOD typologies mainly adopts built environment indicators. Belzer et al.[39]found that some projects are successful when employing measurement using physical characteristics but fall short when measured by performance. At present, there is no consensus on whether performance indicators are the inputs or outputs of TOD typologies.
Some researchers have applied performance indicators in TOD classification. For example, the Center for Transit-Oriented Development[5]utilized the use-mix indicator and household vehicle miles traveled (household VKT) to develop a TOD typology for the United States. The use-mix indicator was defined as the percentage of workers within half a mile radius of train stations relative to the overall number of residents, and workers were divided into three categories: residential, balanced, and employed. The household VKT was obtained through a regression analysis, which was divided into five categories in terms of household income, household size, commuters per household, work commute time, household density, block size, transit access, and job access. The combination of indicators formed 15 categories, and 3 760 existing transit stations in the United States were analyzed.
However, some researchers have argued that performance indicators should be the outcomes of TOD typologies. Kamruzzaman et al.[6]applied a two-step cluster analysis to classify the CCDs of Brisbane in Australia into four typologies. The results were verified based on the mode choice behaviors of 10 013 individuals, which demonstrate that people living in areas classified as TODs are more likely to use public and active transport. Kamruzzaman et al.[40]then analyzed differences in the levels of social capital of different types. Their results demonstrate that social capital is higher in TODs than in TADs.
In addition to these indicators, performance indicators include the percentage of train station entries made by the transport mode[8], daily bus rapid transit ridership[41], and distance traveled by mode per person per day[42], among others. Renne argued that TOD outcomes could be verified from travel behavior, economic trends, natural environment, built environment, social environment, and policy contexts[43].
All of the above works examined station areas on a local scale. However, other studies have attempted to understand stations’ multiple roles at the regional level through network analyses. Existing indicators of network analyses mainly adopt betweenness, closeness, and eigenvector centrality[44-46].
Monajem et al.[30]added spatial indices, including closeness and betweenness, to improve the value of the node-place model. Their results show that, in Tehran, 71% of subway station areas are balanced and approximately 25% are unbalanced. The spatial indices show a logical relationship to node and place indicators, which are beneficial to the node-place model.
Zhang et al.[33]divided London’s 270 subway stations into five categories through a K-means cluster analysis that took advantage of node, place, and design indicators. Unlike Monajem et al.[30], the authors explored strategic network analysis indices (criticality and weighted betweenness centrality) after classification. The results indicate that most of the stations’ areas are balanced in terms of transportation and land-use development, but some stations do not offer friendly pedestrian environments. However, criticality levels were found to be significantly different for the same type.
Although the node-place model is simple and effective for evaluating land-use and transport integration, the enhancement of the original node-place model has broader applications. Similar to the node-place model, the classification of stations by the modified model can also instruct more targeted TOD planning of station areas or rail systems.
3.3 Clustering techniques
The node-place model (including the modified model)can promote an understanding of the integration of transportation and land-use development in station areas, but it only classifies station areas into five typologies, leading to numerous stations of the same conditions when the indicators are relatively concentrated. Therefore, it is difficult to distinguish the differences between sites when datasets are large. Moreover, the determination principle of spindle range in the node-place model is fuzzy. As a result, some clustering tools are widely used for station classification. Common clustering techniques of TOD typologies include K-means clustering[37,47-48], hierarchical clustering[22,49], two-step clustering[6-7,28], and latent class analysis[21,50].
Vale et al.[37]used K-means clustering to divide Lisbon subway stations into seven categories. K-means clustering can merge similar objects simply and efficiently, but it cannot determine the optimal cluster numbers. Moreover, it can only deal with continuous variables, not suitable for discrete variables. Similarly, hierarchical clustering only deals with continuous variables rather than determining the optimal number of clusters, although the number can be determined by convenience or other theories[21]. For example, Lyu et al.[22]conducted hierarchical clustering using the Duda test to classify Beijing subway stations into six categories in terms of nodes, places, and oriented values. By contrast, the two-step cluster analysis used by Phani et al.[7]is effective in dealing with mixed variables, including continuous and categorical variables. The determination of the optimal number of clusters conforms to statistics, such as the Bayesian information criterion. Outside of the two-step cluster analysis, the latent class analysis method used by Higgins and Kanaroglou[21]also seems promising. The latent class analysis differs from two-step clustering in that variables do not need to be standardized but are more computationally intensive.
Clustering techniques are effective for policy evaluation, benchmarking, and comparison of TOD characteristic performance in existing and planned stations[21], which supports research on the relationship between TOD characteristics and outcomes. Nonetheless, the classification results obtained are open to interpretation.
4 Research Progress of TOD Typologies in China
Research related to TOD typologies in China is mainly based on the qualitative description, considering functional characteristics, such as land-use function, traffic function, and regional function. Considering urban planning function and the status quo of land-use function, Zhang et al.[51]divided metro station areas into residential areas, central areas, special areas, and transportation hub areas. Combined with typical cases, planning and design guidelines for different types were put forward from five aspects, namely, spatial zoning, transportation system, land layout, development intensity control, and environmental design. Considering urban function, traffic function, and land-use function, Chen[52]divided 21 metro stations in Wuhan into six types and proposed the land-use structure control standards for different types of station areas. Similarly, Duan and Zhang[53]considered the comprehensive functional characteristics, divided metro stations of Xi’an Metro Line 2 into six categories, and proposed the optimization standards of land-use control for different types of stations.
The state and some cities have put forward TOD development guidelines based on function. The Ministry of Housing and Urban-Rural Development[54]divided the rail transit stations into six categories, namely, hub station, central station, group station, special control station, terminal station, and general station, and proposed the land-use function and construction intensity guidance for different types of stations. Shenzhen directly put planning guidance requirements for TOD development from the macro-meso-micro level[55-56]. According to the functional orientation of the metro station areas and surrounding land use, TOD areas were divided into three categories: urban, neighborhood, and special areas. Different types of micro-planning and design points of TOD were put forward based on the four elements of spatial scale, land-use function control, urban design and environment, and transportation facilities. Based on the comprehensive functions, Guangzhou divided the TOD areas of the Pearl River Delta into regional comprehensive centers, specific function centers, sub-regional comprehensive centers, regional transportation hubs, and city and sub-city level centers, as well as the general neighborhood, industry, and tourism[57]. The TOD development planning guidelines for rail transit stations were put forward from the land use, traffic organization, and urban design.
In recent years, the number of studies using quantitative classification based on TOD features has been increasing. Based on node and place dimensions, Yuan and Zhang[58]considered activities of residents (passenger flow of the station), constructed the node-place-activity model, and used the hierarchical clustering method to divide Shanghai metro stations into seven categories, namely, future TOD, suburban TOD, unbalanced nodes, urban peripheral TOD, special stations, urban center TOD, and urban core TOD. Aiming at ten typical rail transit stations in Tokyo, Zhang and Cao[59]evaluated the node value from the perspectives of commuting passenger density, transfer convenience, and proximity to CBD. At the same time, they evaluated the place value from the surrounding land development intensity, daytime population density, and residential population density. Similar to the research of Reusser et al.[28], regression fitting estimation was used to analyze the relationship between node and place values. The results showed that the relationships between node and place values were nonlinear. When the node value of the station was higher, the positive benefit of improving its accessibility to the place value would decrease. When the node and place value were unbalanced, the land redevelopment motivation would be formed to make it return to equilibrium. Chen et al.[60]expanded the node-place model and increased the relationship dimension, which was measured by walkability and accessibility. The weight of each index was determined using the fuzzy analytic hierarchy process. Finally, Guangzhou metro station areas were divided into four categories using self-organizing mapping clustering based on the comprehensive scores of the three dimensions.
Domestic TOD typology is mainly based on function, which can directly guide TOD development. However,only a little research is based on TOD features at present, such as density, diversity, and design. They mainly used node-place models to evaluate the coordination of land and transportation development or to improve the model by adding a new dimension or clarifying the index weight, aiming to evaluate it more comprehensively. Overall, domestic research has gradually begun to realize the importance of TOD typology, attempted to perform empirical research in different cities, and constantly enhanced the application of TOD typologies in domestic cities.
5 Conclusions and Avenues for Future Research
1) The number of published papers on TOD typologies has been increasing over time. The countries, institutions, and scholars in the field of TOD typologies are evaluated by multiple bibliometric indicators. According to a graphical visualization, TOD typology mainly stresses three aspects: TOD planning and urban design, application of node-place models to station areas, and development of TOD typologies using clustering techniques.
2) TOD typology approaches are effective in guiding strategic planning, mainly through qualitative descriptions, node-place model and clustering techniques. The node-place model is applied in different contexts but has some limitations, which some researchers have attempted to address. Clustering techniques are widely applied owing to their easily interpretable results. The distinct characteristics of these methods satisfy various demands.
3) Research related to TOD typologies in China is mainly based on functions. In recent years, the number of studies using a quantitative classification based on TOD features is gradually increasing. Scholars have paid attention to the importance of TOD typologies and applied them in different urban contexts to deepen TOD development in China.
4) This paper argues that the TOD typology research still presents the following limitations: Research on the roles of stations is in its infancy, and network analysis indices are measured by the characteristics of transport networks rather than based on passengers’ movement networks[33]. However, Liu et al.[61]emphasized the significance of human mobility patterns for TOD typologies. The volume of station inbound and outbound passenger flows used by Liu et al.[61]enables us to capture a more comprehensive understanding of different contexts. In addition, scholars have reached the consensus that TOD typologies help guide planning and policy. Although some studies have tested the equity of TOD policy[49], the application of TOD typologies to policies has been insufficient.
5) The research results of this paper are dynamic. New papers on TOD typologies may contribute to new results and research progress. Therefore, different bibliometric indicators can measure documents more comprehensively. Considering that only 41 papers were analyzed in this study, further research may conduct searches using multiple keywords and more articles to more comprehensively explore the development of TOD typologies.
杂志排行

Journal of Southeast University(English Edition)的其它文章
- Crossed products for Hopf group-algebras
- Concept and evaluation method of equipment system of systems contribution rate
- Comparative study of low NOx combustion optimization of a coal-fired utility boiler based on OBLPSO and GOBLPSO
- Sustainability of health information exchange platform based on information cooperation
- Clay mineral expansion of black cotton soil based on interlayer cation hydration
- Performance analysis of a novel tobacco-curing system with a solar-assisted heat pump