Modulation of the plasma uniformity by coil and dielectric window structures in an inductively coupled plasma
2021-09-10XiaoyanSUN孙晓艳YuruZHANG张钰如JingYE叶静YounianWANG王友年andJianxinHE何建新
Xiaoyan SUN (孙晓艳),Yuru ZHANG (张钰如),Jing YE (叶静),Younian WANG (王友年) and Jianxin HE (何建新)
1 Textile and Garment Industry of Research Institute,Zhongyuan University of Technology,Zhengzhou 450007,People’s Republic of China
2 Key Laboratory of Materials Modification by Laser,Ion and Electron Beams (Ministry of Education),School of Physics,Dalian University of Technology,Dalian 116024,People’s Republic of China
3 School of Textiles,Zhongyuan University of Technology,Zhengzhou 450007,People’s Republic of China
Abstract The effects of coil and dielectric window structures on the plasma distribution are examined in a cylindrically symmetric planar inductively coupled plasma(ICP).A two-dimensional(2D)fluid model is employed to investigate the design issues of ICP source for etching.When the gradient coil structure is applied at 400 W and 20 mTorr,the ionization rate caused by the power deposition decreases at the reactor center as compared to that in a reactor with a planar coil above the planar dielectric window,and a rather uniform plasma is obtained.However,for the vertical coil geometry,all the coils move to the position of the outermost coil,and the peaks of the power deposition and ionization rate appear at the radial edge of the substrate.In this case,the plasma density is characterized by an edge-high profile.Further,it is observed that the plasma uniformity is improved by increasing the source power under a gas pressure of 20 mTorr and becomes better when the gas pressure increases to 30 mTorr with the source power being fixed at 400 W in the gradient coil configuration,but the uniformity of plasma worsens with the rising source power or pressure due to the strong localization in the vertical coil geometry.Moreover,when the discharge is sustained in a reactor with a stepped dielectric window at r=0.135 m,the best plasma uniformity is obtained at 400 W and 20 mTorr because the ionization rate is enhanced at the outermost coil,and the dielectric window at r=0.135 m blocks the diffusion of plasma towards the axis.In addition,higher source power and lower gas pressure produce more uniform plasma for the designs with a stepped window near the symmetry axis.When the dielectric window is stepped at r=0.135 m,the non-uniformity of plasma initially decreases and then increases with the increase in source power or gas pressure.When the dielectric window is stepped at the radial edge of the chamber,the plasma uniformity is improved by increasing the source power and gas pressure due to the enhanced ionization at the larger radius caused by the severe localization.
Keywords: fluid simulation,gradient coil,vertical coil,stepped dielectric window,plasma uniformity
1.Introduction
Inductively coupled plasma (ICP) sources are widely used in semiconductor manufacturing industries owing to their high plasma density at low discharge pressure [1–3].With the continuous increase in the wafer size,plasma sources with good uniformity are needed to improve the productivity and optimize the fabrication costs.However,for the ICP system,due to the specific configuration of the reactor,it is difficult to obtain a uniform plasma over the substrate surface,which is not desirable in the microelectronics manufacturing processes.
As power parameters have a significant effect on the discharge characteristics with the advantage of a simple operation,numerous efforts have been performed to improve the plasma uniformity [4–12].Kushneret alutilized a three-dimensional(3D)hybrid model and found that the ICP reactors with five-turn coils exhibited more uniform ion fluxes to the wafer than oneturn coil due to the influence of the electrical transmission line properties of the coil[4].Subramonium and Kushner used a 3D hybrid model to prove that the azimuthal uniformity of the Ar+density became better during pulsed operation[5].Takekida and Nanbu applied the particle-in-cell Monte Carlo method,and they found that the ion flux uniformity was largely improved by decreasing the bias frequency [6].Xiaoet alused the plasma module in the COMSOL Multiphysics software to find that the etching uniformity was improved by adjusting the power supplied to the inner and outer coils [7].In addition,some experimental studies have focused on investigating the effect of discharge power on the plasma uniformity [8–12].Fukasawaet alexperimentally demonstrated that the radial uniformity of the electron density could be improved by changing the input power[8].Leeet aldiscovered that the spatial non-uniformity of the plasma density was strongly improved by increasing the bias power at a high gas pressure of 50 mTorr[9].Subsequently,they observed that when radio frequency(rf)bias power was applied,the uniformity of the plasma density was significantly enhanced with the increase in the ICP power at a fixed pressure of 100 mTorr [10].Mishraet almeasured the ion density distribution over the substrate by a rf-compensated Langmuir probe and concluded that a good discharge uniformity could be achieved by adjusting the inner lower frequency coil power for a fixed outer coil power of 13.56 MHz [11].Moreover,Seoet aldemonstrated that by pulsing both the inner and outer antennas,the plasma uniformity could be significantly improved [12].
Furthermore,modifying the geometry of the reactor is another way to control the plasma uniformity in semiconductor manufacturing processes.Although the cost is relatively higher,considerable efforts have been made in this field [13–16].Ventzeket alemployed a two-dimensional (2D) hybrid model,and observed an improvement in the plasma uniformity by thinning the dielectric at a large radius [13].Panagopouloset alapplied a 3D fluid model to reveal that a focus ring played an important role in alleviating the azimuthal nonuniformities [14].Sonet aloptimized the uniformity of the plasma by using a selfconsistent simulation and suggested that the plasma became uniform on a 450 mm wafer by decreasing the radius or increasing the height of the discharge region[15].By using a rffiltered Langmuir probe,Stittsworthet alshowed that the peak of the plasma density shifted from an off-axis to an on-axis as the chamber height was increased,and a rather uniform plasma was obtained at the intermediate chamber height (i.e.,7.5 cm) [16].

Figure 1.Schematic of the axisymmetric plane ICP reactor configuration.
From the above survey,it is clear that numerous studies have focused on the influence of various power parameters and geometric parameters on the uniformity of ICP sources.However,a systematic investigation for revealing the variation of plasma parameters with different coil structures (i.e.,gradient coil and vertical coil geometries) as well as with stepped dielectric windows have not yet been conducted yet.In addition,it is believed that ambipolar diffusion plays a major role in the final spatial distribution of the plasma parameters.However,the 2D distribution of the electron flux caused by diffusion or migration has not yet been observed.Since the coils with 3D spiral structures and reactors with different stepped dielectric window configurations have been applied in the thin-film processing technologies [13,17–19],it is of great significance to investigate the plasma characteristics for different coil and dielectric window structures.
The rest of the paper is organized as follows.The proposed computational model is described in section 2.Section 3 presents the results based on the COMSOL Multiphysics software,including the distributions of plasma characteristics for different coil structures (section 3.1) and dielectric window geometries(section 3.2).Finally,the study is concluded in section 4.
2.Simulation model
A 2D axisymmetric model of ICP reactor is established,which is divided into five parts: plasma,coil group,dielectric window,vacuum,and substrate region.The detailed dimensions of the base case are given in figure 1.The radial length of the chamber is 0.24 m.A four-turn coil is placed inside the vacuum region above the dielectric window with radial positions atr=0.05,0.08,0.11,and 0.14 m.The cavity of ICP is fliled with argon gas.The discharge frequency isf=13.56 MHz.

Figure 2.Steady-state distribution of the electron density in the base case sustained at 400 W and 20 mTorr.
2.1.Fluid equations
The ICP module consists of electron and heavy species fluid equations,as well as electromagnetic field and electrostatic field equations.The equations of electron density and energy are given as follows [20]:

Here,neand Γedenote the density and flux of electrons,respectively.μeandDeare the electron mobility and diffusivity,respectively.εnand Γεare the electron energy density and flux.μεandDεare the electron energy mobility and diffusivity.ReandSenare the source terms of the continuity and energy conversation equation.u is a neutral fluid velocity vector,which is almost negligible in the case of electrons.E is the electrostatic field,Qis an external heat source,andQgenis a generalized heat source.
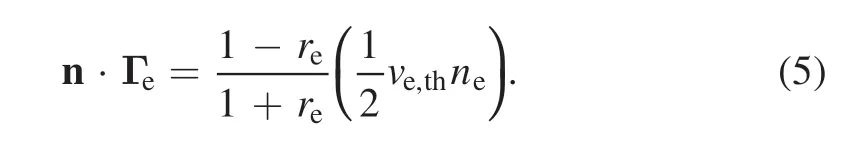
Without the secondary electron emissions,the electron flux at the wall is given by
The normal component of the electron energy density is expressed as
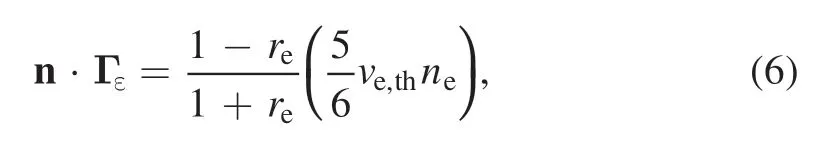
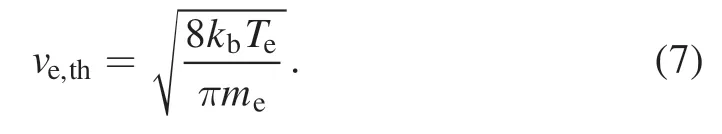
wherereis the reflection coefficient,n is the outward normal,andve,this the thermal velocity,which is defined as follows:
The heavy species refer to all the plasma species except the electrons,i.e.,argon ions as well as ground and excited argon atoms,which satisfy mass conservation equation.Suppose the reaction flow consists ofk=1,...,Q′species,then the equation for the first ′Q−1 species is given by

whereωkis the mass fraction of thekthspecies,andρdenotes the density of mixture.jkis the diffusive flux,andRkis the source term of heavy species.Since the sum of the mass fractions must be equal to one,ωQcan be set as follows:

2.2.Electromagnetic equations
The electromagnetic field in the ICP discharge is calculated by

The above equation is obtained from the Maxwell’s equation.Here,j is the imaginary unit,ωis the angular frequency of power source;σis the plasma conductivity;ε0andεrare the vacuum permittivity and relative permittivity of materials,respectively;μ0andμrare the vacuum permeability and relative permeability of specific medium,respectively;A is the magnetic vector potential;B is the magnetic field;αJ is the induction current.The boundary condition of magnetic insulation ( × =n A 0)is used for all the sidewalls.εris set to 1 in the vacuum region and plasma region and 4.2 in the dielectric window region.
2.3.Electrostatic equations
The Poisson’s equation is solved to compute the plasma potential and electrostatic field,
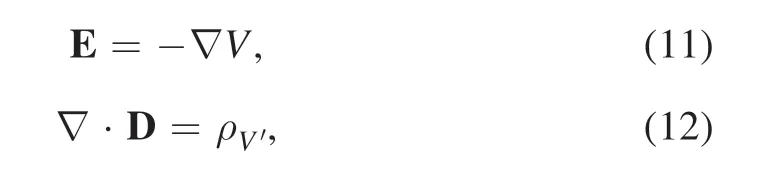
whereρV′is the space charge density,D=ε0εrE is the electric displacement,andVis the plasma potential.The potential is set to zero at the grounded chamber surface,such as the sidewall and the bottom surface.At the interface of the dielectric window and plasma,the boundary condition of the surface charge accumulation is set to

whereD1is the electric displacement in the dielectric,andD2is the electric displacement in the plasma region.ρsis the surface charge density,which is obtained by
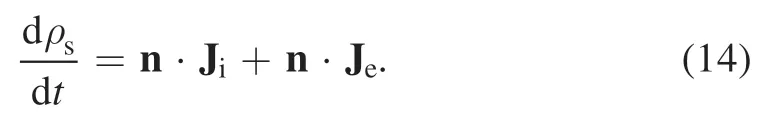
Here,·n Jiand ·n Jeare the normal components of the total ion and electron current density on the dielectric,respectively.
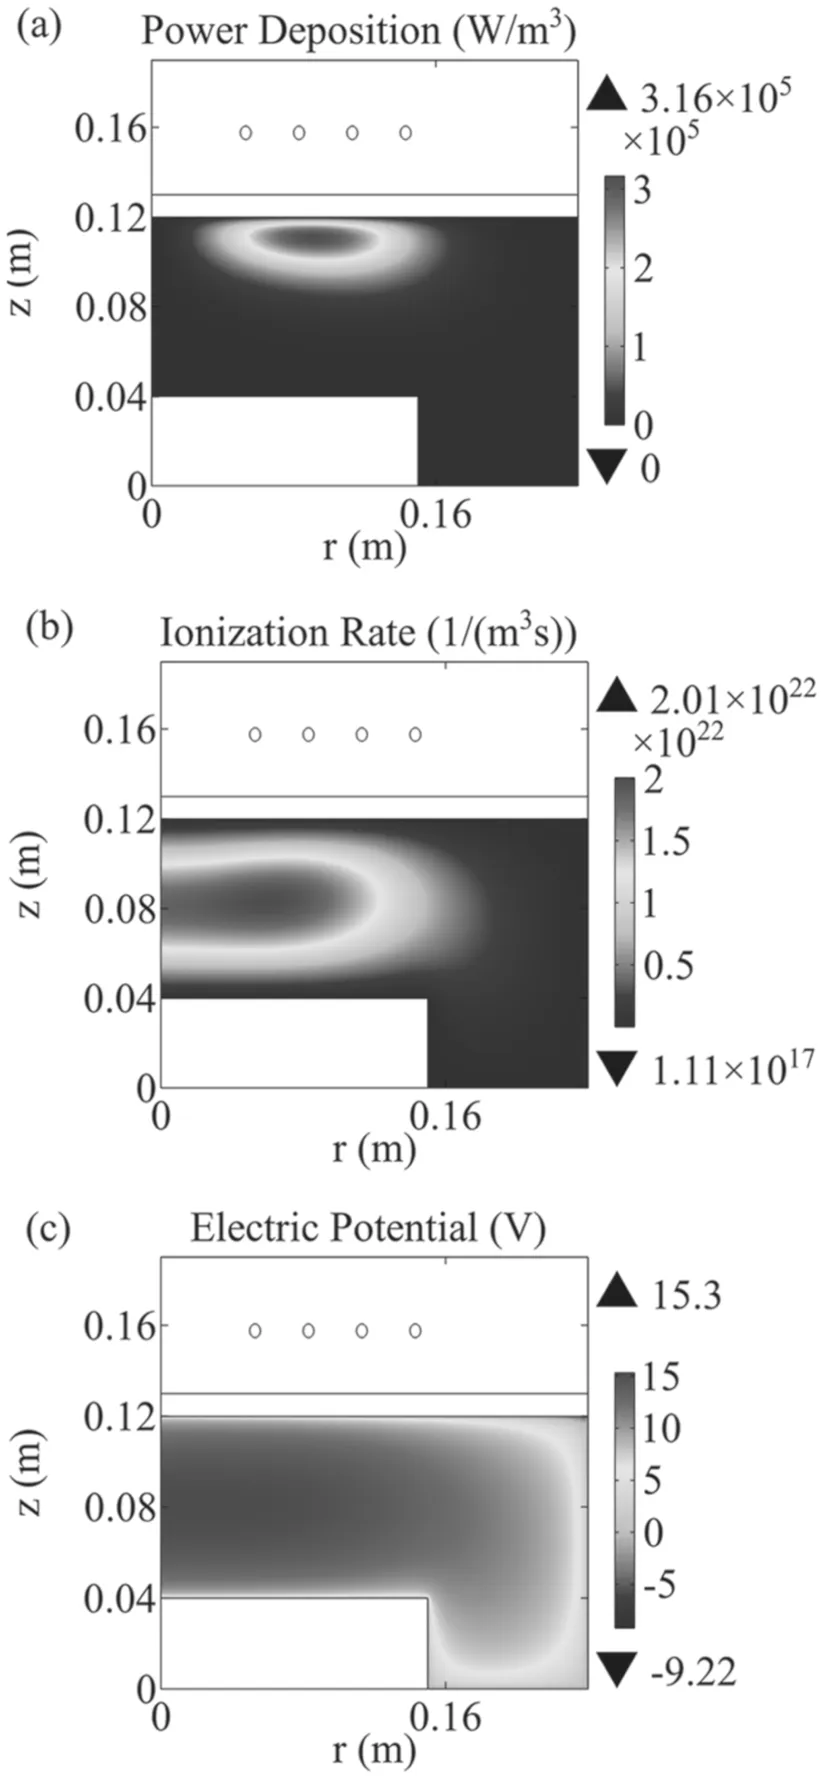
Figure 3.Steady-state distributions of the (a) power deposition,(b)ionization rate,and(c)electric potential in the base case sustained at 400 W and 20 mTorr.
3.Results and discussion
In this section,the influence of the radial and axial positions of coil as well as the dielectric window structure on the radial uniformity of plasma is investigated at different coil powers(200–1000 W) and gas pressures (10–50 mTorr).First,the final(i.e.,in the steady state)spatial distribution of the plasma density is observed in a reactor with a planar coil above the planar dielectric window (i.e.,the base case),as shown in figure 2.The source power is 400 W and the gas pressure is 20 mTorr.It is clear that the plasma density is characterized by a maximum at the reactor center with a value of 1.52 ×10¹⁷m−3.Since the spatial distribution of plasma around the wafer can be used to predict the etching uniformity,the plasma uniformity is estimated by the plasma density at the surface of the substrate in this work.The degree of non-uniformity is defined asα=(nmax−nmin)/2nave(similar to [21–23]),wherenmax,nmin,andnaveare the maximum,minimum,and average plasma densities at the bottom electrode.The plasma is more uniform for smallerα.In figure 2,the uniformity of the plasma is poor(α≈0.243).
In the base case,the center-high distribution of the plasma density mainly results from the pronounced power deposition,which is at its maximum near the middle two-turn coil under the dielectric window (see figure 3(a)).The ionization rate caused by the energetic electrons exhibits a maximum at ≈r0.06 m.Besides,the plasma is also generated near the symmetry axis due to the ambipolar diffusion of the energetic electrons,as illustrated in figure 3(b).The spatial distribution of the plasma potential is displayed in figure 3(c),which is similar to the electron distribution.Indeed,the plasma potential is highest at the location where the electron density is the highest,as Stittsworth and Wendt have described that the Boltzmann relation between the electron density and plasma potential:ne=ne0exp(eV/kTe),should be satisfied [16].In addition,the plasma potential is negative at the radial edge of the bulk-dielectric interface.This is because at the dielectric surface,the electrostatic field is ineffective in balancing the flux of electrons and positive ions.Therefore,the dielectric charge becomes negative as proposed by Ventzeket al[24].
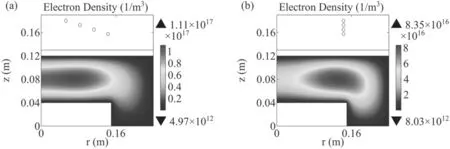
Figure 4.Steady-state distributions of the electron density for the (a) gradient coil and (b) vertical coil configurations.The source power is selected as 400 W,and the gas pressure is fixed at 20 mTorr.

Figure 5.Steady-state distributions of the((a)and(b))power deposition,((c)and(d))ionization rate,and((e)and(f))electric potential in the gradient coil and vertical coil geometries.The source power is selected as 400 W,and the gas pressure is fixed at 20 mTorr.
3.1.Distribution of plasma parameters for different coil placements
In this section,the gradient coil and vertical coil configurations are obtained by changing the axial and radial positions of the inner three-turn coil in figure 1.The influence of the coil configuration on the plasma uniformity is apparent from different distributions of the plasma density at 400 W and 20 mTorr,as depicted in figure 4.For the gradient coil geometry(cf figure 4(a)),the peak of the electron density drops and shifts from the symmetry axis to ≈r0.07 m as compared to the plasma density shown in figure 2,and a rather uniform distribution of the plasma density is observed at the substrate surface near the center region (α≈0.098).As all the coils move to the position of the outermost coil (see figure 4(b)),the plasma density near the symmetry axis decreases considerably,and less uniform plasma density is obtained again (α≈0.338).
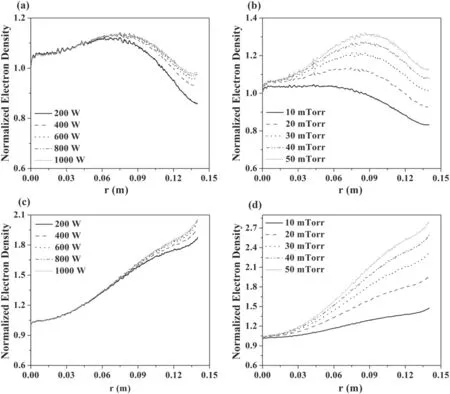
Figure 6.Final radial distributions of the electron density at the bottom electrode for the((a)and(b))gradient and((c)and(d))vertical coil configurations under different source powers and gas pressures.Here,the magnitude of electron density is normalized by the value atr = 0.0 m.
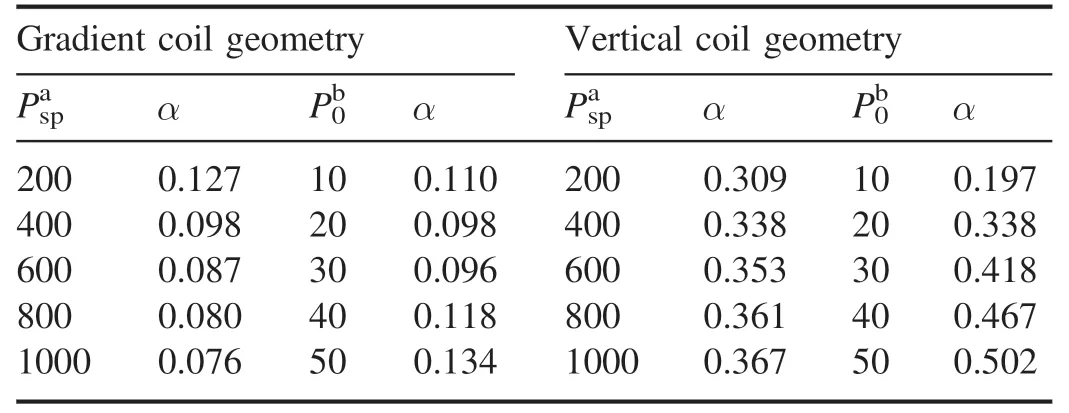
Table 1.Non-uniformity degree for the gradient coil and vertical coil geometries under different source powers and gas pressures.
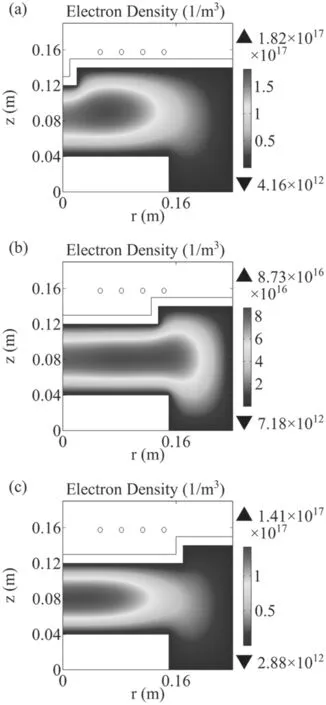
Figure 7.Steady-state distributions of the electron density as the height of dielectric window increases by 0.02 m between (a)r=0.02–0.24 m,(b)0.135–0.24 m,and(c)0.17–0.24 m for an ICP discharge sustained at 400 W and 20 mTorr.
To understand the distribution of the plasma density,the 2D profiles of the power deposition,the ionization rate,and plasma potential in the steady state for these two geometries are shown in figure 5.For the gradient coil configuration,the maximum of the power deposition moves outwards and appears at the radial position of ≈r0.1 m as compared to the base case,and the electrons are mainly heated by the outer three-turn coil under this condition.This is because the inductive electric field weakens near the symmetry axis due to the increase in the distance between coil and the plasma region,particularly the 1stturn coil.Therefore,the ionization rate also exhibits an off-axis maximum (i.e.,r≈0.09 m),as shown in figure 5(c).The 2D profile of the plasma potential is displayed in figure 5(e),which still shows a distribution similar to that of plasma density.Under the coupling effect of the ionization rate(i.e.,electron source)and electric potential(i.e.,electrostatic confinement),the obtained plasma density is shown in figure 4(a).For the vertical coil geometry,the source power is located at the outermost coil,and the power deposition decreases near the reactor center and is characterized by a maximum at ≈r0.15 m (see figure 5(b).The ionization rate is also maximum at the edge of the substrate due to the efficient heating there.This explains why the plasma density is characterized by an off-axis peak,as illustrated in figure 4(b).It is clear that the distribution of the plasma density is also affected by the potential difference,which results from the spatial profile of the plasma potential,as shown in figure 5(f).
Next,the effect of variation in the source power and gas pressure on the plasma uniformity is examined.As the source power varies from 200 W to 1000 W for a fixed pressure of 20 mTorr,the different radial profiles of the electron density at the bottom electrode for the gradient coil geometry are illustrated in figure 6(a),where the magnitude is normalized by the value at =r0.0 m.The plasma uniformity is slightly improved with the source power,and the non-uniformity degree of radial plasma decreases from 0.127 to 0.076,as presented in table 1.Figure 6(b) shows the electron density profiles at the substrate surface for a pressure of 10–50 mTorr and source power of 400 W.Notably,the plasma density distributions shift from center-high to edge-high since the local confinement becomes obvious with increasing pressure under this condition.Consequently,the plasma density becomes more uniform initially.Subsequently,it becomes less uniform,and the best uniformity of plasma is obtained at 400 W and 30 mTorr (α≈0.096).From table 1,it can be concluded that by adjusting the source power and gas pressure,the plasma uniformity can be further improved in the gradient coil configuration.The radial profiles of the electron density at the bottom electrode for the vertical coil configuration are shown in figure 6(c),where the discharge is sustained at different source powers (200–1000 W) and the gas pressure is fixed at 20 mTorr.It is clear that an edge-high profile is observed for all the source powers.Under this condition,the diffusion of electrons from regions of high electron density cannot mitigate the peak caused by the localized electron source,and the non-uniformity degree of the plasma increases with the source power (cf table 1).As the gas pressure rises from 10 mTorr to 50 mTorr at a source power of 400 W (cf figure 6(d)),the electron density profiles are all characterized by off-axis maximums.Further,local confinement of the plasma density is enhanced with the pressure.It is clear from table 1 that the plasma is quite uniform at low source power and gas pressure due to the sufficient diffusion for the vertical coil geometry,and the uniformity of the plasma characterized by the edge-high profile cannot be optimized by rising the source power or gas pressure due to the more localized discharge.Furthermore,the results also reveal that the impact of the source power on the spatial profile of the plasma density is weaker than that of the gas pressure under these conditions.

Figure 8.Steady-state distributions of the((a)–(c))power deposition,((d)–(f))ionization rate,and((g)–(i))electric potential as the height of dielectric window increases by 0.02 m between r = 0.02–0.24 m,0.135–0.24 m,and 0.17–0.24 m,respectively,for an ICP discharge sustained at 400 W and 20 mTorr.
3.2.Distribution of plasma parameters for different rector geometries
To investigate the effect of reactor structures on the plasma distribution,the plasma characteristics in different dielectric window geometries are examined.First,the final spatial distributions of the plasma density at a source power of 400 W and gas pressure of 20 mTorr are shown in figure 7.When the height of the dielectric window increases between =r0.02 m and 0.24 m (see figure 7(a)),the maximum plasma density is predicted to be1.82 ×1017m−3with a slight off-axis maximum,and the non-uniformity degree is approximately 0.196.As the dielectric window moves to the coil betweenr=0.135 m and 0.24 m,although the plasma density exhibits an edge-high profile,a rather uniform distribution is observed(α≈0.040),as shown in figure 7(b).When the dielectric window moves upwards between =r0.17 m and 0.24 m (cf figure 7(c)),the plasma density decreases slightly,and the spatial distribution profile shows minor difference(α≈0.231) as compared to the base case.
Figure 8 illustrates the final profiles of power deposition,ionization rate,and plasma potential.When the dielectric window is stepped near the symmetry axis (see figure 8(a)),the dielectric window geometry has a minor influence on the value and shape of the power deposition,and the power deposition exhibits a similar distribution as the base case,where a maximum appears at the middle two-turn coil.However,the ionization rate in this case decreases at the reactor center as compared to that in the base case (cf figure 3(b),showing an obvious off-axis maximum,and this mainly results in the plasma density profile shown in figure 7(a).When the dielectric window is stepped atr=0.135 m (see figure 8(b)),the power is still primarily deposited near the middle two-turn coil,and a second peak of the power deposition appears below the outermost coil at the radial position of ≈r0.14 m due to the enhanced inductive electric field there.This is because the distance between the coil and plasma is small near the outermost coil,and the inductive electric field cannot penetrate effectively into the plasma region due to the thicker quartz window fromr=0.12 m to 0.14 m,and the deposition power decreases.The ionization rate induced by the deposition power is relatively enhanced at the radial edge of the substrate and shows a rather uniform distribution,as illustrated in figure 8(e).Although an obvious off-axis maximum is observed in the distribution of the plasma potential (cf figure 8(h)),a rather uniform plasma is achieved (see figure 7((b)) due to the electron transportation caused by diffusion.When the dielectric window is stepped at the radial edge of the reactor,the plasma characteristics exhibit similar behavior as the base case,which is negligibly influenced by the increase in the height of the dielectric window.This explains the result shown in figure 7(c).

Figure 9.Distributions of the radial electron diffusion flux during the discharge process as the height of dielectric window increases by 0.02 m between (a) r = 0.02–0.24 m,(b) 0.135–0.24 m,and (c)0.17–0.24 m for an ICP discharge sustained at 400 W and 20 mTorr.
To further understand the discharge characteristics,the 2D profiles of the radial electron diffusion flux during the discharge process at 400 W and 20 mTorr are presented in figure 9.Since we mainly focus on the radial uniformity of the plasma in this work,it is strongly affected by the radial diffusion and migration of the electrons,which act in opposite directions.Therefore,only the spatial distributions of the radial electron diffusion flux in different dielectric window structures are plotted.According to figure 9,as the dielectric window between =r0.02 m and 0.24 m moves towards the coil(figure 9(a)),electrons diffuse to the dielectric window atr=0.02 m.It is clear that the electron flux has a lower value at the symmetry axis,and the electrons are accumulated nearr=0.02 m.This gives rise to the off-axis peak of the plasma characteristics mentioned above.When the height of the dielectric window increases between =r0.135 m to 0.24 m(figure 9(b)),the electrons at the radial edge of the chamber below the dielectric window flow towards the quartz window at =r0.135 m and the side wall simultaneously.Therefore,many electrons are accumulated at the larger radius due to the blocking of the quartz window,which gives rise to a uniform plasma,as depicted in figure 7(b).When the dielectric window is stepped at the radial edge of the reactor (figure 9(c)),the location of the step is far from the plasma production region.Therefore,many electrons move to the symmetry axis,and the center-high profile of the plasma density is obtained.

Figure 10.Final radial distributions of the electron density at bottom electrode as the height of dielectric window increases by 0.02 m between ((a)–(b)) r = 0.02–0.24 m,((c)–(d)) 0.135–0.24 m,and ((e)–(f)) 0.17–0.24 m for an ICP discharge sustained at different source powers and pressures.The magnitude of electron density is normalized by the value at r = 0.0 m.
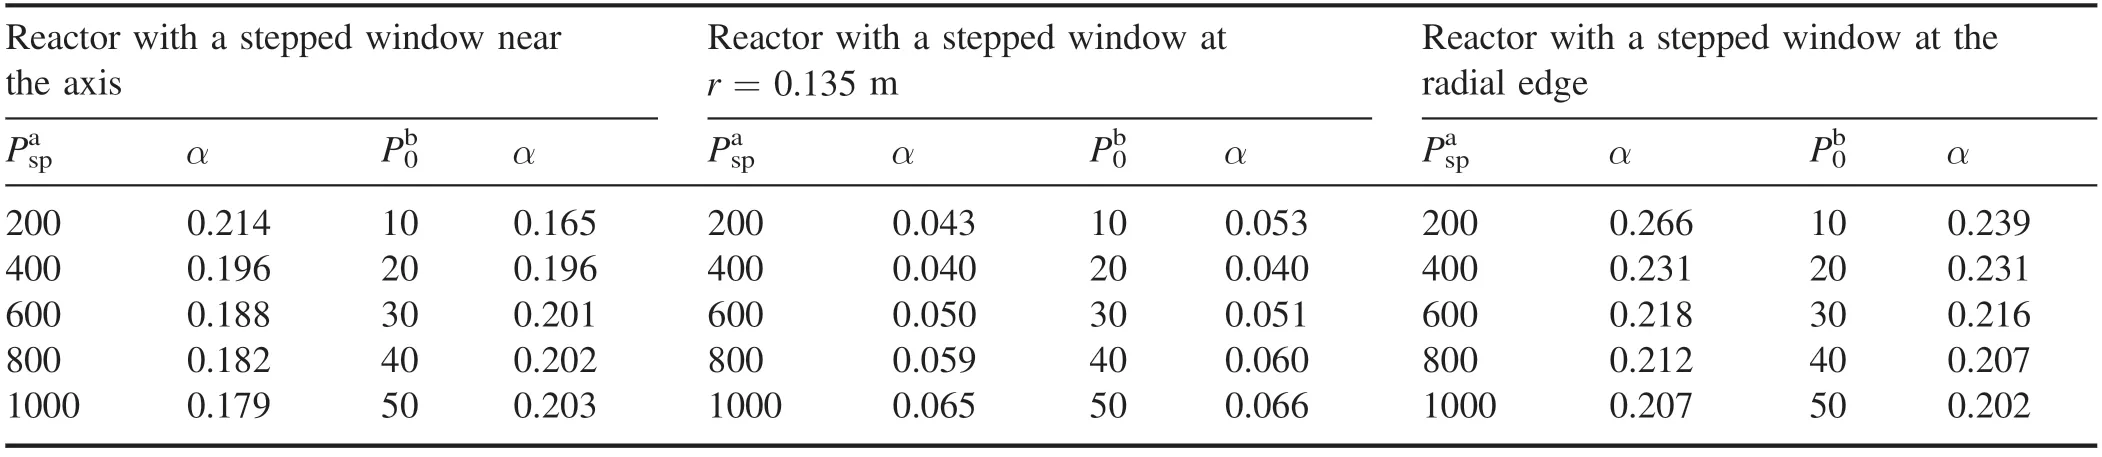
Table 2.Non-uniformity degree of the plasma for the three stepped window geometries under different source powers and gas pressures.
Parametric analysis is conducted by varying the source power from 200 W to 1000 W with the gas pressure fixed at 20 mTorr and by varying the gas pressure from 10 mTorr to 50 mTorr with the source power fixed at 400 W.When the dielectric window is stepped near the axis,the plasma density at the substrate surface has a local maximum atr≈0.06 m for all the source powers and gas pressures(see figures 10(a)and(b)).The plasma uniformity at the surface of the electrode becomes better with the rising source power.However,higher gas pressure generates less uniform plasma.Further,the effect of discharge parameter on the radial profile of the plasma weakens with the rise in the source power or the gas pressure.This is because the stepped window at small radius blocks the diffusion of plasma towards the axis,and the electron heating becomes more local near the antenna with the increase in the source power or the gas pressure.As the height of the quartz window increases from =r0.135 m to 0.24 m,the plasma density at the radial edge of the substrate clearly increases with the source power and gas pressure (cf figures 10(c) and(d)).The plasma is fairly uniform at all the selected discharge parameters,and the best uniformity of plasma is obtained at 400 W and 20 mTorr (α≈0.040),as shown in table 2.Indeed,the uniform plasma is obtained because the deposition power is enhanced near the outermost coil and the diffusion weakens towards the axis under this condition.It is clear from figure 10(e) that the location of the density maxima is insensitive to the discharge power for the structure with a stepped window at the radial edge of the chamber,and the plasma uniformity is slightly improved (see table 2).As the gas pressure increases from 10 mTorr to 50 mTorr with a fixed source power of 400 W (see figure 10(f)),the plasma density profile varies from center-high to edge-high,and the plasma density is more uniform at 50 mTorr due to the enhanced ionization at the larger radius caused by the severe localization.
4.Conclusions
In this study,a 2D fluid model was established to investigate the characteristics of plasma parameters in argon ICPs under different coil and dielectric window structures.The effect of various coil and dielectric window structures was illustrated by examining the spatial 2D distributions of electron density,power deposition,ionization rate,plasma potential,electron diffusion flux,and the radial distributions of the electron density at the bottom electrode.
It was observed that the plasma distribution was significantly affected by the coil geometry,i.e.,the location of the plasma production.First,the 2D distribution of the plasma parameters at source power of 400 W and gas pressure of 20 mTorr was examined in the gradient coil and vertical coil configurations.The power deposition moved outwards,especially in the vertical coil configuration.The off-axis ionization rate in the gradient coil geometry as well as the effect of the plasma potential resulted in a uniform plasma density in the center region (α≈0.098).However,for the vertical coil geometry,the peak caused by the localized ionization rate could not be mitigated by the diffusion and the potential difference,and the plasma uniformity became worse(α≈0.338).Furthermore,the radial distribution of the electron density at the substrate surface was investigated under different source powers and gas pressures for these two coil configurations.For the gradient coil geometry,the plasma uniformity was slightly improved with the increase in source power because of the enhanced localization,and a fairly uniform plasma was obtained at 20 mTorr and 1000 W(α≈0.076).Further,the plasma uniformity becomes better first and then worse with the increase of gas pressure in the gradient coil configuration.For the vertical coil geometry,edge-high profiles were observed at all the sources powers and gas pressures,and the non-uniformity of plasma increased with the rise of source power and gas pressure.
The effect of the dielectric window structure on the plasma characteristics was also investigated at different discharge parameters (e.g.,source power and gas pressure).The 2D distribution of the plasma characteristics at 400 W and 20 mTorr was also examined.As the dielectric window between =r0.02 m and 0.24 m moved towards the coil,the plasma density was characterized by an off-axis peak with a higher magnitude compared to that in the base case due to the higher deposition power density near the reactor center and the blocking of dielectric window near the axis.When the height of the quartz window was increased betweenr=0.135 m and 0.24 m,the discharge was relatively enhanced near the outermost coil,and the diffusion of the electrons to the axis was simultaneously blocked by the dielectric window at =r0.135 m.The most uniform plasma distribution was obtained in this case (α≈0.040).As the height of the dielectric window rose near the radial edge(between =r0.17 m and 0.24 m),the plasma characteristics were hardly affected because the location of the higher chamber was far from the plasma production region.Furthermore,the radial profiles of the plasma density at the bottom electrode under various source powers and gas pressures were investigated.When the dielectric window was stepped near the axis,the plasma density became better with the rising source power and became worse with the gas pressure,and it weakened with the increase in the source power or the gas pressure.When the quartz window was stepped at =r0.135 m (between the 3rd and 4th coils),the plasma was fairly uniform for all the discharge parameters,and the most uniform plasma was obtained at 400 W and 20 mTorr,as mentioned before.When the dielectric window was stepped at the radial edge of the chamber,the plasma uniformity was enhanced with the rise of source power or gas pressure due to the severe localization of the electron source.
Overall,the radial uniformity of the plasma characteristics can be improved by adjusting the axial and radial position of the coil or by using a stepped window above the coil,modifying the location of the plasma production and the reactor structure is an effective method to achieve uniform plasma.
Acknowledgments
This work was supported by National Natural Science Foundation of China (Nos.11905307 and 11875101),the Fundamental Research Funds for the Central Universities(No.DUT21LAB110),and the China Scholarship Council.
杂志排行

Plasma Science and Technology的其它文章
- Recent results of fusion triple product on EAST tokamak
- Suppression and mitigation of inter-ELM high-frequency Alfvén-like mode by resonant magnetic perturbation in EAST
- Simulations of NBI fast ion loss in the presence of toroidal field ripple on EAST
- Reconstructions of velocity distributions from fast-ion D-alpha (FIDA) measurements on EAST
- Tomography of emissivity for Doppler coherence imaging spectroscopy diagnostic in HL-2A
- Comparison of natural grassy ELM behavior in favorable/unfavorable Bt in EAST