Reconstructions of velocity distributions from fast-ion D-alpha (FIDA) measurements on EAST
2021-09-10JianxunSU宿建勋BaonianWAN万宝年JuanHUANG黄娟BirgitteMADSENMirkoSALEWSKIYanxuSUN孙延旭JinfangWANG王进芳JingFU付静JiafengCHANG常加峰ChengruiWU吴承瑞LizhenLIANG梁立振YingjieCHEN陈颖杰GuoqiangZHONG钟国强HaiqingLIU刘海庆QingZANG臧庆YingyingLI李颖颖BoLY
Jianxun SU (宿建勋),Baonian WAN (万宝年),Juan HUANG (黄娟),Birgitte MADSEN,Mirko SALEWSKI,Yanxu SUN (孙延旭),Jinfang WANG (王进芳),Jing FU (付静),Jiafeng CHANG (常加峰),Chengrui WU (吴承瑞),Lizhen LIANG (梁立振),Yingjie CHEN(陈颖杰),Guoqiang ZHONG (钟国强),Haiqing LIU (刘海庆),Qing ZANG (臧庆),Yingying LI (李颖颖),Bo LYU (吕波),Jinping QIAN (钱金平),Xianzu GONG (龚先祖) and EAST Team
1 Institute of Plasma Physics,Chinese Academy of Sciences,Hefei 230031,People’s Republic of China
2 University of Science and Technology of China,Hefei 230026,People’s Republic of China
3 Department of Physics,Technical University of Denmark,Kgs.Lyngby,Denmark
4 School of Science,Hubei University of Automotive Technology,Shiyan 442002,People’s Republic of China
Abstract 2D fast-ion velocity-space distributions have been reconstructed from two-view fast-ion D-alpha(FIDA) measurements on experimental advanced superconducting tokamak (EAST).To make up for the sparse data and incomplete velocity-space coverage with the dual-view,we use nonnegativity and null-measurements as prior information to reconstruct the velocity distribution in experiments with co- and counter-current neutral beam injection.An improved reconstructed fast-ion distribution is achieved by combining the existing O- and B-port FIDA measurements with the proposed A-port FIDA view.To further improve the reliability of FIDA-based reconstructions on EAST,based on real multi-view FIDA measurements on EAST in the near future,various bases will be studied further.
Keywords: fast-ion D-alpha (FIDA),FIDASIM,velocity-space tomography,fast ion,EAST tokamak
1.Introduction
Fast ions play a critical role in the efficiency of heating and current drive in present tokamak devices and future reactors[1].They can also drive instabilities,which can act on specific parts of the fast-ion velocity-space distribution,causing anomalous fast-ion redistribution and loss [2] potentially resulting in damage to the components on the first wall.To obtain information about fast-ion velocity-space distribution function,fast-ion D-alpha (FIDA) measurements [3,4] are commonly used in tokamak and stellarator devices,such as DIII-D [5],LHD [6],NSTX [7],ASDEX Upgrade [8],TCV[9],MAST [10],experimental advanced superconducting tokamak (EAST) [11,12].The principle of the FIDA diagnostic is that the neutralized fast ions,resulting from chargeexchange reactions,are in excited states and emit Balmeralpha radiation with a Doppler shift that is dependent on the fast-ion velocity.By measuring this Doppler-shifted Balmeralpha radiation,information on fast-ion velocity-space distribution can be obtained by the following two approaches.One is the synthetic method where measurements are compared with synthetic measurements based on numerical simulations.The FIDA measurements are directly compared to synthetic spectra modeled by the FIDASIM [13,14] and TRANSP/NUBEAM codes [15].If the measured and synthetic spectra agree,the fast-ion behaviour can be understood from the simulated fast-ion distribution [11].However,they often disagree,and then it is unclear what causes the discrepancy.The other approach uses velocity-space tomography where the fast-ion distribution is reconstructed from multiple fast-ion diagnostics by tomographic inversion[16–18].This method is especially well-established at ASDEX Upgrade [8,19–21] and applied on MAST [22],DIII-D [23],JET [24] and EAST [25].This approach is also essential as alpha-particle diagnostic at ITER [26].
In the EAST,fast ions come mainly from auxiliary heating systems,including NBI and ion cyclotron resonance heating [27].Several complementary fast-ion diagnostics systems have been installed in EAST,including FIDA [28],fast-ion loss detectors(FILDs)[29],solid state neutral particle analyzer[30],neutron emission spectrometry based on liquid scintillators [31] or time-of-flight enhanced diagnostic [32].For the FIDA diagnostic system,the two-view measurements can provide good coverage in velocity space allowing the reconstruction of fast-ion two-dimensional distribution functions [25].This paper will focus on FIDA measurements performed during MHD quiescent shots and corresponding reconstructed fast-ion distributions with an improved resolution by future proposed three-view measurements.
The paper is organized as follows.Section 2 presents the FIDA diagnostics setup and experimental methods with simulation tools (TRANSP/NUBEAM and FIDASIM) and inversion methods(velocity-space tomography).Section 3 shows the studies of the measured spectra from the vertical and tangential views,compared with the synthetic diagnostic signals.The velocity-space distribution derived through tomographic inversions according to two-view FIDA spectra are discussed in section 4.Section 5 describes the improvement of tomographic reconstruction by combining the further proposed third view of FIDA diagnosis on EAST.Finally,section 6 gives a summary.
2.Experimental measurements and methods
Two neutral beam injection systems are installed in the location of A-port and F-port on EAST,equipped with cocurrent and counter-current sources respectively,as shown in figure 1(a).The neutral beam injectors can provide 2–4 MW of beam power and up to 80 keV of beam energy.For FIDA measurements,the neutral beam with tangential radius of 1.26 m at A-port is used as the probe beam and the beam modulation method is applied to subtract the background to obtain active FIDA information.Two spectroscopy systems are equipped in FIDA measurements with details presented in [11]: one is HoloSpec transmission grating spectrometer from Kaiser Optical System; the other is FLP-200 VPH (volume phase holographic)spectrograph system from Bunkoukeiki system.The FIDA measurements are done in two views: one in the tangential direction from the O-port and one from the vertical direction from B-port.The geometry is shown in figure 1.In this paper,the measured linesof-sight(LOS)spectra from the tangential and vertical views atR=195 cm are analyzed.
To understand the net FIDA spectra,forward modeling is needed.We use the FIDASIM code to predict each component with the fast-ion distribution function computed by the TRANSP/NUBEAM code.The fast-ion distribution function has a complicated dependence on both velocity space and configuration space[5].A velocity space weight function(w)can be constructed to provide a convenient way to understand the relationship between any fast-ion diagnostic signal(s)and the distribution function (f):

The weight function represents the probability for fast ions with the specific velocity space to be neutralized and subsequently to emit D-alpha photons within a specific wavelength range [33].Such weight functions are useful in the analysis of fast-ion measurements and have been calculated for several diagnostics,e.g.collective Thomson scattering[34],neutron emission spectrometry [35,36],FILDs [37],gamma-ray spectroscopy [38],MeV proton detectors [39],and ion cyclotron emission [40].For each of these diagnostics,the measured signal,here FIDA,is the convolution of the weight function with the fast ion distribution function.
The 2D fast-ion velocity distributions can be inferred by velocity-space tomography based on the measured FIDA spectra and the weight functions.To accomplish this,the forward model is written as a matrix equation:
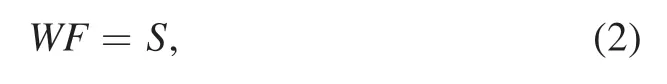
whereWis a matrix based on the weight functions.Measurements from all diagnostics can be combined in an integrated data analysis with this approach.Using the net FIDA signal(S)and weight functions of both the tangential view and vertical view,the velocity space tomography method can reconstruct the fast ion distribution function(F)[22].However,Fcannot be solved directly,becauseWis usually not an invertible matrix.In order to solve this illposed problem and provide a stable solution,a regularization method is necessary [41].In this paper,we use the zeroth-order Tikhonov regularization [42] to obtain the stable reconstruction of the fast ion distribution function[20]:
whereLis the identity matrix,λ is the regularization parameter that balances the requirement of fitting the measurement data and smoothness of the distribution function.This method has been found to provide better results for the two-view FIDA system at EAST [25] than the more commonly used first-order Tikhonov method that penalizes large gradients in energy and pitch [41].Furthermore,prior information can be added to improve the quality of the solution [20].In this paper,the non-negativity of the measurement and the known measurement range will be used.
3.Comparison between measured and simulated FIDA spectra
To study the fast ions in EAST by FIDA measurements,the L-mode MHD quiescent shot #75446 on EAST is chosen with a counter-clockwise plasma current of 600 kA(figure 2(a)),a clockwise toroidal field of 2.4 T on the magnetic axis,a line averaged electric density of 3×10¹⁹m−3(figure 2(b)),and an effective charge number 〈Zeff〉 of 1.8 obtained from the visible bremsstrahlung diagnostic system.As shown in figure 2(c),in order to get the FIDA signal,the diagnostic beam from A-port tangential beam is modulated with a 100 ms duration and a 10% duty cycle and produced 0.68 MW beam power at 51 keV beam energy.The beam power fractions are given as 0.70:0.16:0.14 for the full-,half-,and one-third energies.The F-port tangential beam acted as a heating beam producing 1.15 MW beam power at 56 keV beam energy.Figure 3 shows the simulated TRANSP/NUBEAM fast-ion distribution function for simultaneous counter- and co-current neutral beam injection.The FIDA measurements during the second pulse at 4.2 s are analyzed in this paper.

Figure 1.Layout of the neutral beam and the tangential and vertical views of the FIDA diagnostics on EAST:(a)top view,(b)poloidal view.The green line at A-port is NBI1L which is used as diagnostic beam of FIDA.The red lines-of-sight are analyzed in this paper for shot#75446.
Figure 4 shows the absolutely calibrated FIDA spectra at ρ~0.17 measured by the tangentially observing O-port view.The net FIDA signal is obtained by background subtraction.The O-V line at 650.1 nm(passive impurity line)and the cold D-alpha line at 656.1 nm show no significant change between‘beam on’and‘beam off’,indicating that the plasma has good temporal stability.
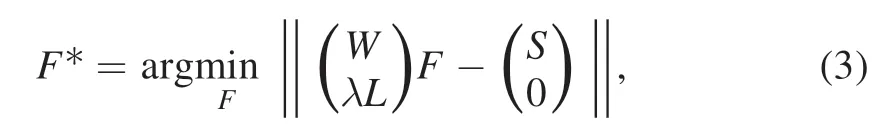
Figure 5 shows the net FIDA measurement spectra from tangential and vertical views compared with the FIDASIM simulated results,including the FIDA,halo and beam emissions convolved with the instrumental broadening of 0.1 nm for the B-port view and 0.33 nm for the O-port view.Due to the different observation angles,the frequency shift of the beam signal is different.From the tangential view,both the blue-shifted and red-shifted wings of FIDA measurements agree well with the simulated spectra.The beam emissions have large redshifts,causing it to overlap with the FIDA signal outside the notch filter at the red-shifted wing of the spectrum.This reduces the accessible wavelength range which is available for fast-ion distribution reconstructions.For the vertical view,the beam emissions have small shifts and are attenuated within the notch filter.However,the blueshifted wings show discrepancy between the measured and simulated spectra at low energy,which might be caused by passive FIDA emission [25].The characteristics of passive FIDA on EAST will be further studied in the future.

Figure 2.Time traces of EAST shot#75446:(a)plasma current,(b)line averaged electron density,(c)NBI injected heating power,including F-port heating beam (NBI2R) and A-port diagnostic beam (NBI1L).

Figure 3.Simulated TRANSP/NUBEAM fast-ion velocity distribution for shot #75446 at 4.2 s with simultaneous co-current beam(Pinj=0.68 MW, Efull=51 keV) and counter-current beam(Pinj=1.15 MW, Efull=56 keV).
Figure 6 shows the sum of all weight functions for FIDA measurements from the tangential and vertical views calculated by FIDASIM.It establishes a global overview of the direct relationship between the fast-ion velocity-space distribution and the measurement sensitivity to reveal the experimentally observed fast ions in different regions in phase space by FIDA.The tangential view mainly observes the FIDA spectra caused by passing particles,whereas the vertical view is mainly sensitive to trapped particles.Figure 6 indicates that the two FIDA views at EAST can simultaneously cover the part of velocity-space regions at higher absolute pitch values (|p|>0.3) and higher energies(E>30 keV).Previous tomographic studies have shown that a multi-view coverage is essential for obtaining reliable reconstructions in densely populated areas [16–26].From figure 3,it is evident that att=4.2 s during EAST shot#75446 fast ions are expected to predominantly populate the pitch regions 0.4<|p|<0.9 at energies above 30 keV,whereas the pitch region |p|<0.3 is only sparsely populated.This suggests that the two-view FIDA setup can provide reliable reconstructions of this type of fast-ion velocity distribution [25].

Figure 4.Measured FIDA spectra of EAST shot#75446,t=4.2 s,tangential view(O-port),ρ~0.17.Including spectra during the probe beam on(‘beam on’)and off(‘beam off’),net FIDA spectrum(‘net’)which is the difference between‘beam on’and‘beam off’.The strong D-alpha line without Doppler-shift at 656.1 nm is attenuated by a notch filter with a width of 2 nm.
4.Measurement-based reconstructed fast-ion velocity distributions
Based on two-view net FIDA signals shown in figure 5,we use the velocity-space tomography method to reconstruct the fast-ion distribution functions for all pitches in the energy range of 20–65 keV shown in figure 7.Two types of prior information are applied in the inversion process.First,distribution functions are always non-negative [20].Second,the absence of FIDA light at a particular wavelength allows us to conclude that the corresponding region in velocity space is sparsely populated,at least below the detection limit of the FIDA diagnostic [20,22].Compared with the fast-ion distribution function from TRANSP/NUBEAM,using only non-negativity as prior information (figure 7(a)) captures the shape of the simulated TRANSP fast-ion velocity distribution.However,it presents artifacts at high energies.These can be suppressed when applying both null-measurements and nonnegativity as prior information shown in figure 7(b).This shows that the inclusion of null-measurements strongly benefits tomographic reconstructions at EAST.The precise velocity-space positions of neutral beam injection peaks are still difficult to reconstruct from this two-view FIDA setup,which can be resolved by further prior information based on NBI geometry.In the following section,we will show how the inclusion of a proposed third FIDA view in combination with the existing O- and B-port FIDA views will affect the reconstructions and improve the reconstruction of the beams peak location in parts of velocity-space,without explicitly including prior information about the fast-ion birth velocities.
5.Reconstruction including synthetic signal from proposed third FIDA view
To obtain a better coverage of the velocity space by FIDA measurements on EAST,we propose a planned FIDA view from the A-port integrated with the previous CXRS measurements [43].Figure 8 shows FIDASIM weight functions of three FIDA views for a blue and a red Doppler shift with an approximate mirror-symmetry based on the pitch.The tangential view from O-port observes ions with higher pitch and has a narrower-shape weight function.Compared with vertical views from B-port,the proposed FIDA views from A-port have a rather broader range around zero pitch.
Choosing the same observed volume,the synthetic spectra from A-port are calculated from the TRANSP/NUBEAM distribution function.A 10%noise level and a 0.1 nm instrumental broadening are added to mimic measurement conditions,figure 9 shows the synthetic FIDA signal from the A-port.With the large red Doppler-shifts of the beam emissions,almost all red-shift wings of FIDA signal are not accessible illustrated by the gray part in the figure.
The first tomographic reconstruction off(energy,pitch)from the measurements through the existing O-port and B-port FIDA views as well as the synthetic signal from A-port is shown in figure 10.In the positive-pitch range,the reconstruction of the fast-ion velocity distribution from multi-view is improved compared with that from the double-view,due to the better velocity-space coverage of the multi-view system.From figure 10(b),the fast-ion distribution against energy from multi-view is much closer to that from TRANSP calculations for positive pitches.However,as the red-shifted wavelength is not accessible from the A-port,there are no improvements for the negative-pitch region.
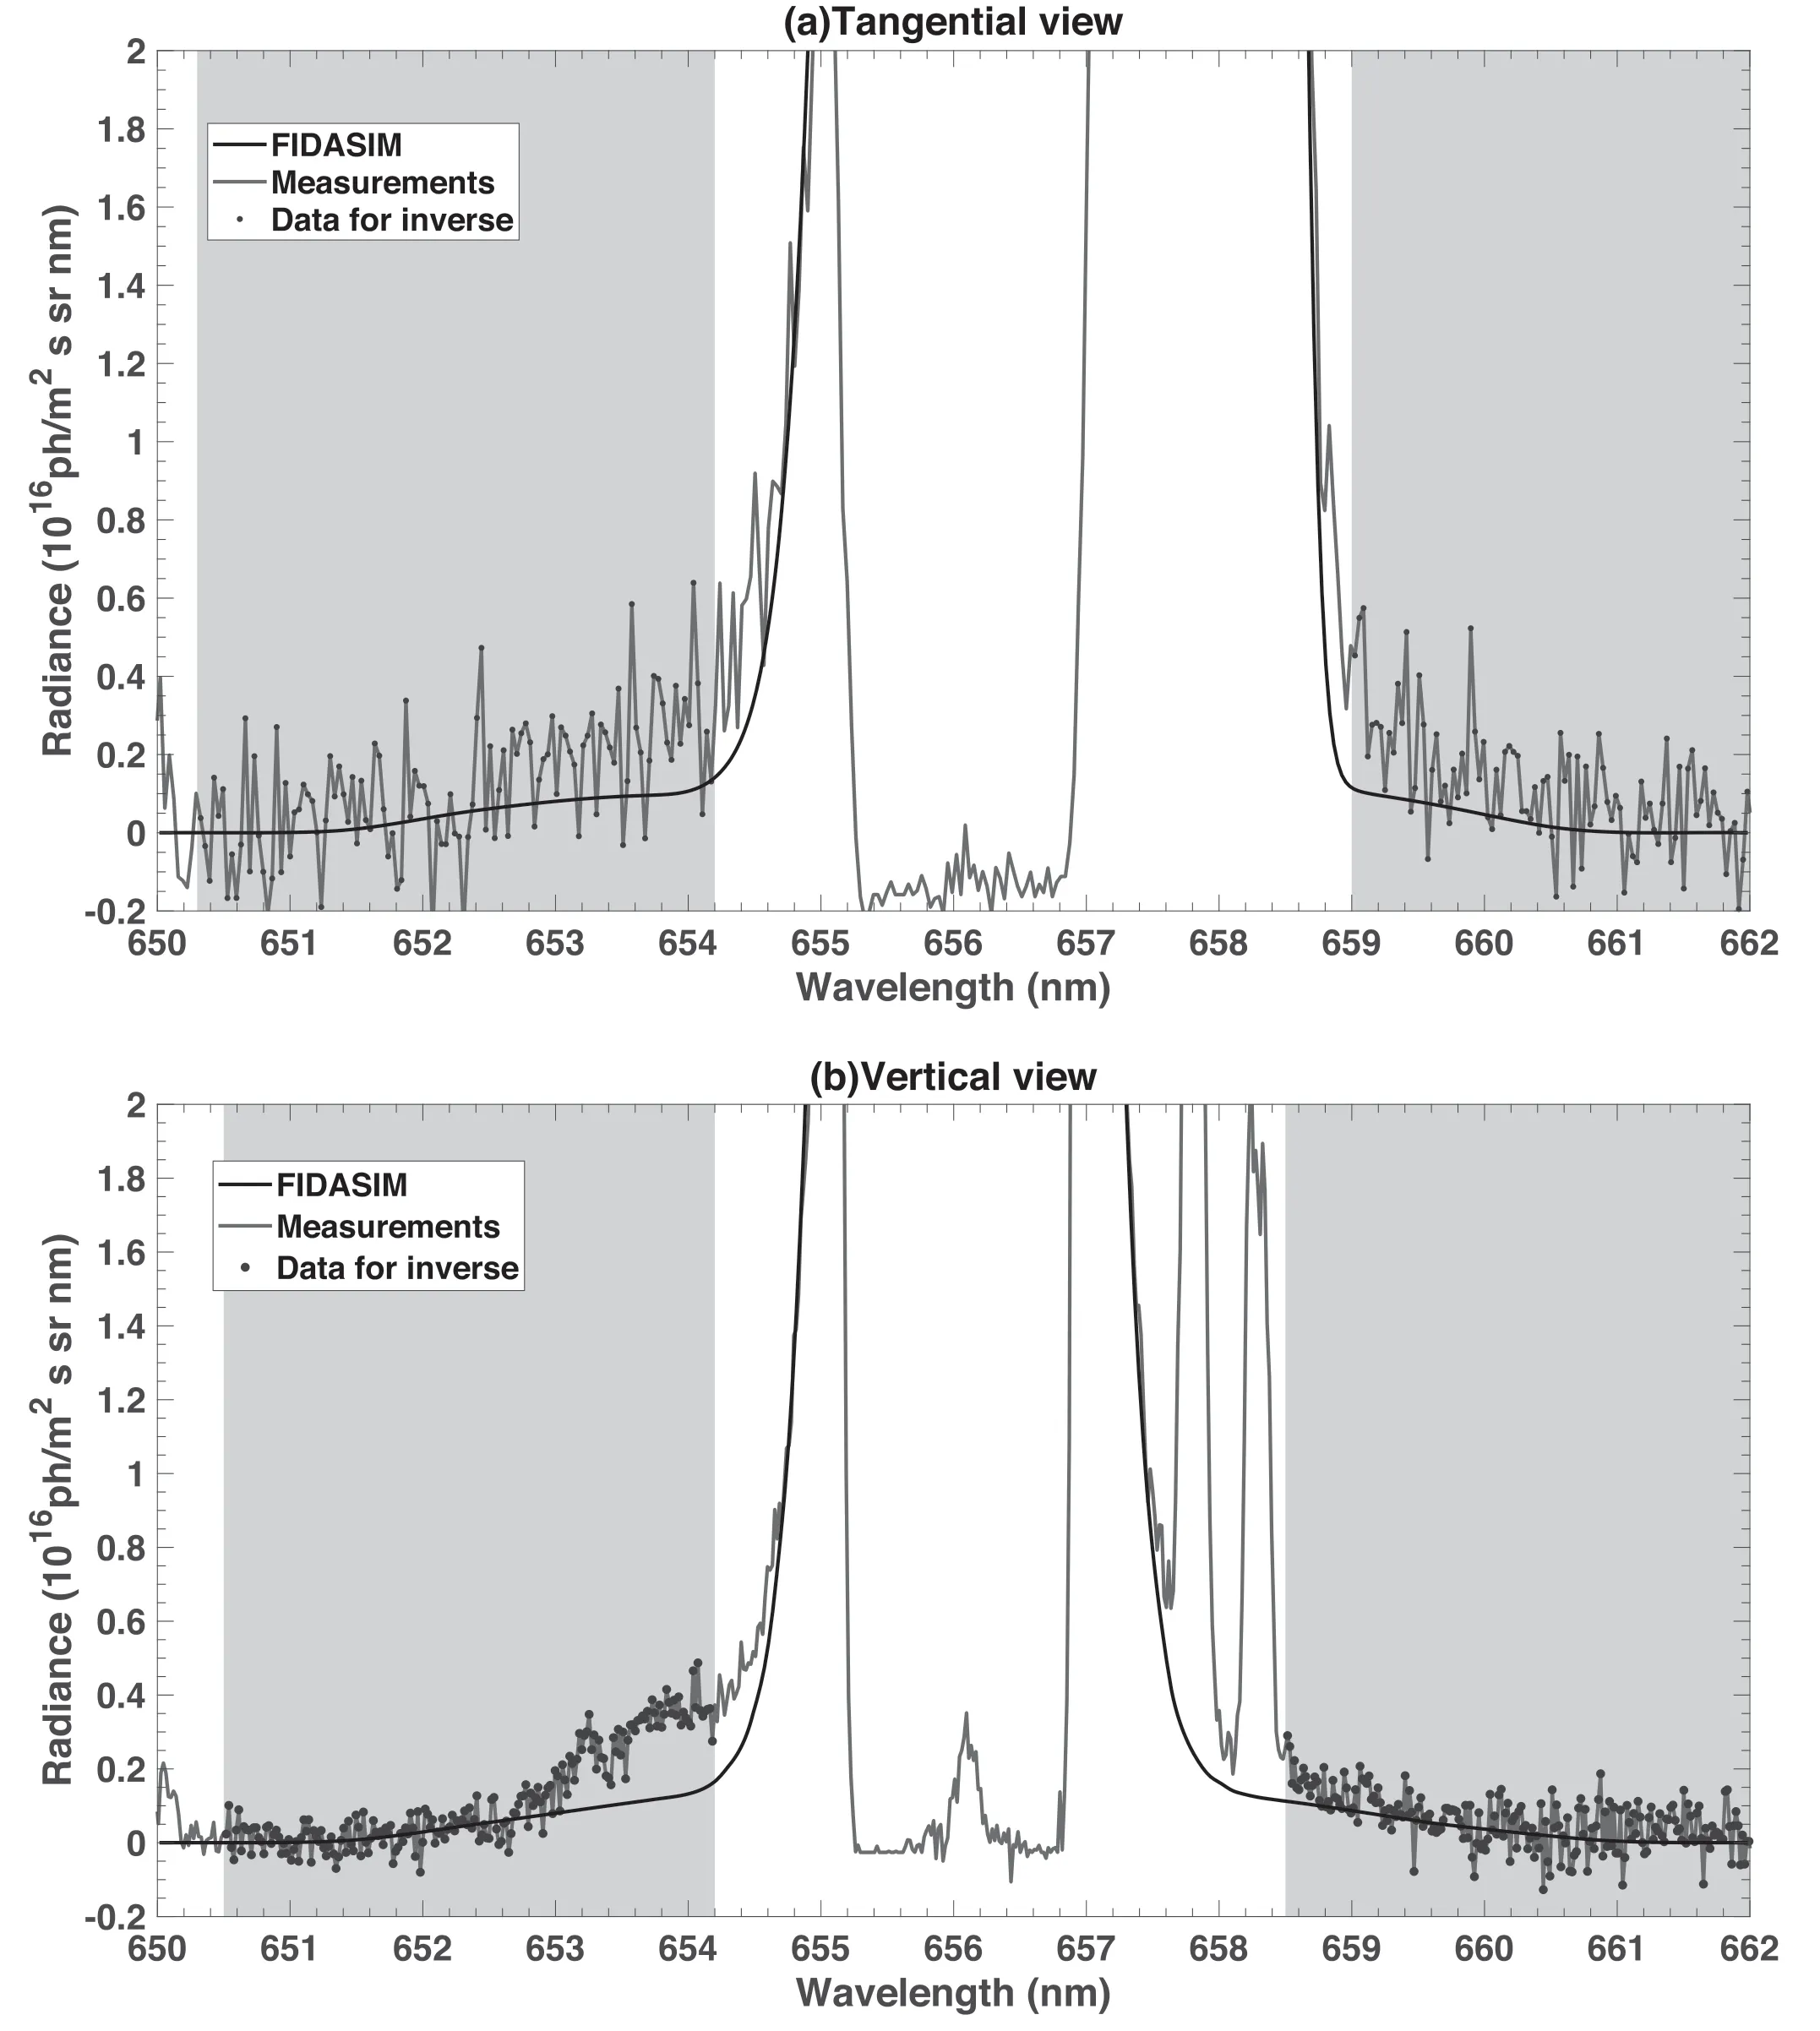
Figure 5.Simulation results given by FIDASIM and measured net FIDA spectra at ρ~0.17 from(a)tangential view,(b)vertical view.The blue data points(the gray part)are valid FIDA data selected from the measured spectra and will be used to reconstruct the fast-ion velocity space distribution in section 4.
6.Conclusion
Figure 6.The normalized full FIDA weight function,normalized by its own maximum value,coverage of all valid FIDA measured wavelength range as the gray part in figure 4 from LOS at ρ~0.17 with (a) tangential view,(b) vertical view.

Figure 7.Fast-ion velocity-space distribution at ρ~0.17 in EAST during shot #75446,reconstruction from the measured FIDA spectra using different prior information:(a)non-negative of the distribution in all pixels,(b)non-negative of the distribution in all pixels and nullmeasurement as a penalty [22].The black curve marks the null-measurement region,which comes from the combination of the measured weight function and the null-measurement wavelength range of the available data as input to the inversion code.
2D fast-ion velocity-space distributions have been reconstructed from two-view FIDA measurements on EAST.For FIDA spectra,both the measured red-shifted and blue-shifted wings from O-port have a good agreement with FIDASIM simulations.However,there is a discrepancy shown in the blue-shifted wings between the measurements and the simulations,which might be caused by passive FIDA emission.To make up for the sparse data and incomplete velocity-space coverage with the dual-view,the inclusion of prior information in the zeroth-order Tikhonov method is necessary in order to make a reliable reconstruction.With non-negativity as prior information,the distribution from simultaneous coand counter-current injection has been reconstructed over all pitches in the energy range of 20–60 keV.Further,combining non-negativity and null-measurements results in suppressing artifacts at higher energies.An improved reconstructed fastion distribution is achieved by combining the O- and B-port FIDA measurements with that from the proposed A-port FIDA view for pitch >0 region.This is because three-view FIDA has a better velocity-space coverage than the two-view,however,the larger Doppler-shift of beam emission dominates the red-shift wings of synthetic FIDA signals from A-port making the measurement data in this wavelength range inaccessible for the inversion.To further improve the reliability of FIDA-based reconstructions on EAST,velocityspace tomography based on real multi-view FIDA measurements on EAST will be demonstrated in the near future,together with applying various bases on the tomography,including the first-order Tikhonov method,more prior information such as known peaks in velocity space,and the inclusion of a fast-ion slowing-down process model in the reconstruction.
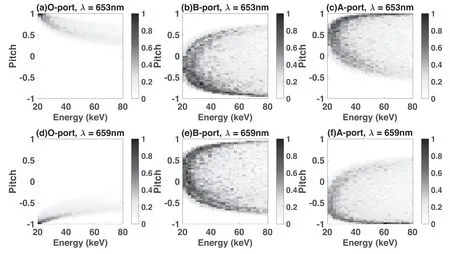
Figure 8.FIDA weight functions,normalized by their maximum values,for the existing O- and B-port FIDA views together with the proposed view from the A-port,at 653 nm for blue shift (a)–(c),and 659 nm for red shift (d)–(f).

Figure 9.Synthetic FIDA spectrum(black)simulated by FIDASIM for shot#75446 conditions at ρ~0.17,t=4.2 s.Either the halo(blue)or beam(green)emissions dominate the FIDA signal.The red data points(in the gray part)are added with 10%simulated noise as input to the inversion program.
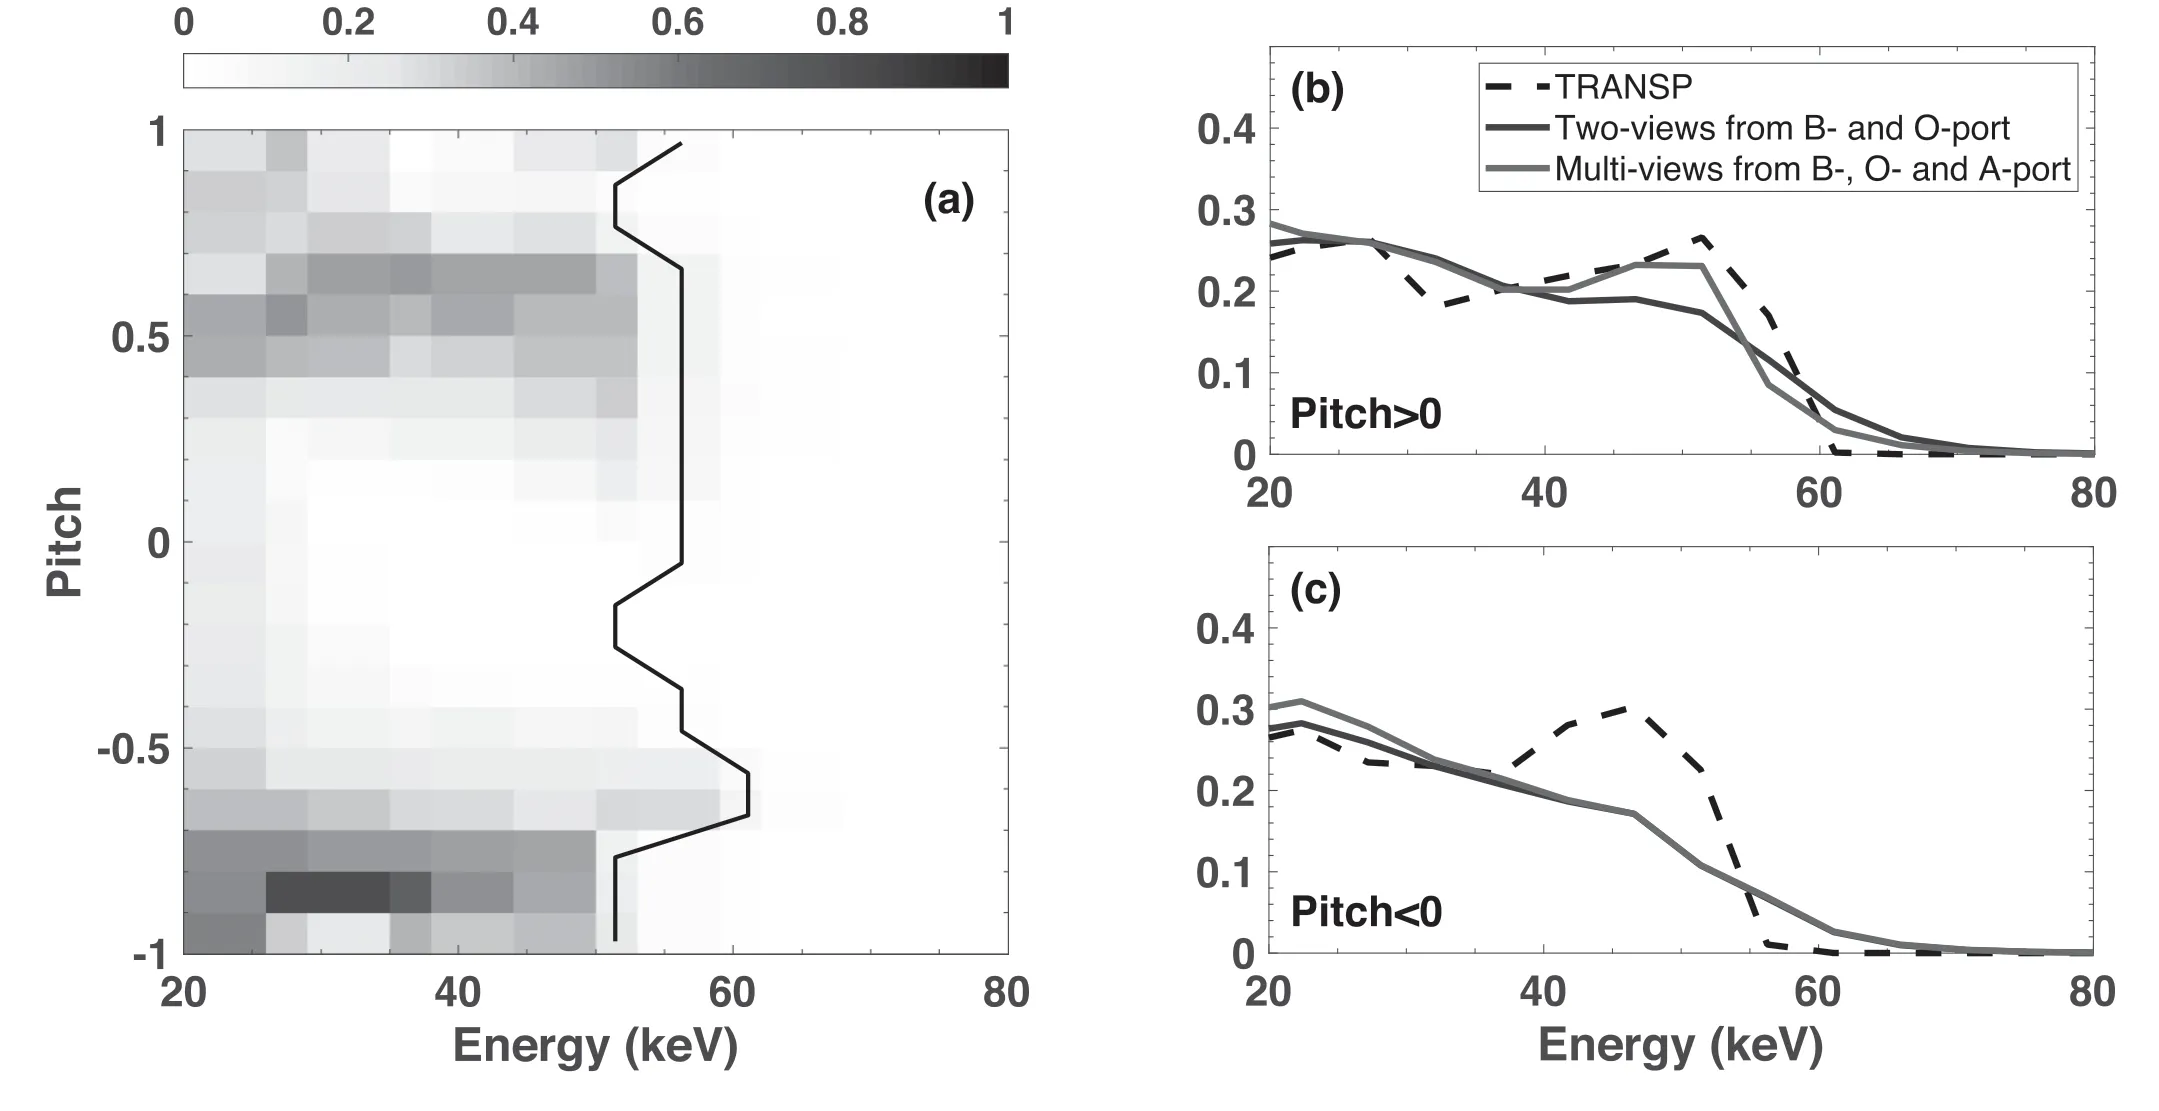
Figure 10.(a)Fast-ion velocity-space distribution in EAST during shot#75446 at ρ~0.17,reconstruction from the existing O-and B-port FIDA views together with the synthetic signal from the A-port; and energy spectra of the fast-ion distribution given by the integral along pitch from velocity distribution from TRANSP,two-view reconstruction and multi-view reconstruction:(b)positive pitch;(c)negative pitch.
Acknowledgments
This work is supported by National Natural Science Foundation of China (No.11975276),Anhui Provincial Natural Science Foundation(No.2008085J04),Anhui Provincial Key R&D Programmes(No.202104b11020003),and the National Key Research and Development Program of China (No.2019YFE03020004) and the Excellence Program of Hefei Science Center CAS (No.2021HSC-UE015).We thank the ITPA Topical Group for Energetic Particle Physics for their support.
ORCID iDs
杂志排行

Plasma Science and Technology的其它文章
- Recent results of fusion triple product on EAST tokamak
- Suppression and mitigation of inter-ELM high-frequency Alfvén-like mode by resonant magnetic perturbation in EAST
- Simulations of NBI fast ion loss in the presence of toroidal field ripple on EAST
- Tomography of emissivity for Doppler coherence imaging spectroscopy diagnostic in HL-2A
- Comparison of natural grassy ELM behavior in favorable/unfavorable Bt in EAST
- The investigation of quasi coherent mode on EAST using Doppler reflectometry