Numerical investigation on the flow characteristics of a reverse-polarity plasma torch by two-temperature thermal nonequilibrium modelling
2021-09-10ZhengxinYIN尹政鑫DepingYU余德平YanaWEN文雅娜QingboZHANG张清波JierQIU邱吉尔andShengyuanYANG杨胜源
Zhengxin YIN (尹政鑫),Deping YU (余德平),Yana WEN (文雅娜),Qingbo ZHANG (张清波),Jier QIU (邱吉尔) and Shengyuan YANG (杨胜源)
School of Mechanical Engineering,Sichuan University,Chengdu 610065,People’s Republic of China
Abstract A two-temperature(2T)thermal non-equilibrium model is developed to address the thermal nonequilibrium phenomenon that inevitably exists in the reverse-polarity plasma torch (RPT) and applied to numerically investigate the plasma flow characteristics inside and outside the RPT.Then,a detailed comparison of the results of the 2T model with those of the local thermal equilibrium(LTE)model is presented.Furthermore,the temperature of the plasma jet generated by a RPT and the RPT’s voltage are experimentally measured to compare and validate the result obtained by different models.The differences of the measured excitation temperature and the arc voltage between the 2T model and experimental measurement are less than 13% and 8%,respectively,in all operating cases,validating the effectiveness of the 2T model.The LTE model overestimates the velocity and temperature distribution of the RPT and its plasma jet,showing that thermal non-equilibrium phenomena cannot be neglected in the numerical modelling of the RPT.Unlike other common hot cathode plasma torches,the thermal non-equilibrium phenomenon is found even in the arc core of the RPT,due to the strong cooling effect caused by the big gas flow rate.
Keywords: optical emission spectroscopy,reverse-polarity plasma torch,temperature measurement,two-temperature thermal non-equilibrium modelling
1.Introduction
The reverse-polarity plasma torch (RPT) [1] is a promising plasma source for material processing,e.g.plasma atomization for spherical powder [2,3] and plasma synthesis for nanostructured carbon[4],due to its high temperature plasma jet and thermal efficiency.It is a hollow electrode plasma torch as shown in figure 1(a),in which the rear cup-shaped tubular electrode is configured as the anode while the front open-ended tubular electrode is the cathode,as opposed to that in the normal-polarity plasma torch (NPT) as shown in figure 1(b).In such a configuration,the cathode arc root is usually located near at the outlet of the cathode [1,4–6],resulting in an elongated arc column and thus continuous heating of the plasma-forming gas until the exit of the plasma torch.Such a feature ensures several unique advantages of the RPT,including high enthalpy plasma jet,very low level of electrode erosion rate,high thermal efficiency,etc.
The performance of the RPT in industrial applications highly depends on the accurate prediction of the temperature and velocity distributions of the generated plasma jet,which is determined by the plasma flow characteristics inside and outside the plasma torch.However,due to the difficulties in measuring the velocity and temperature inside the plasma torch,it is necessary to carry out the numerical modelling to reveal the flow characteristics of the RPT.Numerical modelling of the RPT based on the assumption of the local thermal equilibrium (LTE) has been applied to calculate the plasma flow inside and outside the RPT [4,5,7].Although the LTE model is convenient in terms of the implementation and calculation costs,it should be carefully examined as the thermal non-equilibrium phenomena inevitably exists in the regions where kinetic equilibrium between heavy particles and electrons is not achieved[8–11].Furthermore,in the LTE model,an artificial electrical conductivity is usually specified in the low-temperature area for the continuity of the current density [12–14],leading to the LTE model’s incapability for accurately reproducing all the flow characteristics of a direct current plasma torch.
In this work,to deal with the thermal non-equilibrium phenomena that inevitably exist in the RPT,a two-temperature thermal non-equilibrium model(2T)was developed and applied to numerically predict the plasma flow characteristics inside and outside the RPT.A detailed comparison between the 2T model and the LTE model will be conducted to reveal the thermal non-equilibrium region in the RPT.In addition,the temperature of the generated plasma jet and the RPT’s arc voltage will be experimentally measured to compare and validate the numerical results obtained by different models.
2.Methods
2.1.Numerical modelling
In the following paragraph,the assumption,governing equations,computational domain as shown in figure 2 and boundary conditions are reported.
2.1.1.Assumptions.The LTE and 2T models are based on the following assumptions:
The plasma flow is steady and axially symmetric.In the LTE model,the plasma is characterized by a single temperatureTwhile the plasma is characterized by the electron temperatureTeand the non-equilibrium parameterθ=Te/Th(This the heavy particle temperature) in the 2T model.
The plasma is in chemical equilibrium.In the 2T model,considering the range of the temperature(2000–15000 K),double ions of argon (Ar2+) may be neglected and thus the argon plasma is a mixture of heavy particles (Ar and Ar+) and electrons.
The plasma is optically thin and the effects of gravity and viscous dissipation are ignored.
2.1.2.Governing equations.Along with the above assumptions,a series of MHD (magnetohydrodynamics) equations based on the usual Navier–Stokes equations have been chosen to describe the thermal plasma flow.All the associated conservation equations have the generic form [15]:
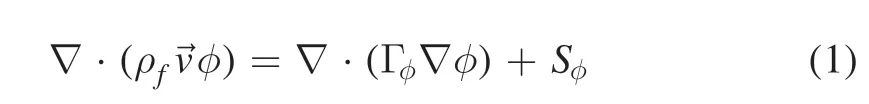
where φ is the quantity conserved,ρfis the mass density of the fluidffor momentum equations and the mass density times the specific heat for temperature equations,Γφis the corresponding diffusion coefficient,andSφis the associated source term.vis the velocity vector with axial (vz),radial (vr) and azimuthal (vθ)components.Table 1 demonstrates the detailed forms of various conservation equations.
Φ,AzandArare the electric potential,axial and radial components of the magnetic vector potential,respectively,and the advective terms of these three scalars are equal to 0.pis the pressure.jrandjzare the radial and axial current densities,respectively,which are calculated according to the Ohm’s law:

Bθis the self-induced magnetic field written as:

v,σ andkare viscosity,electrical conductivity and thermal conductivity,respectively.With regard to turbulence,aε−kturbulent model was used to take into account the effect of turbulence in the present paper.However,it has been assumed that the thermal conductivity of electrons (ke) remains unaffected by turbulence while the 2T model is adopted.In addition,the turbulent thermal conductivity (kth),turbulent viscosity of heavy particles (νt),effective viscosity (νeff) andthe generation term (G) in table 2 are defined as
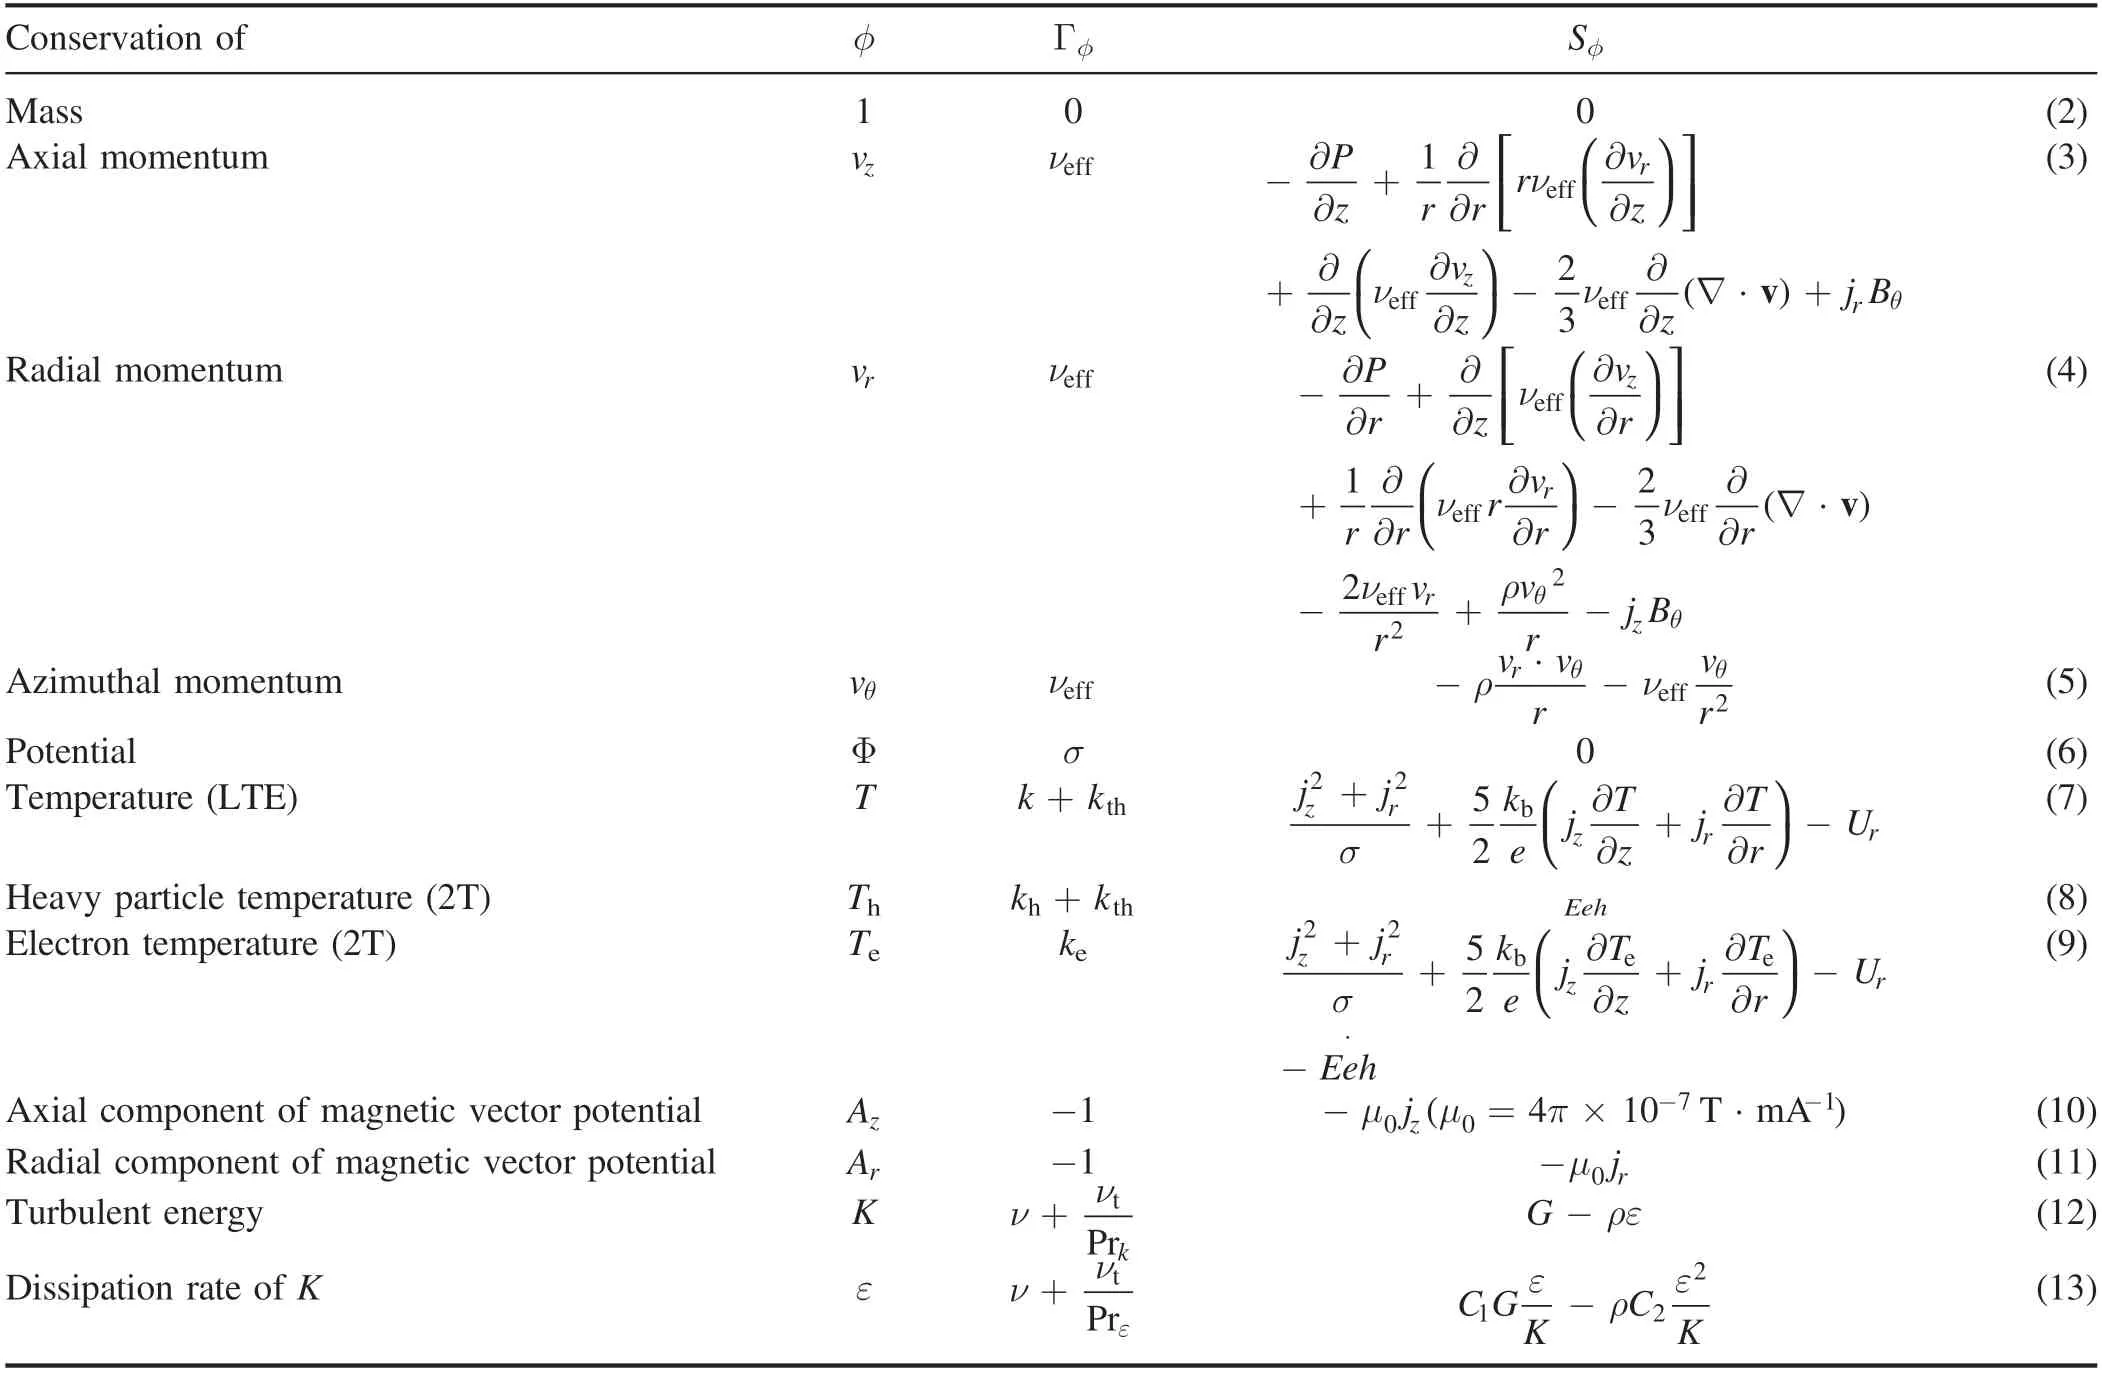
Table 1.Terms of the governing equations.
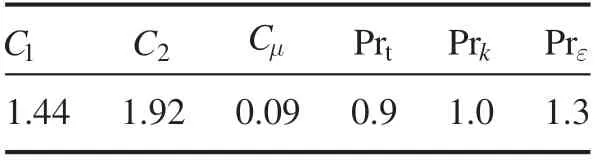
Table 2.Constants of the ε−k turbulent model.
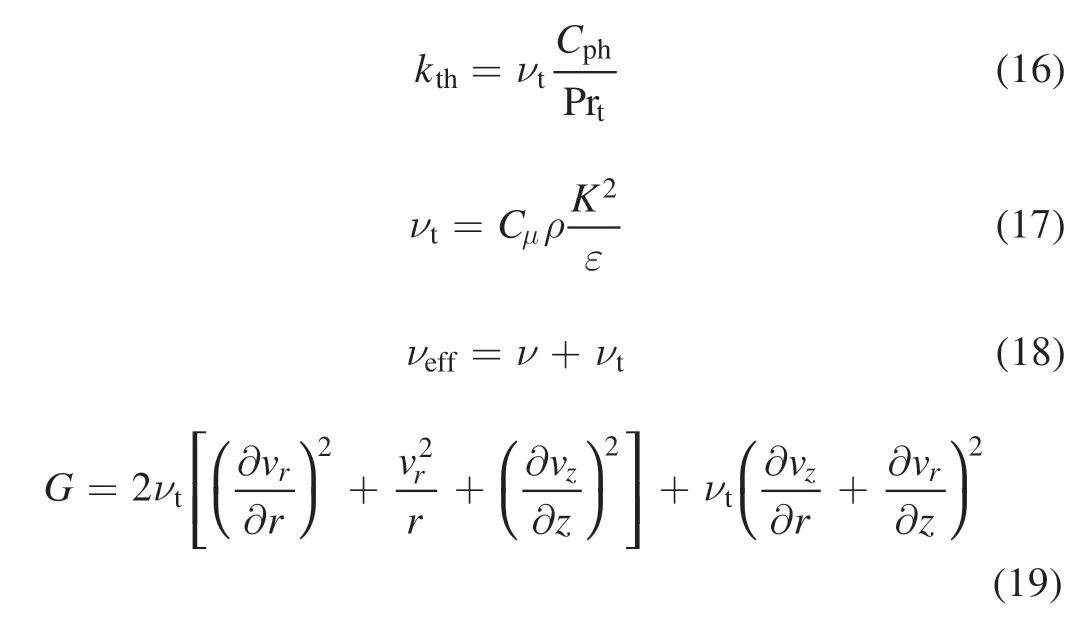
whereCph,Prt,Prkand Prεare the specific heat of heavy particles,the turbulent Prandtl number,and the turbulent Prandtl number ofkand ε,respectively.Those constants used in theε−kturbulent model are listed in table 2 [15,16].
In the energy conservation equation,Urrepresents the volumetric radiation loss.In the LTE model,the volumetric radiation loss is approximated by the use of a net emission coefficient εrfor pure argon [17]:
In the 2T model,the volume radiation loss is represented as the sum of the electron-neutral free-free radiation,electronion free-free radiation and the line radiation [11,18,19]:

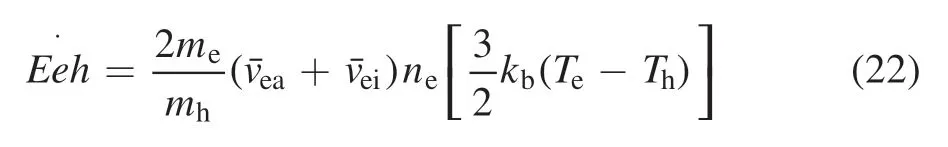
within 1020m−3andin 1024m−3.Eehis the electronheavy particle energy exchange term,which is evaluated by wheremeandmhare the mass of electron and the mass of the argon heavy particle,respectively.¯veais the collision frequency between the electron and the atom,which is estimated byis the collision frequency between the electron and the ion and is given byis the average collision cross-section between the electrons and atoms.is the average collision cross-section between the electrons and ions.is the average thermal velocity of the electron.naandniare the number density of the atom and the ion.They are calculated by the Saha equation,the Dalton equation and the neutrality equation under the assumption of the chemical equilibrium.
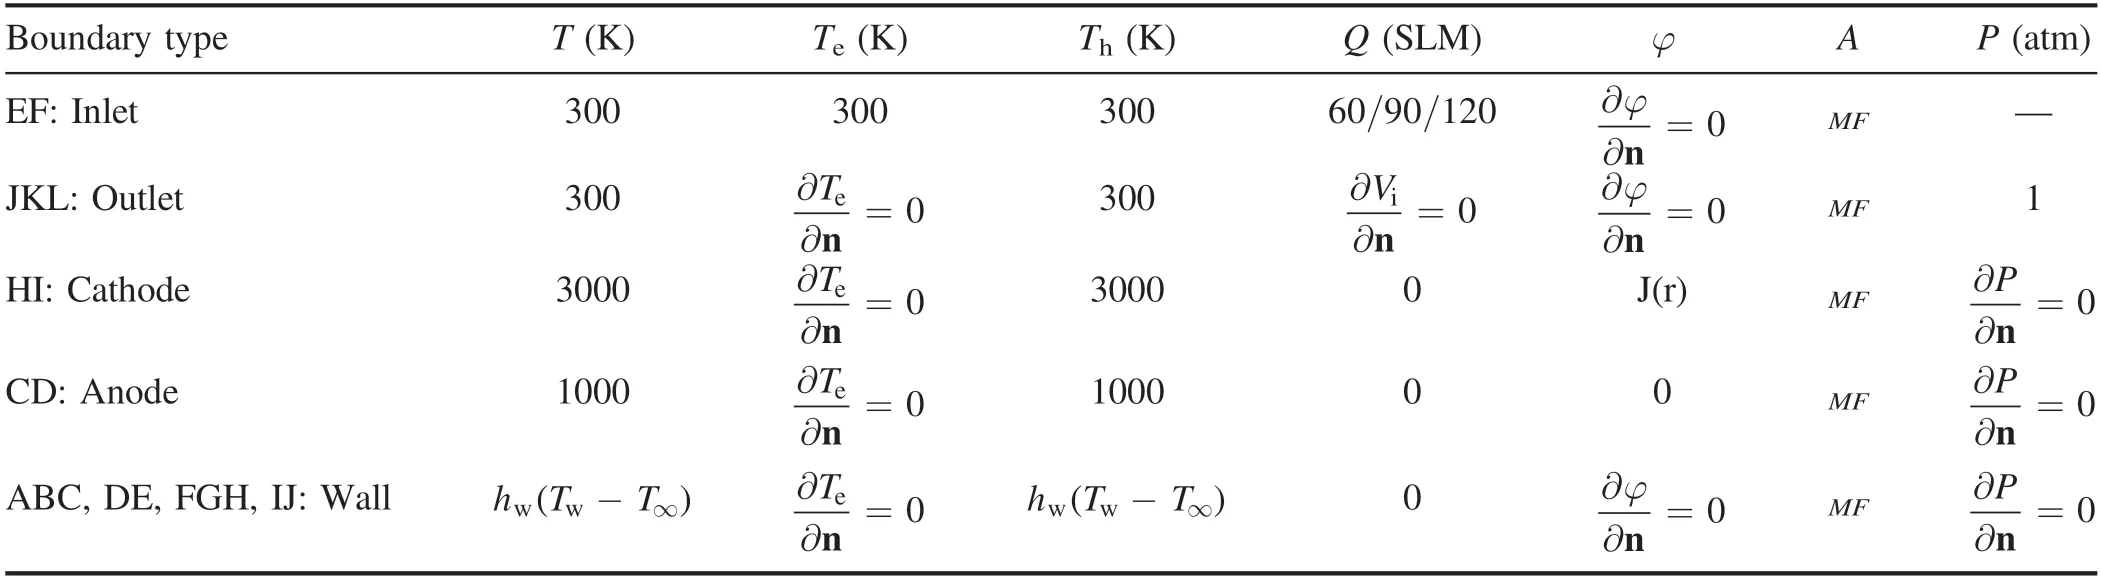
Table 3.Boundary conditions of the computational domain.
2.1.3.Computational domain and the boundary conditions.The computational domain of the RPT is shown in figure 2 and the corresponding boundary conditions are listed in table 3.
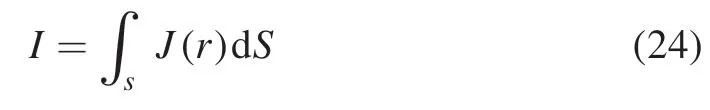
In this table,the inlet boundary condition adopts the mass flow inlet and its value of mass flow rate is set as the same as the experimental input.The temperature of the inlet is assumed to be the LTE state and is set up as 300 K.The pressure outlet,which is set as an atmosphere,is applied to represent the outlet condition.For the boundary condition of the cathode,the temperature in the LTE model and the heavy particle temperature in the 2T model are both assumed to be 3000 K.The assumption of temperature boundary condition on the cathode arc root does not considerably affect the plasma fields,since the given current density conditions govern them in front of the cathode arc root.The distribution of current density on the cathode surface is in the form of an exponential profile of the current densityJ(r) as in the following equation:
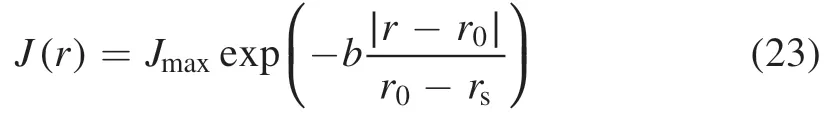
whereris the axial position in this mesh,r0represents the center of the cathodic arc spot,andrsis the position at the end of the cathodic arc spot.In this study,Jmaxis 1.6×10⁷A m−2and∣r0−rs∣is 2.5×10⁻³m[5].The exponent coeffciientbin theJ(r) profile is determined from the following equation:
Iis the arc current in the experiment.For the anode boundary condition,the electrical potential on the anode surface is assumed to be zero.The temperature in the LTE model and the heavy particle temperature in the 2T model at the anode surface are both 1000 K.Moreover,the actual positions of the cathode arc root and anode arc root are designated according to the erosion trace left on the electrode surface after experiments.In this study,for the precise prediction of the magnetic vector potential inside the RPT,a mixed formulation (MF) method is adopted [20].The Biot–Savart’s law:
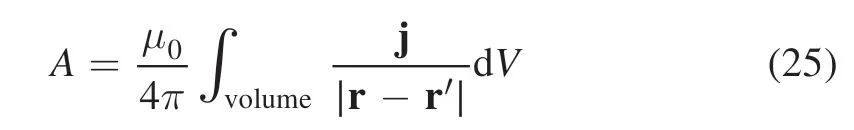
is used to calculate the value of the magnetic vector potential along the boundaries while the magnetic vector potential inside the RPT is governed by equations (10) and (11).For the wall boundary condition,the heavy particle temperature is the same as the temperature of the LTE model.To consider the water-cooling effect on the electrode surface,a water-cooling condition is defined as
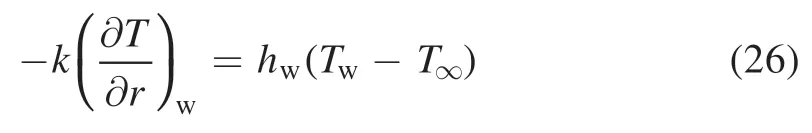

Table 4.Working parameters of the RPT in numerical simulations.
wherehw,which equals 1.0×10⁵W m−2K−1,is the heat transfer coefficient.Twis the reference temperature of the electrode set as 500 K [21].Finally,in the 2T model,the boundary condition for the electron temperatureis used on the wall,anode and cathode.
The RPT uses argon as the plasma-forming gas.Argon is typically used as the plasma-forming gas,as it is an inert gas and will not react with the processed materials during industrial applications such as plasma atomization and material synthesis,ensuring the purity of the final product.The thermodynamic and transport properties of the argon plasma under LTE and 2T assumptions are both from Liet al[22,23].The transport property of the argon plasma is calculated based on the solution of the Boltzmann equations using a modified Chapman-Enskog method,which takes into account the diffusion processes.However,an artificial electrical conductivity below 9000 K is necessary in order to build the electrical arc between the anode and cathode in the LTE model [12].In addition,the number density of the electron also follows an artificially specified procedure by settingne←max (ne,1015) (neand 1015in m−3)to prevent the divergence during iterations [11].
The commercial CFD software (Ansys Fluent) with the SIMPLE algorithm was used to carry out the simulation,as itprovides user-defined function(UDF)and user-defined scalar(UDS) methods to deal with the extra source terms and governing equations needed for the complex physical model.For comparison of the 2T model and LTE model and to reveal the effect of arc current and gas flow rate on plasma flow characteristics,including the thermal non-equilibrium phenomena,temperature and velocity distributions,the 2T and LTE numerical simulations of the RPT under the working parameters as listed in table 4 designed by the control variable method are both carried out.
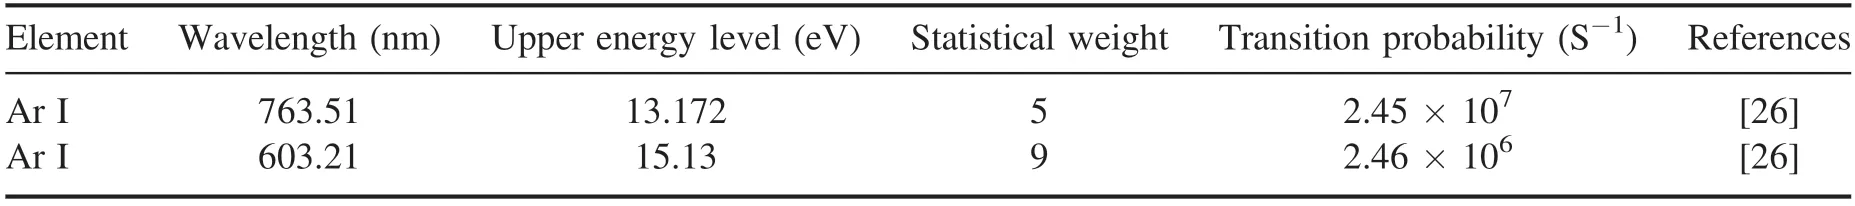
Table 5.Spectroscopic constants for neutral argon lines used in this study.
2.2.Spectroscopic method for the temperature measurement
It has been widely accepted that the emission intensities can be used to calculate the excitation temperature,which is approximate to the electron temperature [24],based on the Boltzmann distribution given by

wheren iois the number density of theith excited state,giis the known statistical weight or degeneracy of the excited state,Z(Texc) is the partition function of the spices,Euis the excitation energy,kbis the Boltzmann constant,andTexcis the excitation temperature,which is approximately equivalent to the electron temperature.Then,the emission coefficientελgenerated by electron transitions from the upper energy levelito the lower energy leveljcan be written as:

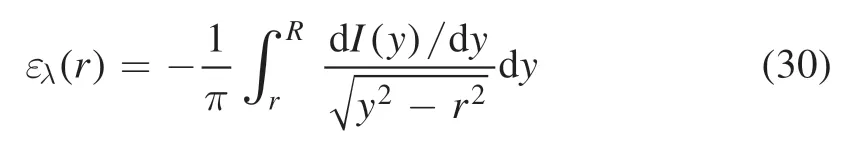
whereAijis the transition probability ofitojtransition,his the Planck constant,cis the speed of light in vacuum,andλijis the wavelength.However,the observed intensity of the emission line is the integral value of the emission efficient in the direction of observation:

Therefore,the Abel inversion shown in equation (30) is needed to obtain the emission coefficient,which is the function of the radius.
As German became part of the family he considered it his duty to check every bedroom to be sure each child was snug11 in bed. When he was satisfied that the last person was tucked in, he took up his position by the front door and remained there until the morning.
Then,with the obtained emission coefficient,the common approaches,such as the absolute intensity method,the relative intensity method and the Boltzmann plot method,can be applied to evaluate the temperature distribution along the radial direction.However,in this paper,in order to improve the measurement accuracy of the region with poor signal-tonoise ratio and take advantage of the absolute intensity method without the intricate calibration,Boselli’s hybrid method[25]was applied to calculate the electron temperature.In Boselli’s hybrid method,two wavelengths(λ ul1,andλ′′u l1,)of the same species are chosen and a relative line intensity method (equation (31)) is adopted to calculate the electron temperature on the axisTe(0):
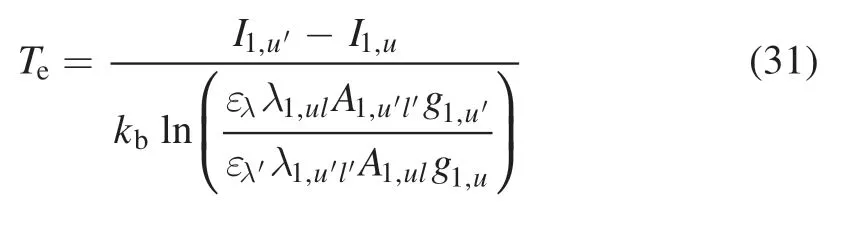
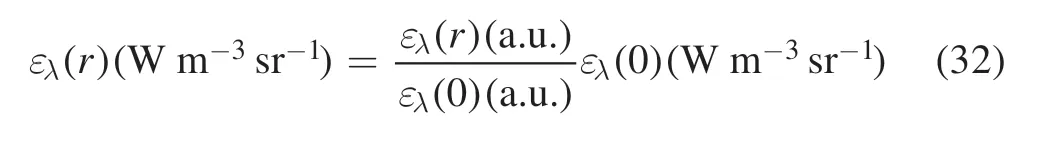
where ′uand ′lare the levels of the second emission line.Then,with the obtainedTe(0),the ( )ελ0 is calculated by using equations (27) and (28).Finally,the radial profile of the electron temperature can be calculated from the radial profile of the absolute emission coefficient,which is calibrated using the following equation:
In this study,the two selected wavelengths and their physical constants used during the calculation are listed in table 5.The reason why the Ar I line at 763.5 nm was chosen as one line to calculate the electron temperature is that it has strongest intensity compared with the other Ar I lines in the measurement.For the accuracy of the calculation,the biggest possible upper energy level difference should be achieved,which is why the Ar I line at 603.21 nm was chosen as another line.
2.3.Experimental setup
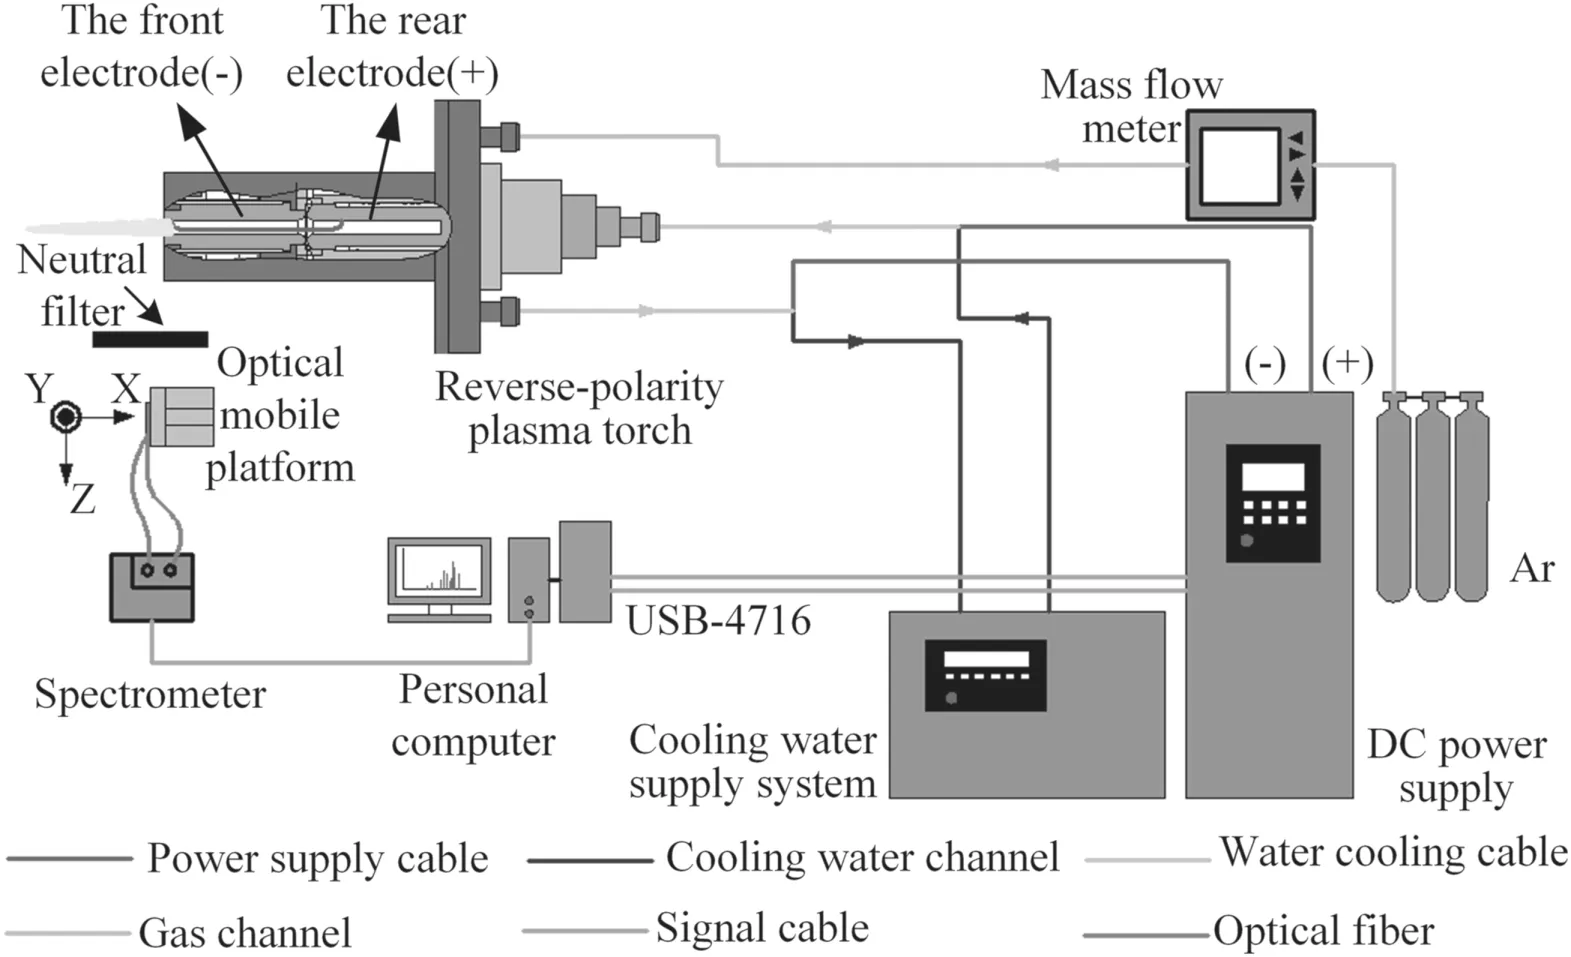
Figure 3.Schematic diagram of the experimental setup for OES.
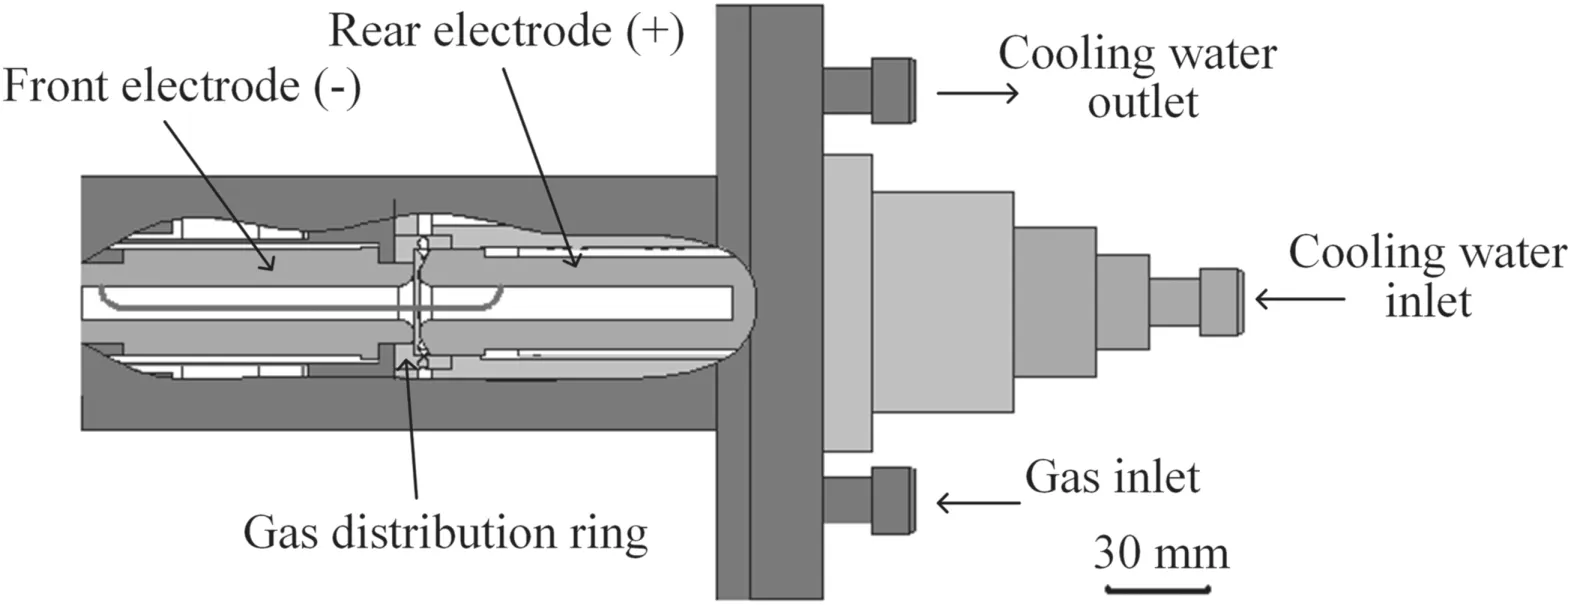
Figure 4.Schematic diagram of the RPT.
Figure 3 shows the schematic diagram of the experimental setup.It consists of a RPT,an insulated gate bipolar transistor(IGBT)-based constant-current DC power supply,a cooling water supply system to cool the plasma torch,a gas supply system to accurately provide the plasma-forming gas(argon),a data acquisition module (Advantech USB-4716) to sample the arc voltage,and an optical system to acquire the optical emission spectra(OES).The structure of the RPT is shown in figure 4.It consists of a copper front electrode,a copper rear electrode,a vortex gas distribution ring,the cooling water channel and the plasma-forming gas channels.The cooling water enters the plasma torch through the rear electrode and exits through the front electrode.The vortex gas distribution ring(8 holes with the angle of 45°),which is placed between the front and rear electrode,is used to generate vortex flow of the plasma-forming gas to confine the arc column and rotate arc spot on the surface of the electrodes to achieve a lower erosion rate.The optical system is composed of a spectrometer (Ocean Optics MX2500+),an optical fiber,an optical mobile platform and a neutral filter.The measuring range and the highest resolution of the spectrometer are 180–1100 nm and 0.1 nm (FWHM),respectively.The sampling frequency of the spectrometer was set to 1 Hz.Thus,the measured temperature is the time-averaged temperature during the whole measurement time.The optical fiber with an entrance slit of 100 μm was adopted to transmit the collected optical signal.The optical mobile platform can move along theXandYaxes with the moving range±12.5 mm to focus on different axial and radial positions of the plasma jet.The neutral filter is used to reduce the emission intensity of the plasma jet.
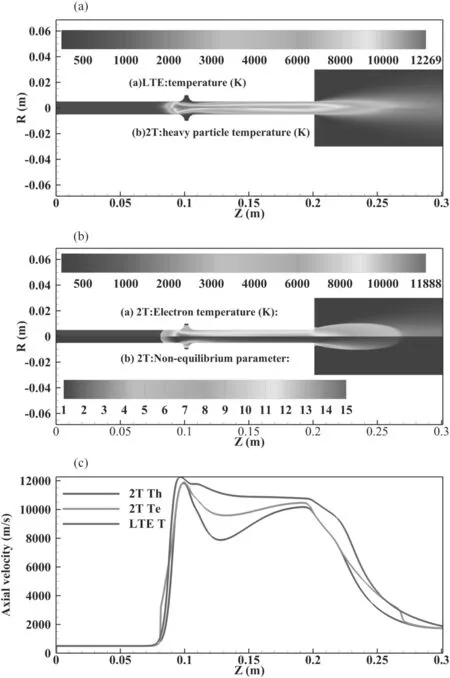
Figure 5.(a)The temperature distribution inside and outside the RPT at 80 A 60 SLM.The lower half shows the distribution of temperature of 2T modelling and the upper half shows the distribution of heavy particle temperature of LTE modelling.(b)The electron temperature and the non-equilibrium parameter distribution inside and outside the RPT at 80 A 60 SLM.The lower half shows the distribution of the nonequilibrium parameter of 2T modelling and the upper half shows the electron temperature distribution of the of 2T modelling.(c) The distribution of the temperature along the center axis inside and outside the RPT at 80 A 60 SLM.
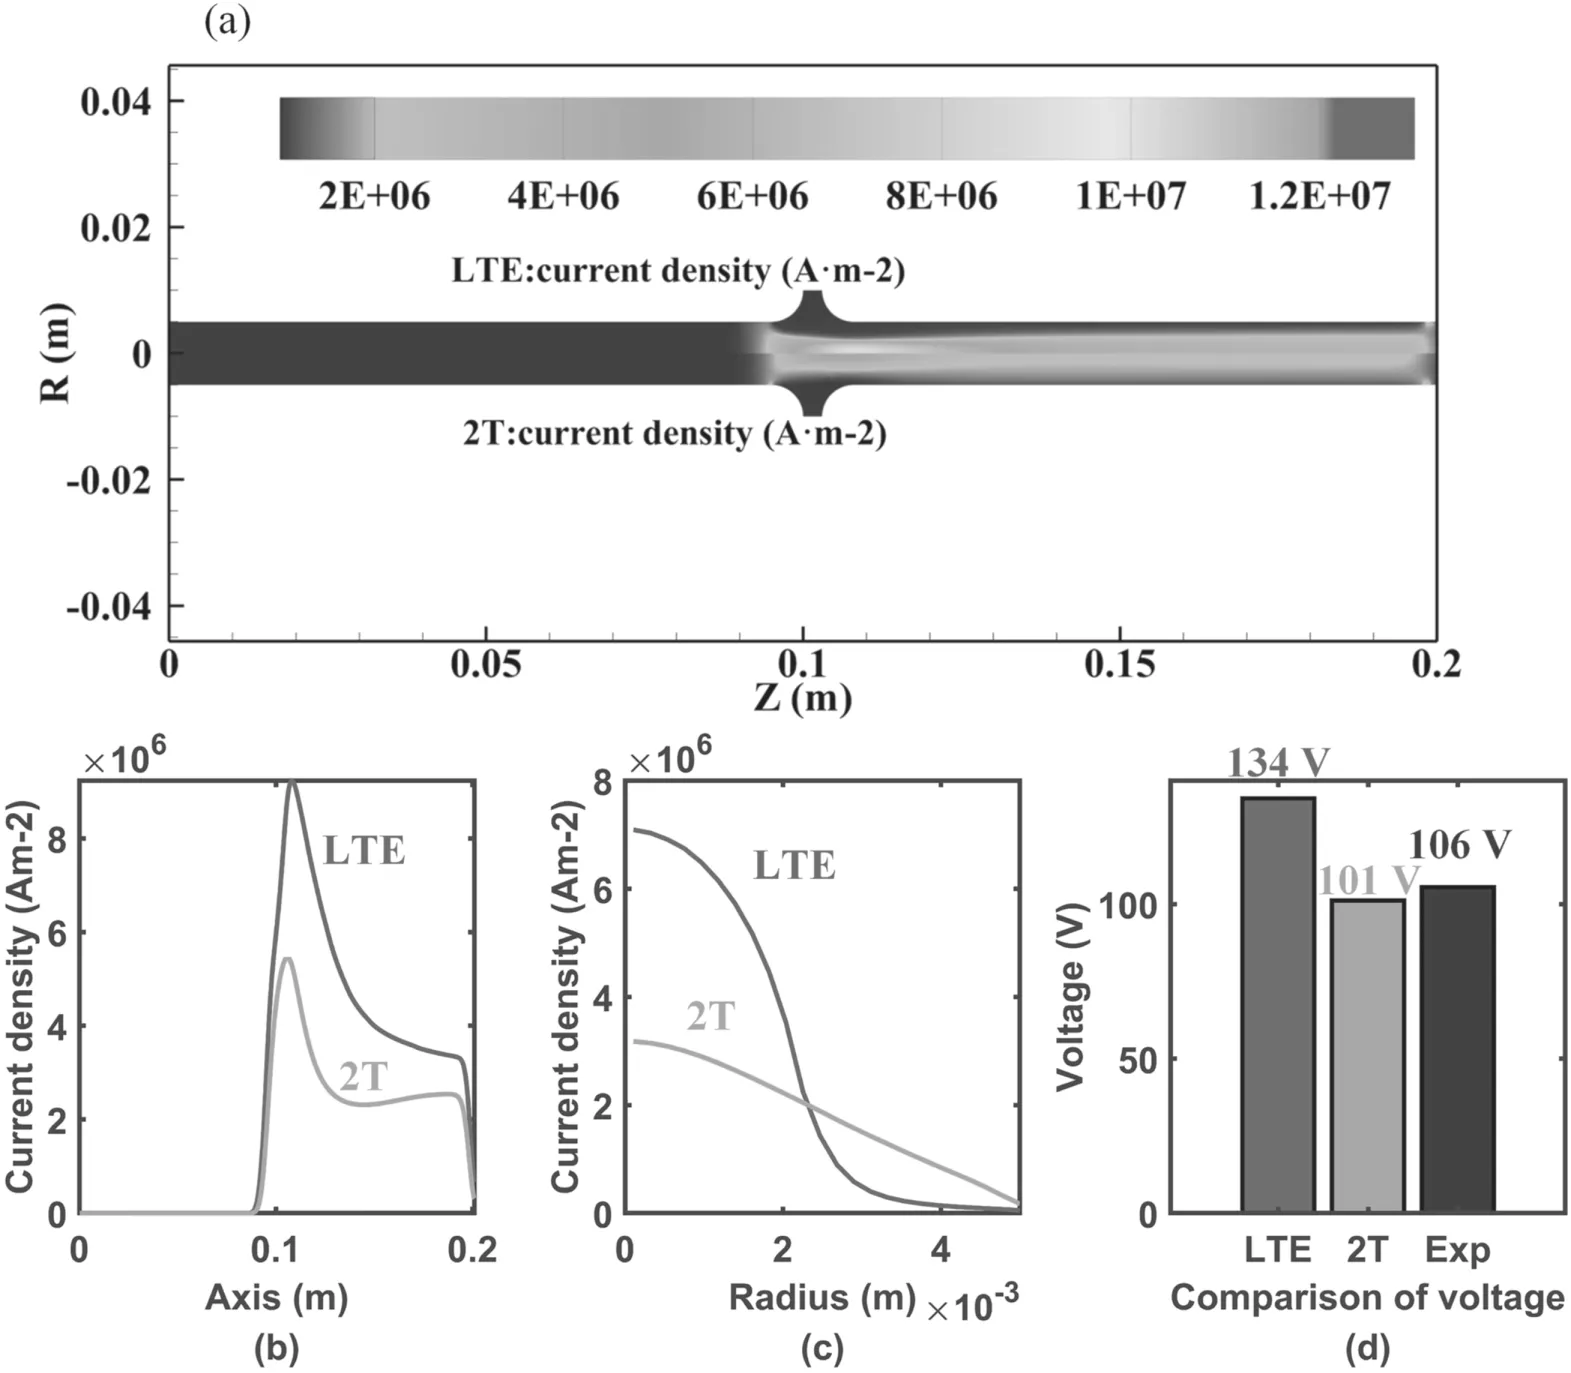
Figure 6.(a)The current density distribution inside the RPT at 80 A 60 SLM.The lower half shows the distribution of the current density of 2T modelling and the upper half shows the distribution of the current density of LTE modelling.(b) The distribution of the current density along the center axis inside the RPT at 80 A 60 SLM.(c)The radial distribution of the current density inside the RPT at the axial position of 0.12 m with working parameters as 80 A 60 SLM.(d) The comparison of the arc voltage obtained by LTE modelling,2T modelling and experimental measurements with working parameters as 80 A 60 SLM.
In order to validate the numerical results obtained by different models and working parameters,the temperature of the generated plasma jet and the RPT’s arc voltage are experimentally measured under the same working parameters as listed in table 4.
3.Results and discussions
3.1.Plasma flow characteristics obtained by LTE modelling and 2T modelling
Results of temperature,axial velocity,current density and self-induced magnetic field distributions at a standard working condition with 80 A 60 SLM obtained using the LTE modelling and 2T modelling are shown in figures 5–8,respectively.In these figures,the lower half shows the result of 2T modelling and the upper half shows the result of LTE modelling.

Figure 8.The self-induced magnetic field distribution inside the RPT at 80 A 60 SLM.The lower half shows the distribution of the selfinduced magnetic field of 2T modelling and the upper half shows the distribution of the self-induced magnetic field of LTE modelling.
The current density distribution is shown in figure 6.In figure 6(a),the arc column and its cathode and anode arc roots are clearly shown.The current density is predicted to reach its highest value at the inlet region of the plasma-forming gas,which can be proven in figure 6(b).In 2T modelling,the current density distribution is also found near the watercooling electrode.This is perfectly shown in figure 6(c): the radial distributions of the current density inside the RPT at axial position of 0.12 m with working parameters as 80 A 60 SLM demonstrate that the radial current density distribution of the LTE modelling is a high but narrow Gaussian profile,while the radial current density distribution of the 2T modelling is a short but wide Gaussian profile.This is a consequence of the high electrical conductivity of the area near the water-cooling electrode caused by the high electron temperature at this area.Due to the different distribution of the current density predicted by the 2T modelling,the predicted arc voltage of the 2T modelling is closer to the experimental measurement one illustrated in figure 6(d).Because of the neglect of the plasma sheath near the electrodes,the arc voltage of the 2T modelling is slightly smaller than the experimental one; however,the arc voltage of the LTE modelling is much bigger than the experimental one.
The velocity distribution is shown in figure 7.The velocity at the front electrode is remarkably higher than that at the rear electrode.The plasma flow is accelerated continuously by the arc current and achieves the highest axial velocity at the cathode arc root region.The axial velocity distributions along the center axis of LTE modelling and 2T modelling are both in the same tendency; however,the maximum axial velocity of the LTE modelling is nearly 100 m s−1higher than that of the 2T modelling.This can be attributed to the different distribution of self-induced magnetic field between the LTE and 2T modellings.As mentioned above,the current density distribution of LTE modelling is more concentrated,and thus the peak current density is also higher than that of the 2T modelling.As a result,the selfinduced magnetic field of the LTE modelling is stronger than that of the 2T modelling,as presented in figure 8.Thus,in LTE modelling,the acceleration effect of the plasma flow driven by the Lorentz force is stronger than that of the 2T modelling,which leads to the overestimation of the velocity of the LTE modelling.
3.2.Validations of the 2T model:
3.2.1.The measured electron temperature of different axial positions,arc currents and gas flow ratesThe excitation temperature,which is very close to the electron temperature,is determined form the OES measurements combined with the hybrid method.Different axial positions are scanned from 0 mm to 10 mm away from the RPT’s outlet,with an axial spatial resolution of 5 mm.The measured results and the modelling results are compared in figure 9.The measurement result is plotted as error bars,which contain the maximum,minimum and average values for multiple measurements.The minimum electron temperature considers the possible nonequilibrium phenomenon existing in the fringe of the plasma jet.First,good agreement is found between the OES measurement of the electron temperature and the electron temperature calculated from 2T modelling.However,even though the possible thermal non-equilibrium phenomenon is considered when the hybrid method is used to estimate the minimum electron temperature,some small discrepancies are still found in the fringe of the plasma jet.The reason for this phenomenon may be that the measurement result is only the result of a certain period of time but the plasma jet simulated by the steady-state 2T modelling has been sufficiently cooled,so the electronic temperature at the jet fringe measured by the experiment is slightly higher than that obtained by the numerical modelling.Second,the temperature calculated by LTE modelling has a similar shape with the heavy particle temperature calculated by 2T modelling.Nevertheless,the value calculated by the LTE modelling is higher than that by the 2T modelling,which is consistent with the inner distribution of the temperature and current density in the RPT.Third,the measurement result and modelling result both show that with the increase of the axial distance away from the torch outlet,the electron temperature decreases along the axial direction but it is still higher than 8000 K at the 10 mm away from the outlet,indicating that the RPT can provide sufficient energy for industrial applications.The modelling result also demonstrates that with the increase of axial distance,the thermal non-equilibrium parameter at the arc fringe decreases.
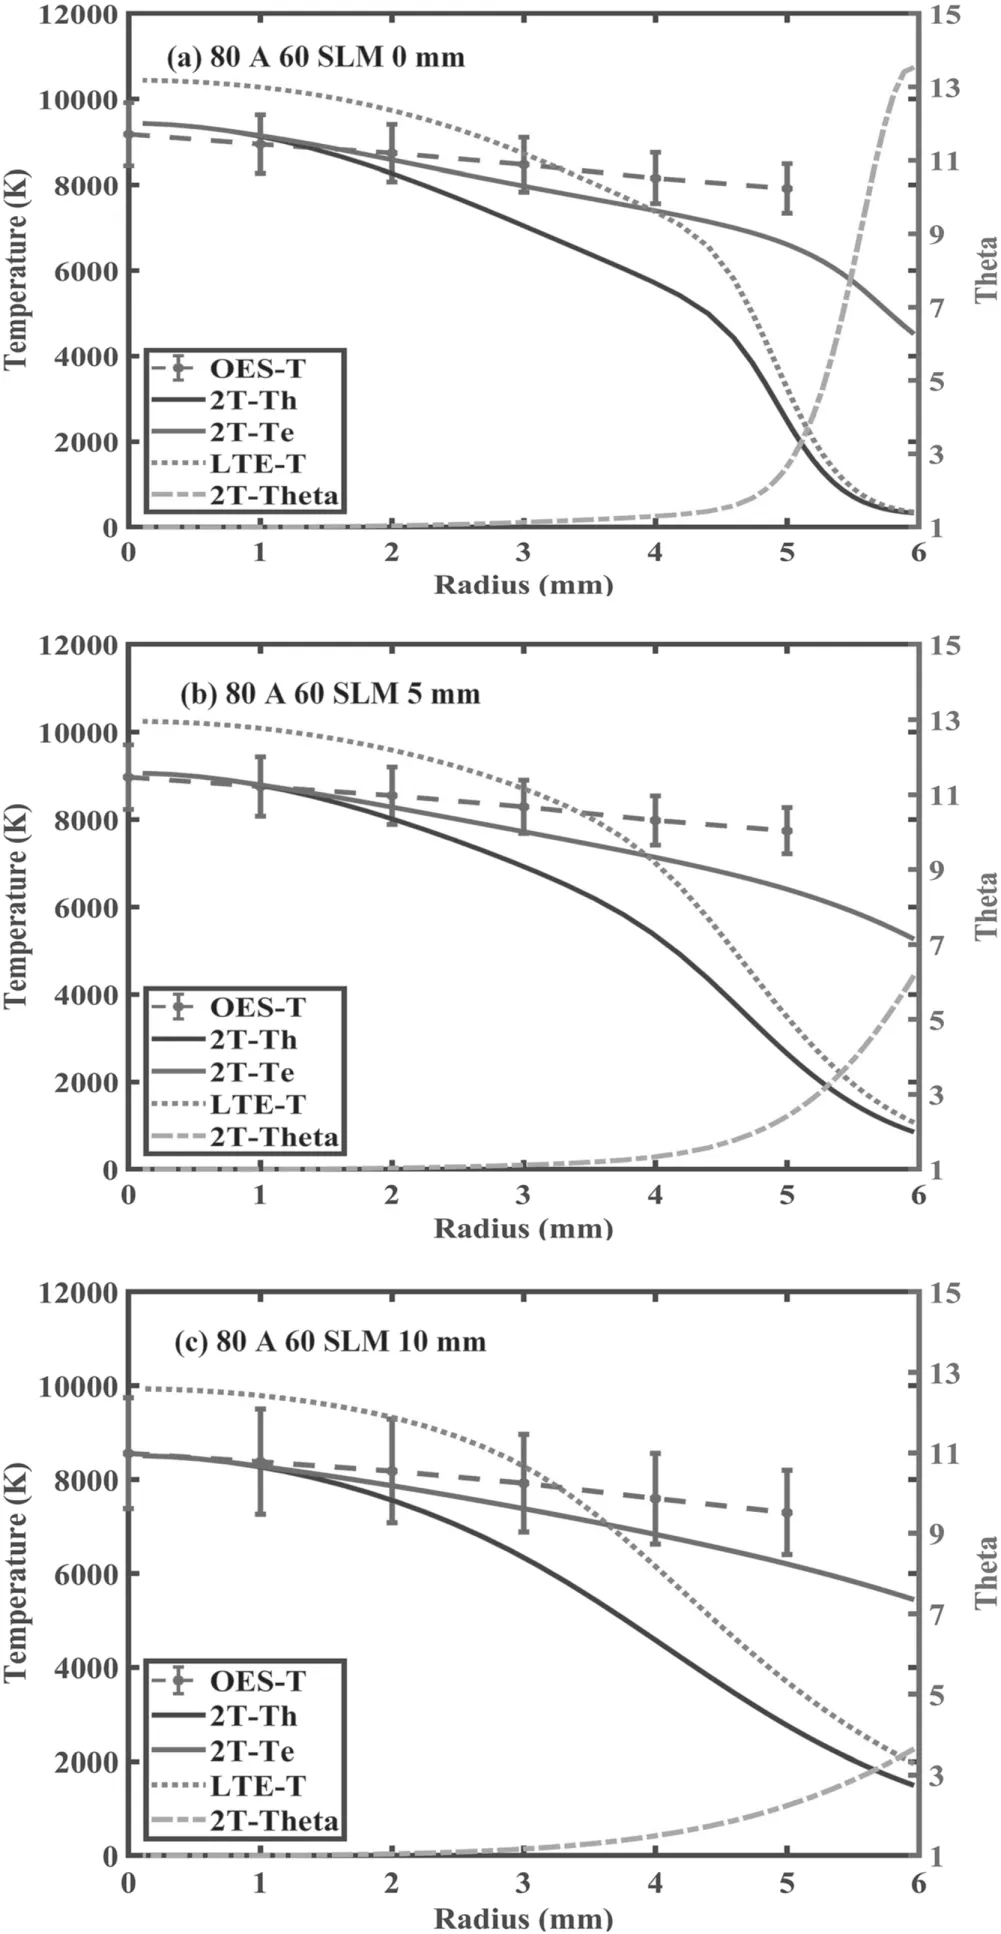
Figure 9.Comparison of the radial temperature profiles at different axial positions ((a) 0 mm,(b) 5 mm,(c) 10 mm) obtained using the OES method (OES-T) and 2T modelling (Th, Te and Theta) for the RPT at 80 A 60 SLM.
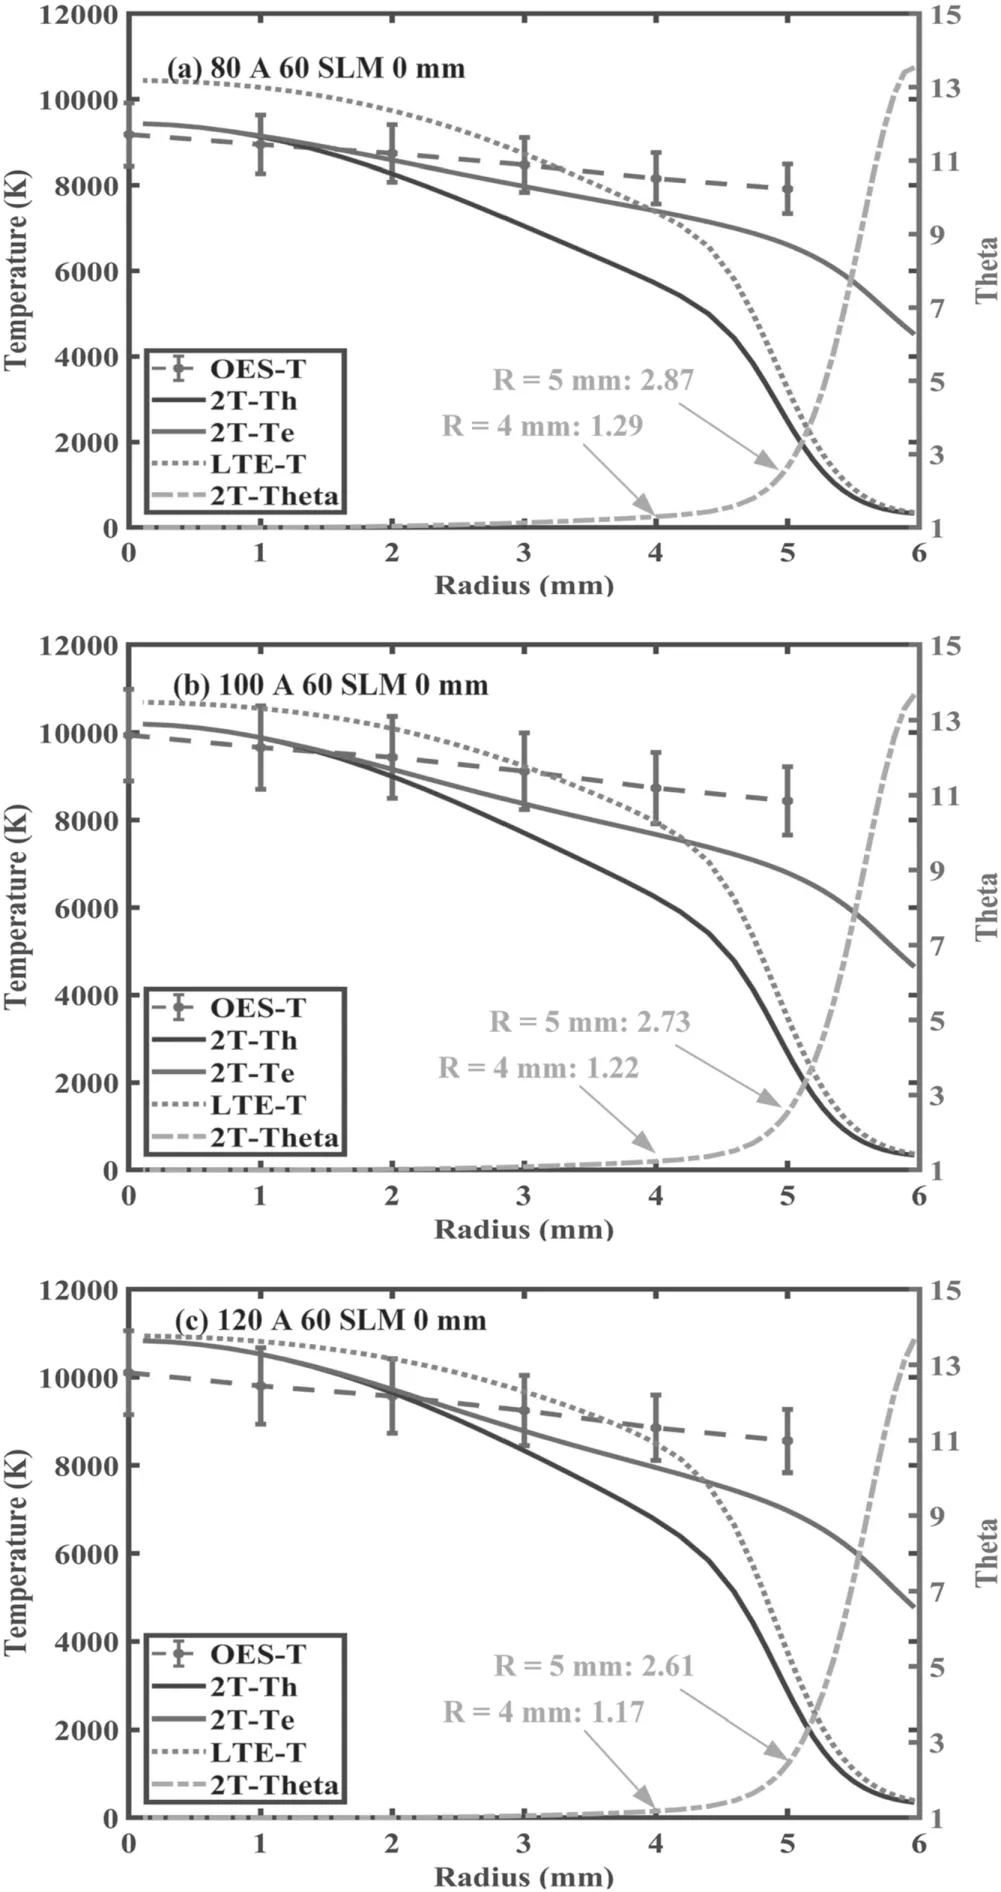
Figure 10.Comparison of the radial temperature profiles at different arc currents((a)80 A,(b)100 A,(c)120 A)obtained using the OES method(OES-T)and 2T modelling(Th,Te and Theta)for the RPT at the torch outlet with a fixed gas flow rate 60 SLM.
In figure 10,the comparison of the radial profiles at the different arc currents of the temperature obtained with the OES method and 2T modelling is plotted.It is evident from the figure that the measured temperature is close to the electron temperature obtained in the 2T modelling.With the increase in the arc current,the electron temperature and heavy particle temperature at the center of the plasma jet both increase greatly and even approach 11000 K at 120 A.Moreover,with the increase in the arc current,the calculated heavy particle temperature of the 2T modelling is getting closer to the temperature obtained by the LTE modelling,indicating the effectiveness of the LTE model under the high arc current condition.The thermal non-equilibrium parameter at two characteristic positions in the radial direction of the plasma jet (R=4 mm andR=5 mm) are extracted and displayed in figure 10 to show the influence of the arc current on the thermal non-equilibrium phenomenon at the fringe of the plasma jet.It is shown that when the arc current increases,the thermal non-equilibrium parameter at the fringe of the plasma jet decreases.
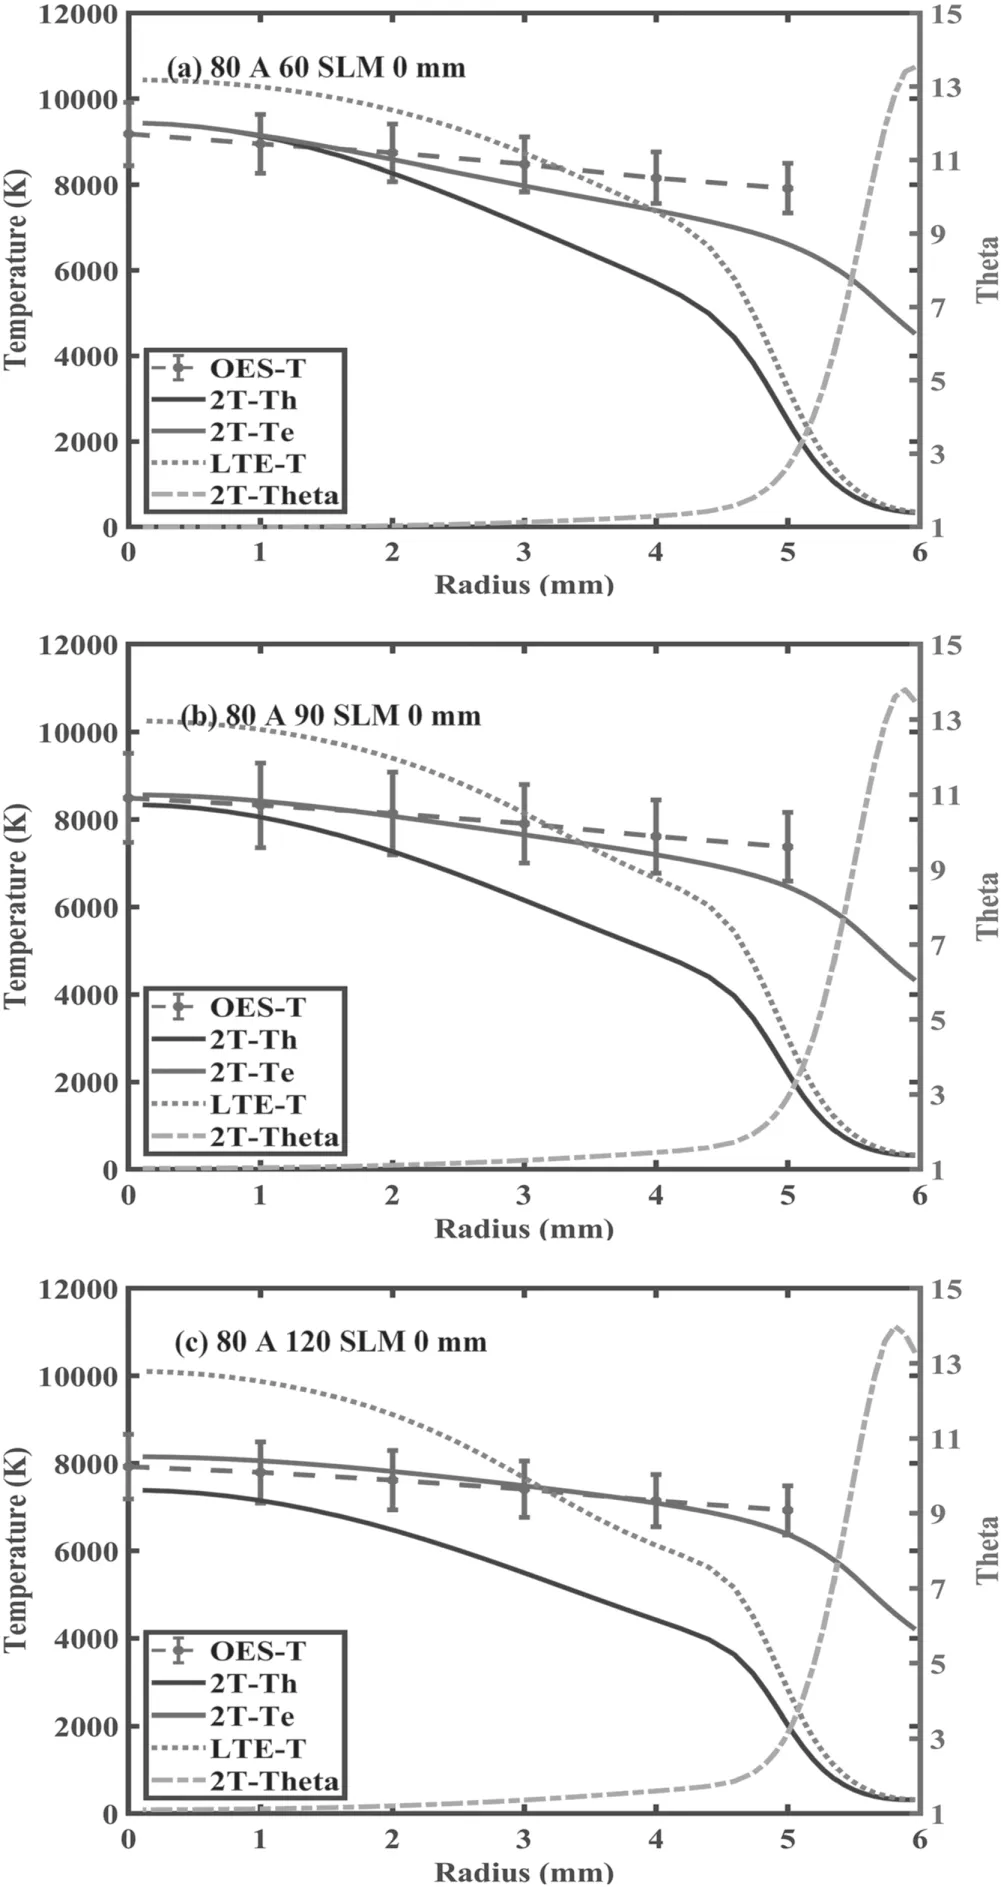
Figure 11.Comparison of the radial temperature profiles at different gas flow rates ((a) 60 SLM,(b) 90 SLM,(c) 120 SLM) obtained using the OES method(OES-T)and 2T modelling(Th,Te and Theta)for the RPT at the torch outlet with a fixed arc current 80 A.
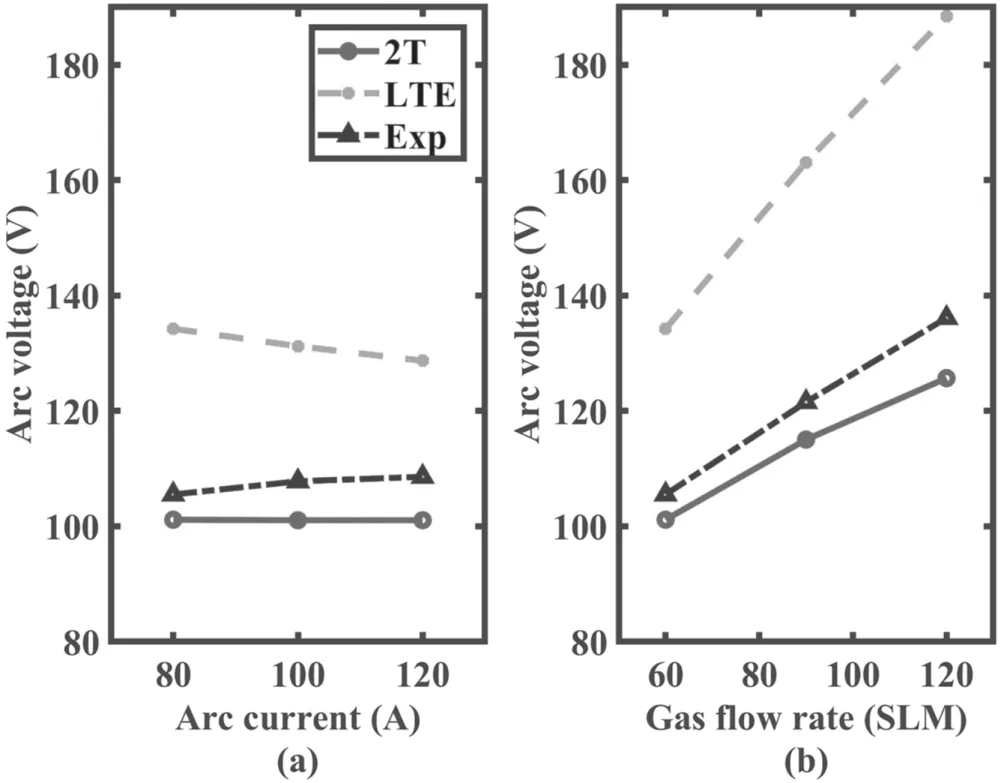
Figure 12.The comparison of arc voltage obtained by the LTE modelling,2T modelling and experimental measurements at (a)different arc currents and a fixed gas flow rate 60 SLM,and (b)different gas flow rates and a fixed arc current 80 A.
In figure 11,the comparison of the radial profiles at the different gas flow rates of the temperature obtained with the OES method and 2T modelling is plotted.The measured temperature can perfectly fit the electron temperature obtained in the 2T modelling.With the increase in the gas flow rate,the electron temperature and heavy particle temperature at the center of the plasma jet both decrease greatly.Furthermore,the increased gas flow rate amplifies the difference between the LTE modelling and experimental measurement.Under the condition of the 80 A 120 SLM,the difference between the LTE modelling and experimental measurement can be 25%.Therefore,the result obtained by the LTE modelling under high gas flow rate and low arc current is questionable.Moreover,when the gas flow rate increases,the thermal nonequilibrium parameter at the fringe of the plasma jet increases according to the modelling results.
All the above-mentioned results show that good agreements of the electron temperature are obtained between the 2T modelling and experimental measurement in the whole investigated spatial region and working parameters,indicating the validity of the 2T modelling.
3.2.2.The measured arc voltage at different arc current and gas flow rate.In figure 12,the comparison of arc voltage obtained by the LTE modelling,2T modelling and experimental measurements at different arc current and gas flow rate is plotted.The arc voltage is a time-averaged value during the measurement.First,the value of the 2T modelling is slightly smaller but closer to the measurement one,while the value of the LTE modelling is grossly overestimated.Furthermore,the trend of voltage variation of the 2T modelling with the arc current and gas flow rate is similar with the experimental results.This proves that the thermal non-equilibrium phenomena does actually exist in the RPT.As for the influence of the arc current,with the increase in the arc current,the experimental value of the arc voltage increases.According to the Ohm’s law /σ=E j,the change rate of the current densityjand the electrical conductivity σ determines whether the electric field intensityErises or falls.In the RPT,with the increase in the arc current,the increasing rate of the current density is higher than the increasing rate of the electrical conductivity,leading to an increase in the experimental arc voltage.Moreover,with the increase of the arc current in the experiment,the measured arc voltage increases and gets close to the LTE value,indicating that the plasma inside the RPT will approach the LTE state with the increase in the arc current.As for the gas flow rate,the increase of the gas flow rate relates to the decrease in the average arc temperature and thus the decrease in the electrical conductivity of the arc column,which then leads to the increase in electrical field intensity and thus the increase in experimental arc voltage.As for the influence of the gas flow rate,although the arc voltage calculated by the LTE modelling rises with the increase in the gas flow rate,the difference between the LTE value and experimental one is also increasing,indicating that the plasma inside the RPT deviates from the LTE state more and more seriously.
3.3.Effect of the working parameters on the plasma flow characteristics
3.3.1.The electron temperature and thermal non-equilibrium parameter distributions under different arc currents and gas flow rates.Figure 13 shows the electron temperature and non-equilibrium parameter distributions at different arc currents.First,with the increase in the arc current,the whole electron temperature distribution and the maximum electron temperature increase,as shown in figures 13(a)–(c).It is apparent that the increase in the current density relates to the increase of the Joule heat effect and then the increase in the whole electron temperature distribution and the maximum electron temperature.Figure 14 illustrates the electron temperature and non-equilibrium parameter distributions at different gas flow rates.Second,the peak electron temperature slightly increases with the increase in the gas flow rate,while the whole electron temperature distribution of the arc column decreases,as shown in figures 14(a)–(c).The increased gas flow rate enhances the constriction of the arc column at the inlet area of the cold plasma-forming gas.Therefore,the local current density is higher and thus the local peak electron temperature is higher.However,the increased cold plasmaforming gas requires more energy for the heating and ionization.When the input arc current remains unchanged,the overall electron temperature decreases.
From figures 13 and 14,it can be seen that the thermal non-equilibrium phenomena mainly exist in the vicinity of the water-cooling electrode,the fringe of the generated plasma jet and especially the inlet area of the cold plasma-forming gas.This is because all these areas have a cold medium that cools the heavy particle temperature.In the vicinity of the watercooling electrode,the cooling water at another side of the electrode cools the heavy particle temperature.At the fringe of the plasma jet and the inlet region of the plasma-forming gas,the cold medium is the cold air in the ambient environment and the injected cold plasma-forming gas,respectively.For a better illustration of the influence of the arc current and gas flow rate on the thermal non-equilibrium parameter,the non-equilibrium parameter values along the center axis inside and outside the RPT at different currents and gas flow rates are extracted for the comparison in figure 15.It can be seen that the distribution of the thermal non-equilibrium parameter at the center of the arc column deviates slightly from the LTE state at the axial position between 0.1 m and 0.2 m in any working parameters.However,the thermal non-equilibrium parameter along the center of the plasma jet is identical to 1 in the region within 20 mm away from the torch outlet,indicating that the plasma jet core in this region is in the LTE state.In the outer area,the thermal non-equilibrium increases with the axial position due to the fast cooling of the heavy particle temperature driven by the entrancement of the cold gas in the ambient area.Finally,at outside places further away from the exit,the electron temperature also decreases and the plasma jet recovers to the LTE state.However,with the increase in the arc current,the thermal non-equilibrium parameter distribution along the center axis starts to approach a value of 1,which indicates that the center of the arc column is getting closer to the LTE state.The reason may be as follows: the increase in the arc current leads to more frequent and adequate collisions between the electron and the heavy particle,and so the temperatures of the two kinds of particles become the same.Then,with the increase of the gas flow rate,the thermal non-equilibrium phenomena in the arc core at the axial position between 0.1 m and 0.2 m and the plasma jet are intensified.This is because too much cold plasma-forming gas enhances the unbalance of the Joule heating effect on the electron temperature and collisional term of energy transfer from electrons to heavy particles,so the heavy particle temperature decreases and the thermal nonequilibrium phenomenon is amplified.
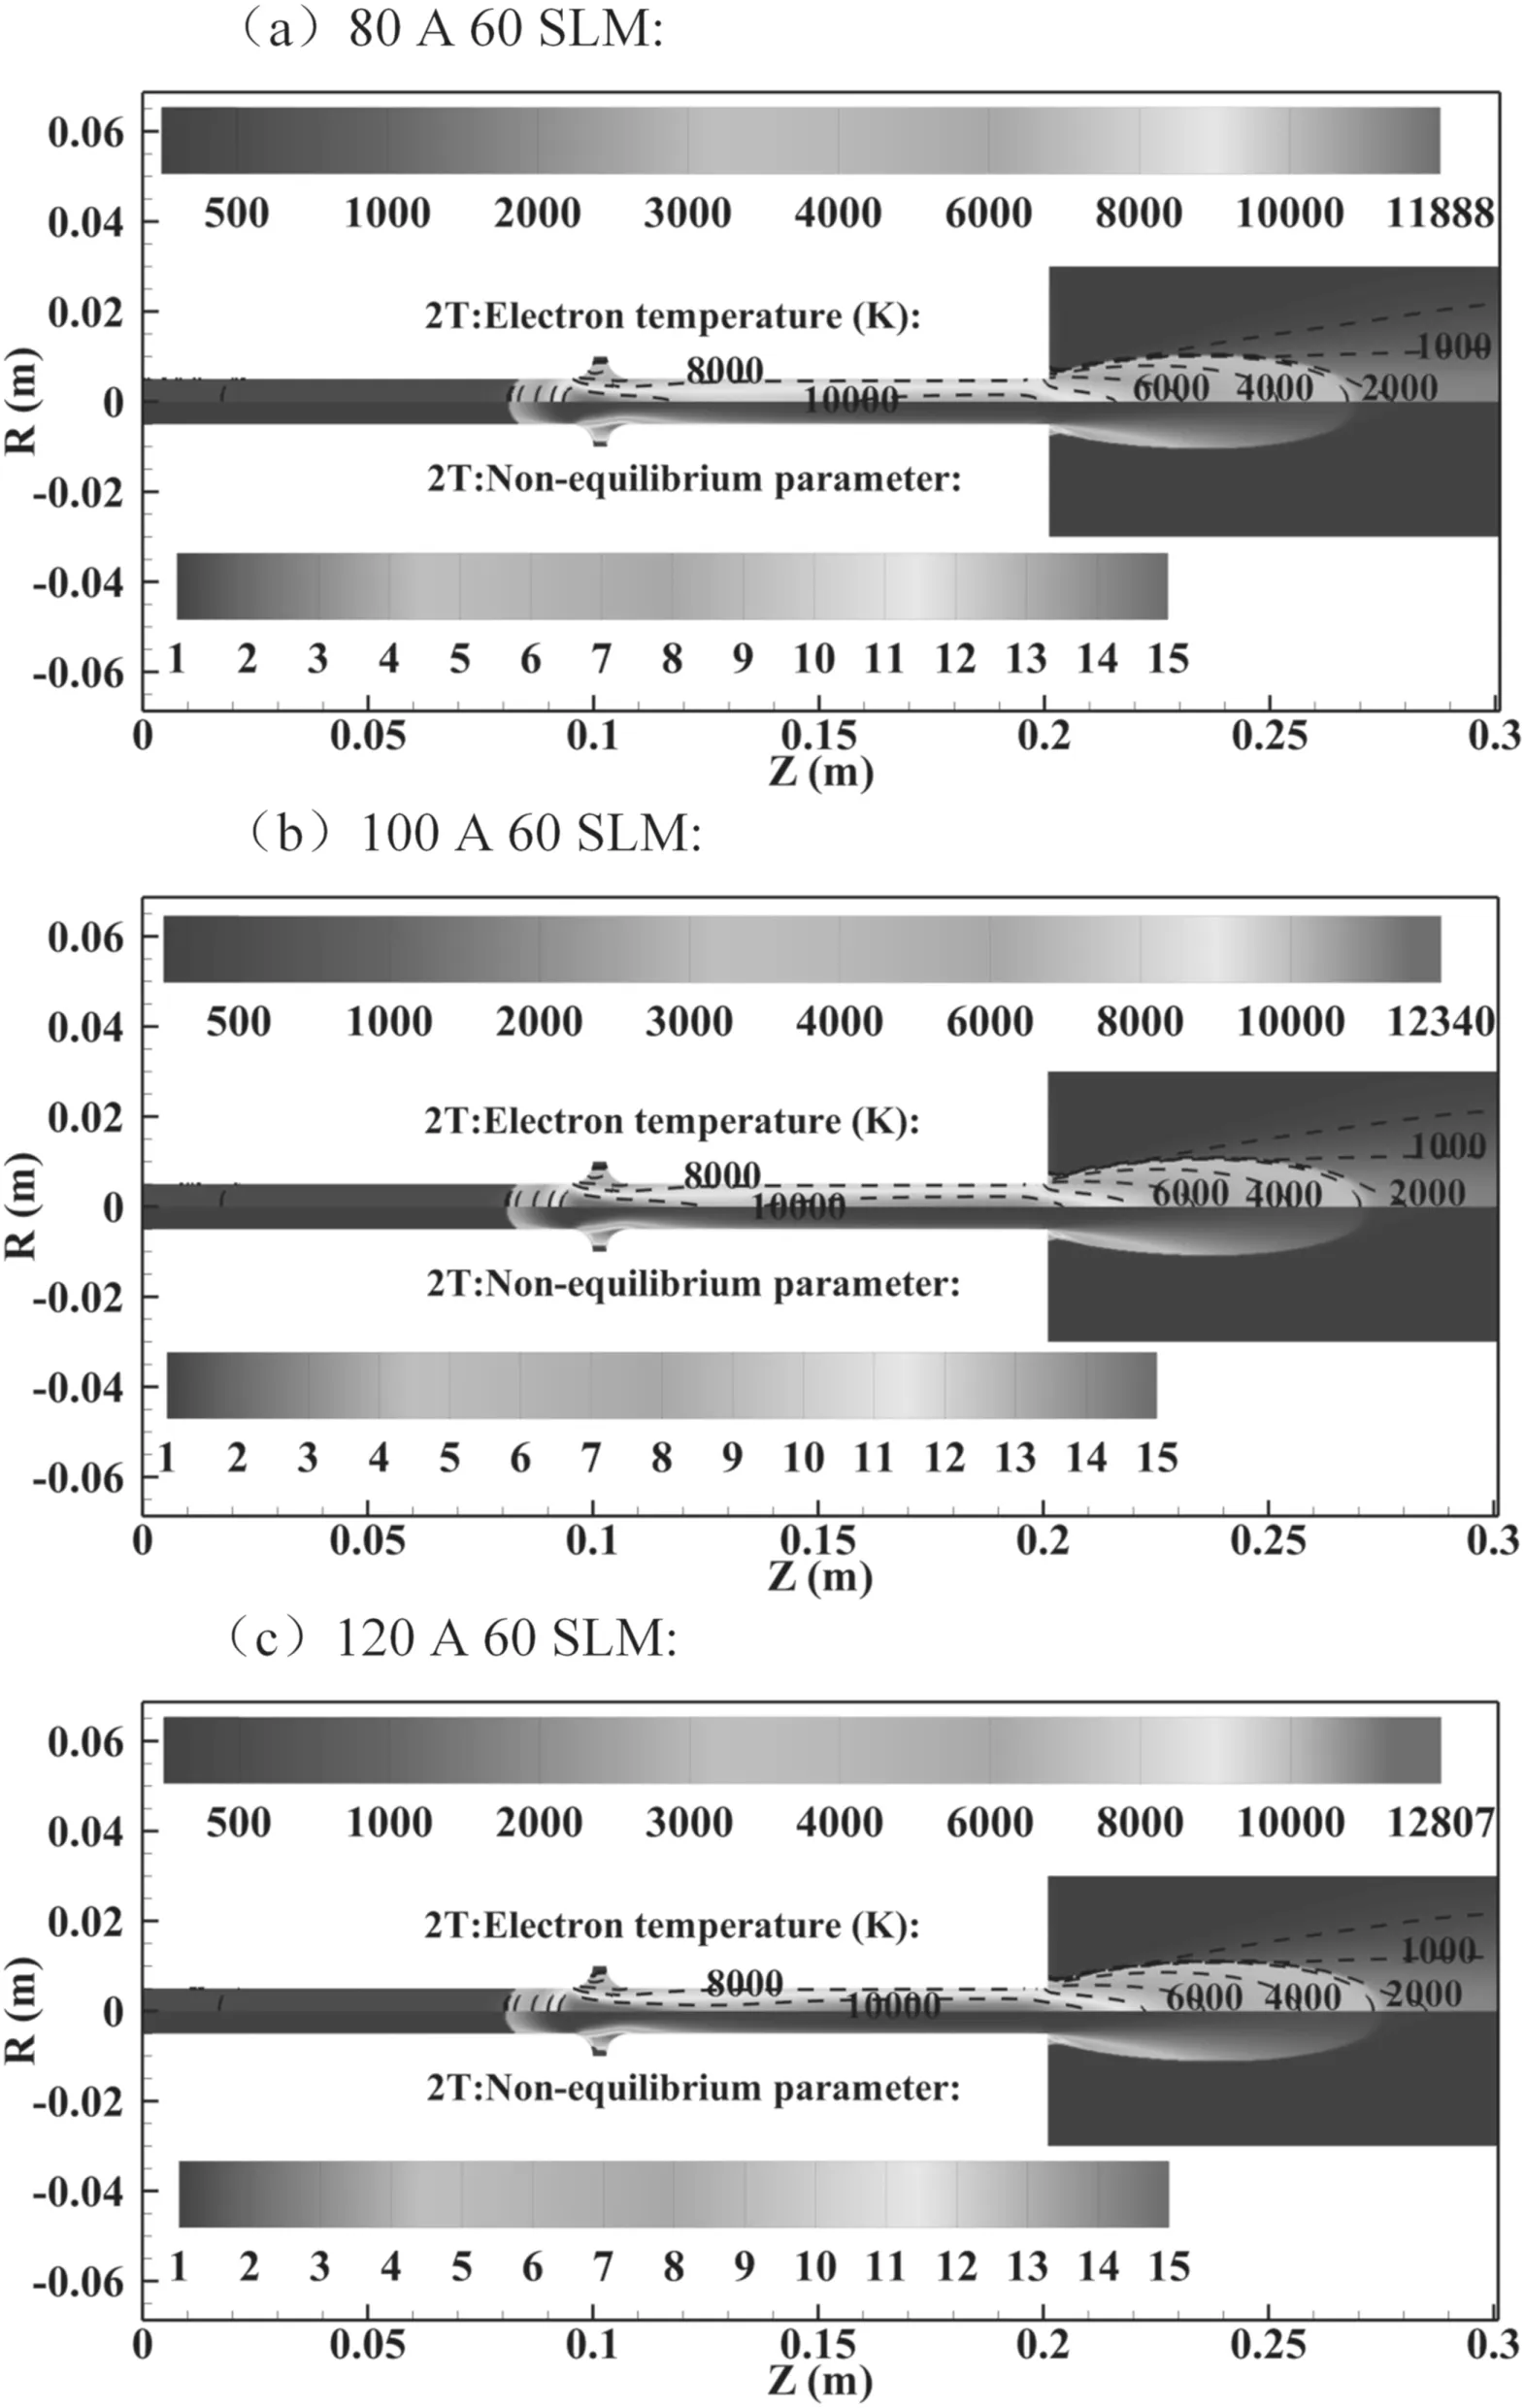
Figure 13.The electron temperature and the non-equilibrium parameter distribution inside and outside the RPT at different arc currents:(a) 80 A,(b) 100 A,(c) 120 A.
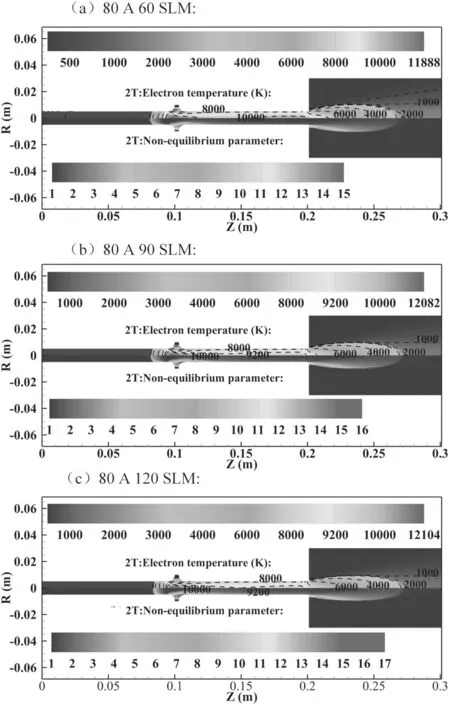
Figure 14.The electron temperature and the non-equilibrium parameter distribution inside and outside the RPT at different gas flow rates:(a) 60 SLM,(b) 90 SLM,(c) 120 SLM.
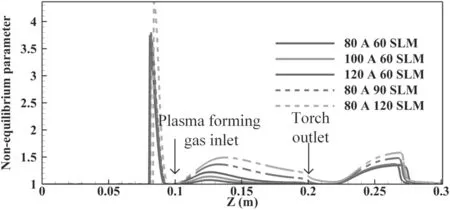
Figure 15.The non-equilibrium parameter distribution along the center axis inside and outside the RPT at different currents and gas flow rates.

Figure 16.The axial velocity distribution along the center axis inside and outside the RPT at different gas flow rates and currents.
3.3.2.The velocity distribution under different arc currents and gas flow rates.The distribution shape of the velocity is nearly the same as in figure 7(a) for each group of working parameters.Thus,for a better illustration of the influence of the arc current and gas flow rate on the velocity,only the velocity values along the center axis inside and outside the RPT at different currents and gas flow rates are extracted for the comparison in figure 16.The modelling results show that the velocity of the plasma jet is more than 200 m s−1within 50 mm from the torch outlet,and the axial velocity increases with the increase in the arc current.This can be explained as follows: when the gas flow rate remains constant,increasing the current helps to raise the acceleration of the plasma flow driven by Lorentz force,which leads to a higher outlet velocity.Then,there is no doubt that the increase in the gas flow rate would increase the velocity of the plasma flow.It is worth noting that the peak velocity of the plasma flow can reach 680 m s−1when the gas flow rate is set as 120 SLM.The velocity of the plasma jet is quite fast,and it is expected that more kinetic energy can be provided by the generated plasma jet for enhanced mixing or breaking of raw materials in the application of the material synthesis and plasma atomization.
4.Conclusions
In this paper,a two-temperature(2T)thermal non-equilibrium model has been developed to address the thermal non-equilibrium phenomenon that inevitably exists in the RPT and is applied to numerically investigate the plasma flow characteristics inside and outside the RPT.The following conclusions can be drawn from this study:
(1) The developed 2T thermal non-equilibrium model is accurate in the numerical prediction of the flow characteristics of the RPT.The differences between the predicted electron temperature and arc voltage with those obtained by experimental measurement are less than 13% and 8% respectively,validating the effectiveness of the 2T model.In addition,the LTE model overestimates the velocity and temperature distribution of the RPT and its plasma jet,showing that thermal non-equilibrium phenomena cannot be neglected in the numerical modelling of the RPT.
(2) The thermal non-equilibrium phenomenon mainly exist at the regions where the cold medium strongly interacts with the plasma,such as the vicinity of the watercooling electrodes,the inlet region of the plasmaforming gas,and the fringe of the plasma jet.Furthermore,unlike other common hot cathode plasma torches,the thermal non-equilibrium phenomenon even exists in the center of the arc column,due to the strong cooling effect of the heavy particle temperature caused by the extremely high gas flow rate of the cold plasmaforming gas.
(1) With the increase in the gas flow rate,the plasma generated by the RPT deviates further away from the thermal equilibrium state.However,with the increase in the arc current,the plasma inside the torch gets closer to the thermal equilibrium state,and thus the prediction of the LTE model can also be acceptable.
Acknowledgments
The authors appreciate the financial support from National Natural Science Foundation of China(No.51875372)and the Key R&D Program of Advanced Technology of Sichuan Science and Technology Department (No.2020YFG0111).The authors are grateful to Li Heping and Fang Chuan from Tsinghua University for providing the thermodynamic and transport properties of the argon plasma and their kind help with computer programming of the 2T modelling.The authors are also grateful to Wang Haixing and Sun Jianghong from Beijing University of Aeronautics and Astronautics for their selfless help with computer programming of the 2T modelling.
杂志排行

Plasma Science and Technology的其它文章
- Recent results of fusion triple product on EAST tokamak
- Suppression and mitigation of inter-ELM high-frequency Alfvén-like mode by resonant magnetic perturbation in EAST
- Simulations of NBI fast ion loss in the presence of toroidal field ripple on EAST
- Reconstructions of velocity distributions from fast-ion D-alpha (FIDA) measurements on EAST
- Tomography of emissivity for Doppler coherence imaging spectroscopy diagnostic in HL-2A
- Comparison of natural grassy ELM behavior in favorable/unfavorable Bt in EAST