HPLC and GC methods development for the analysis of key intermediate for synthesis of dicamba
2021-08-26ZhenmingZhangHeZhaoXiaohuiWangWeimingNiFengshengGaoJianrongWangMinjinLiuYongliLi
Zhenming Zhang,He Zhao,Xiaohui Wang,Weiming Ni,Fengsheng Gao,Jianrong Wang,Minjin Liu,Yongli Li,*
1 Key Laboratory of Power Station Energy Transfer Conversion and System,Ministry of Education,North China Electric Power University,Beijing 102206,China
2 Jiangsu Changqing Agrochemical Co.,Ltd.,Yangzhou 225200,China
3 Jiangsu Changqing Agrochemical Nantong Co.,Ltd.,Nantong 226000,China
Keywords:2,5-dichlorophenol 2,4-dichlorophenol Chromatography Separation Chemical analysis
ABSTRACT The microreactor based hydroxylation process of 1,2,4-trichlorobezene for producing 2,5-dichlorphenol,the key intermediate of dicamba,is energy efficient and cost effective.But the 2,5-dicholorphneol is present in a mixed state after production.The reaction mixture contained the main by-product 2,4-dichlorophneol,low-content by-product 3,4-dichlorophneol,and other impurities.The difficulty in separation and analysis limits the application of this process widely.The current work aimed at establishing effective analysis methods by gas chromatography (GC) and high performance liquid chromatography(HPLC).The GC method was not able to separate 2,5-dichlorophenol and 2,4-dichlorophenol completely,but the developed HPLC method worked efficiently.The linear correlation coefficients of 2,5-dichlorophenol and 2,4-dichlorophenol were both higher than 0.999,and the average recovery was 100.33% for 2,5-dichlorophenol and 100.13% for 2,4-dichlorophenol,respectively.The relative standard deviations from precision tests were both less than 1%.The contents of 2,5-dichlorophenol and 2,4-dichlorophenol were determined with external standard method.The HPLC method has the advantages of simple operation,good separation efficiency,high accuracy and precision,and was successfully applied for both qualitative and quantitative analysis of 2,5-dichlorophenol and 2,4-dichlorophenol of the sample solution.
1.Introduction
Chemical industry is generally energy intensive and the energy or power consumption per unit of production is high [1].It is essential to develop energy efficient processes [2,3] for consideration on energy conservation,environment protection,economic profits,etc.The development of new chemical processes attracts much attention of researchers and engineers [4–6].Microreactor based processes have the advantages of process intensification[7,8] and process integration [9],by which heat or mass transfer can be enhanced and the utilization of energy can be optimized[10].Dicamba is a selective herbicide,worldwide often used for genetically modified crops such as soybean and corn [11,12].Our output of dicamba is approximately one sixth of the global production that is about 54 thousand tons annually [13].It was highly motivated to advance the synthesis technology by process innovation.In a previous work [14],the synthesis process of 2,5-dichlorophenol (2,5-DCP),the key intermediate for synthesis of dicamba,was developed with microreactors.There exist several processes for producing 2,5-DCP[15,16].The process via hydroxylation of 1,2,4-trichrolrobezne [17] is cost effective,because the raw material 1,2,4-trichrolrobezne is the by-product of synthesis process of chlorination of benzene for forming dichlorobenzene,which is produced more than 1 million tons annually worldwide.Actually,the hydroxylation process contributes to the reuse of waste that should normally be treated by incineration.Thus,the synthesis by hydroxylation process is preferred for consideration on both economic and environmental aspects.But the hydroxylation process can produce 2,4-dichlorophenol (2,4-DCP) and 3,4-dichlorophenol (3,4-DCP) as by-products.The separation after the synthesis becomes critical.3,4-DCP has a boiling point of 253 °C,which is more than 40 °C higher than the boiling points of 2,4-DCP and 2,5-DCP.Therefore,3,4-DCP can be easily separated by normal distillation process from the other isomers.In addition,the content of 3,4-DCP in the reaction mixtures after the synthesis is usually less than 1%.The current work mainly focused on the analysis of 2,5-DCP and 2,4-DCP.The structures of the isomers are shown in Fig.1.It was necessary to develop effective and reliable separation methods for both production and analysis purposes,because the purity has to be ensured for the guarantee of the quality of the final products.2,5-DCP is also the main raw material for synthesizing for Lufenuron [18],and can be taken as leather mildew preventive [19] and nitrogen fertilizer synergist[20].2,4-DCP is the main raw material for synthesizing Nitrophen[21,22],Bithionol,2,4-D-butyl ester [23,24],Triclosan [25],Diclofop [26],Oxadiazon [27,28],Fenoxanil [29],etc.However,there are no analytical methods reported in literature for the analysis of 2,5-DCP and 2,4-DCP mixtures.2,5-DCP and 2,4-DCP have the same molecular weight and similar polarity.The boiling point is 211 °C for 2,5-DCP and 210 °C for 2,4-DCP,only 1 °C in difference,which makes the separation difficult.The challenge limits the wide application of the process.In this work,both gas chromatography(GC) and high performance liquid chromatography (HPLC) methods were established and applied in sample analysis.
2.GC Method Development
2.1.Materials and methods
Reagents and chemicals.Methanol,HPLC grade,was supplied by Yonghua Chemical.2,5-dichlorophenol(99.9%),2,4-dichlorophenol(99.9%),and 3,4-dichlorophenol (99.9%) were provided by Jiangsu Changqing Agrochemical.
Equipment.Gas Chromatograph system,Agilent 7820A,was equipped with hydrogen flame ionization detector.Mass spectrometer (MS),Agilent 5975C MSD,was used for compound identification.The column,DB-WAX 30 m × 320 mm × 0.25 μm,was employed.Samples were injected through micro syringes with nominal volume of 10 μl.
Chromatographic conditions.Column temperature,vaporization temperature,and detector temperature were regulated at 140 °C,250 °C and 270 °C,respectively.Temperature program was set for improving the separation efficiency.The temperature of the column oven was initially controlled at 140 °C and held for 2 min.Then it was increased to 220 °C at a rate of 35 °C∙min-1.After being held for 7 min,it was increased again to 240°C at a rate of 60°C∙min-1.Finally,it was held for 15 min at 240°C.Split ratio was taken as 60:1.The flowrate of the makeup gas,hydrogen and air were 25 ml∙min-1,30 ml∙min-1and 400 ml∙min-1,respectively.The column was run at a flow rate of 1.0 ml∙min-1.The injection volume was 0.2 μl.
Preparation of standard and sample solutions.At the end of the hydroxylation reaction of 1,2,4-trichlorobezene [17],the reaction mixture was taken out,and then filtered.The filtrate was then diluted with methanol,the solvent used in the hydroxylation process.After ultrasonic treatment,the sample solutions were ready for analysis.The standards were prepared by dissolving pure substances in methanol with desired compositions.

Fig.1.Chemical structures of (a) 2,5-DCP,(b) 2,4-DCP and (c) 3,4-DCP.
2.2.Results and Discussion
GC-MS analysis was carried out with standards for identifying 2,5-DCP,2,4-DCP and 3,4-DCP.MS spectrums obtained for 2,5-DCP,2,4-DCP and 3,4-DCP in the current work are shown in Figs.2–4.They matched well the standard mass spectrums from database [30–32].It is noted that they were all characterized by the molecular ion peak at m/z 161.9 and two major fragmented peaks at lower m/z area.
The sample solutions were analyzed with the developed GC method and results are shown in Fig.5.The three isomers were identified by correlating retention time.The peak of 3,4-DCP was located far away from those of 2,5-DCP and 2,4-DCP.However,the separation of 2,5-DCP and 2,4-DCP was not ideal,mainly due to the small difference on their boiling points.The chromatogram with the retention time between 7 and 8 min was zoomed in and attached to the original figure for showing clearly the local superimposition.The estimation on overlapped areas could introduce error when the area normalization method was employed for determining the relative composition of 2,5-DCP and 2,4-DCP.The quantitative analysis with the developed GC method was not recommended,but the operation with GC process was convenient and fast,and was able to analyze 3,4-DCP successfully.In really,the developed GC method has been often used for qualitative analysis of the samples.
3.HPLC Method Development
3.1.Materials and methods
Reagents and chemicals.Acetonitrile,HPLC grade,was purchased from J&K Scientific.Methylene chloride,HPLC grade,was supplied by Yonghua Chemical.2,5-dichlorophenol (99.9%) and 2,4-dichlorophenol (99.9%) were provided by Jiangsu Changqing Agrochemical.
Equipment.Agilent LC1260ⅡHPLC system coupled with diode array detector,was used for wavelength scanning of pure substances.Agilent 1200 HPLC system equipped with UV detector was employed for analysis and the column,KR100-5NH2,250 mm × 4.6 mm was chosen for separation.
Chromatographic conditions.The flow rate was optimized at 1.8 ml∙min-1.Sample size was 5 μl.Stop time was 25 min.Column temperature was set as 25 °C.
Preparation of standard solutions.0.4 g 2,5-DCP or 0.1 g 2,4-DCP was weighted with an analytical balance,accurate to 0.0002 g,and then dissolved with the same solvent as mobile phase in a volumetric flask of 100 ml,respectively.The solutions were subjected to ultrasonication for 20 min to ensure the complete dissolution.They were cooled down to room temperature and the stock solutions were ready for use.The standard solutions with desired concentrations were afterwards prepared by diluting the stock solutions.
Preparation of sample solutions.The reaction mixture was collected after the hydroxylation reaction and then filtrated.0.5 g of the filtrate was weighted and diluted with the same solvent as the mobile phase in a volumetric flask of 100 ml.All the sample solutions were treated by ultrasonic process.
3.2.Results and Discussion
3.2.1.Development of the method

Fig.2.Mass spectrum of 2,5-DCP.

Fig.3.Mass spectrum of 2,4-DCP.

Fig.4.Mass spectrum of 3,4-DCP.

Fig.5.GC chromatograms of the sample solution.

Fig.6.HPLC-DAD chromatogram of standard 2,5-DCP solution.

Fig.7.HPLC-DAD chromatogram of standard 2,4-DCP solution.
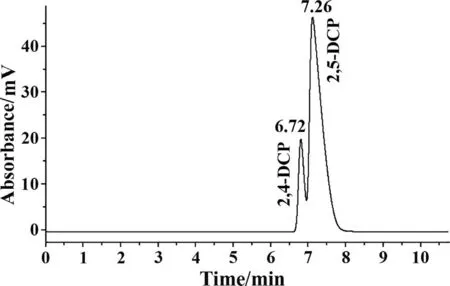
Fig.8.HPLC chromatogram of standard solutions of the mixture containing 1 g∙L-1 2,5-DCP and 0.2 g∙L-1 2,4-DCP for ADR=6:1.

Fig.9.HPLC chromatogram of standard solutions of the mixture containing 1 g∙L-1 2,5-DCP and 0.2 g∙L-1 2,4-DCP for ADR=4:1.
Wavelength determination.In order to find the optimized wavelength for UV absorption,the tests with standard solutions of pure substances were carried out.The scanning step covered the wavelength of 200–420 nm.There were two major absorption peaks,as shown in Figs.6 and 7.The larger one was located at the wavelength of about 225 nm and the other was at the wavelength of about 285 nm.There was no obvious difference observed between the absorption curves of 2,5-DCP and 2,4-DCP.The wavelength of 225 nm was selected for its stronger absorption.

Fig.10.HPLC chromatogram of standard solutions of the mixture containing 1 g∙L-1 2,5-DCP and 0.2 g∙L-1 2,4-DCP for ADR=3:1.

Fig.11.HPLC chromatogram of standard solutions of the mixture containing 1 g∙L-1 2,5-DCP and 0.2 g∙L-1 2,4-DCP for ADR=1:1.
Optimization of the mobile phase.Preliminary tests with the NH2 column in normal phase mode showed the potential of good separation,which was possibly due to the hydrogen bond based interaction between the hydroxyl groups of the substances and the nitrogen atoms of the fixed phase.The standard solutions of 2,5-DCP and 2,4-DCP were prepared as about 1 g∙L-1and 0.2 g∙L-1by diluting the stock standard solutions,respectively.In the current work,the mobile phase was composed of acetonitrile and dichloromethane.The acetonitrile to dichloromethane ratio(ADR) played important role for separation efficiency.In the experiments,the content of dichloromethane in the mobile phase was increased in four steps.Correspondingly,ADR was set to 6:1,4:1,3:1 and 1:1,while keeping the total flow rate fixed at 1.8 ml∙min-1.The chromatographs with different ADR are presented in Figs.8–11.When ADR=6:1,the retention time of 2,5-DCP (RT2,5-DCP) was 7.26 min and the retention time of 2,4-DCP (RT2,4-DCP) was 6.72 min.Fig.8 shows the retention time(RT)of the two substances was too close and the peak areas were partially overlapped,indicating the separation was not efficient.When ADR=4:1,the two peaks were completely separated,shown in Fig.9.The retention time difference(RTD)between them was about 4 min.Tests with sample solutions showed there could exist small peak of impurities located very close to the characteristic peak of 2,5-DCP.When ADR=3:1,RT2,5-DCPwas 20.97 min and RT2,4-DCPwas 13.7 min,shown in Fig.10.RTD was about 7 min.The peak of impurity was well separated from those of 2,5-DPC and 2,4-DCP.The analysis with sample solutions was completely exempt from the disturbance caused by impurities.When ADR=1:1,RTD was about 13 min,they were well separated,as shown in Fig.11,but RT2,5-DCPand RT2,4-DCPwere 38.54 min and 24.99 min,which were relatively long for the analysis process.Based on the results,ADR of 3:1 was chosen as the optimized condition.In addition,the absorption peaks were narrow,high and symmetric.In the experiments,dichloromethane and acetonitrile were premixed with ADR equal to 3:1,then filtered with a micro filtration membrane.After degassing,it was ready for use as mobile phase.
3.2.2.Validation of the HPLC method
Linearity.Standard solutions of 2,5-DCP were prepared for the concentrations of about 0.4,0.8,1.2,1.6 and 2.0 g∙L-1,and those of 2,4-DCP were prepared for the concentrations of about 0.1,0.2,0.3,0.4 and 0.5 g∙L-1.The standards were analyzed with HPLC.The relationship between the peak area and the concentration was linear for both substances in the studied range.Table 1 presents the expressions of the determined linear functions and the correspondent coefficients of determination (R2) that were employed to evaluate the linearity of the regression line.R2was found approximately 0.999 in both cases,indicating the good linearity of the calibration curves.

Table 1Linearity,accuracy and precision results of the HPLC method
Accuracy.Accuracy was determined using three standard solutions containing about 0.8,1.0 or 1.2 g∙L-12,5-DCP,or about 0.1,0.2 or 0.3 g∙L-12,4-DCP.Recovery was used for evaluating the accuracy.Table 1 shows that the average percent recovery was 100.33% ± 0.84% for 2,5-DCP and 100.13% ± 0.81% for 2,4-DCP.The method was highly accurate.
Precision.The precision was represented by the repeatability and the tests were carried out by evaluating the concentrations of six replicate standard solutions containing about 1.0 g∙L-12,5-DCP or 0.2 g∙L-12,4-DCP.Table 1 shows that the relative standard deviation (RSD) of the six measurements was 0.16% for 2,5-DCP and 0.20% for 2,4-DCP.The developed method met the criteria for precision.
Application on analysis of sample solutions.The method was then applied for the sample solution prepared with the reaction mixture after the hydroxylation process of 1,2,4-trichlorobezene [17],mainly containing the target product 2,5-DCP,the by-products 2,4-DCP and 3,4-DCP,and other impurities.The distillation process was first applied and 3,4-DCP was separated out.The distillate was then analyzed with the above developed HPLC method.RT2,5-DCPand RT2,4-DCPmarked on Fig.12 were consistent with those from Fig.10,which showed the method had good retention time stability.There also existed unassigned peaks,especially at low retention time region,corresponding to impurities.The concentrations of 2,5-DCP and 2,4-DCP in the sample solution were calculated using the linear equations presented in Table 1 and the original mass fractions in the reaction mixture could be then determined,results were summarized in Table 2.The concentration of 2,5-DCP and 2,4-DCP in the sample solution were 999.1 μg∙ml-1and 190.7 μg∙ml-1,which were within the working range of the developed method.The mass fraction of 2,5-DCP and 2,4-DCP in the reaction mixture were 20.0% and 3.81%.Combined with the initial concentration of the reactants and the quantity of 3,4-DCP determined by distillation step,the conversion,selectivity and yield of the synthesis could be further determined.The example confirmed the successful application of the current method in analysis of the hydroxylation reaction.

Table 2Results of analysis of the sample solution

Fig.12.HPLC chromatogram of the sample solution.
4.Conclusions
In the work,an efficient HPLC method was developed for analysis of 2,5-DCP and 2,4-DCP of the reaction mixture.The functions between the peak area and the concentration showed linearity with R2of 0.999.The method had good average recovery,100.33% ± 0.84% for 2,5-DCP and 100.13% ± 0.81% for 2,4-DCP,and good precision,RSD was 0.16% for 2,5-DCP and 0.20% for 2,4-DCP.It was successfully applied in analysis of sample solutions.Based on the results,the conversion,selectivity and yield could be determined.The developed GC method could be used for analysis of 3,4-DCP or for qualitative analysis of samples for its fast and easy operation.The developed HPLC method has been successfully employed in analysis for quality and process control in our production lines of dicamba.The efficient separation and analysis made the production of 2,5-DCP through the hydroxylation of 1,2,4-trichlorobezene practically feasible.
Declaration of Competing Interest
The authors declare that they have no known competing financial interests or personal relationships that could have appeared to influence the work reported in this paper.
Acknowledgements
This work was supported by National Key Research Development Program of China (2017YFB1103002,2018YFB0604304),and National Natural Science Foundation of China (51821004).
杂志排行

Chinese Journal of Chemical Engineering的其它文章
- Comparison of catalyst-coated membranes and catalyst-coated substrate for PEMFC membrane electrode assembly:A review
- Experimental investigation of different brines imbibition influences on co-and counter-current oil flows in carbonate reservoirs
- Experimental investigation on the effect of surface characterization of electrodes on the gas bubble dynamics in electrolyte flow and performance of FLA batteries by using PIV
- Mechanically activated starch magnetic microspheres for Cd(II)adsorption from aqueous solution
- Robust,fluorine-free and superhydrophobic composite melamine sponge modified with dual silanized SiO2 microspheres for oil–water separation
- Efficient adsorption to hexavalent chromium by iron oxalate modified D301:Characterization,performance and mechanisms