Experimental investigation on the effect of surface characterization of electrodes on the gas bubble dynamics in electrolyte flow and performance of FLA batteries by using PIV
2021-08-26SaeedNahidiIrajJafariGavzanSeyfolahSaedodinMahmoudSalari
Saeed Nahidi ,Iraj Jafari Gavzan ,Seyfolah Saedodin, *,Mahmoud Salari
1 Department of Mechanical Engineering,Semnan University,Semnan,Iran
2 Department of Mechanical Engineering,Imam Hossein University,Tehran,Iran
Keywords:Particle image velocimetry (PIV)Flooded lead_acid batteries (FLAB)Insoluble gas bubble Electrochemical reactions Surface characterization of electrodes
ABSTRACT In the flooded lead_acid batteries(FLAB),gas bubbles are initially formed on the surface of the electrodes,which are produced by electrochemical reactions,and then released into the electrolyte.In the present investigation,the effect of surface characterization of electrodes of FLAB on the gas bubble dynamic parameters in the electrolyte flow at different charging/discharging rates (C-rates) are studied utilizing particle image velocimetry(PIV)method.The results show that the capacity of FLAB have a linear behavior due to changes in each of the two parameters of the surface characterization of electrodes and the Crate.At all State of charges (SOCs) of FLAB cells in different tests,increasing average roughness (Ra) and average wavelength of the roughness(λa)in the electrode surfaces,results in an increase in average bubble diameter and bubble rising velocity.Nevertheless,a sharp decrease in the void fraction of bubbles within the electrolyte was observed due to the increment in λa and Ra.Also,the effect of the rising movement of gas bubbles within the electrolyte on the average electrolyte velocity pattern in the gap between the electrodes by changing the surface characterization of electrodes are investigated in detail.
1.Introduction
The consumption of Lead-Acid Batteries(LAB)is increasing due to its low cost,ease of manufacturing,and recyclability.Therefore,in widespread industrial applications,developmental research is highly required to improve the performance of these batteries under specific conditions.
One factor in improving the performance of Flooded Lead-Acid Batteries (FLAB) is enhancing the capacity of the battery at fast charging and discharging rates.So far,various studies have been done for selecting active alloy compositions,the structure and geometry of FLAB,the electrode grid,battery temperature,additives in the aqueous electrolyte solution [1–4].Among these studies,can be mentioned to the Pavlov’s extensive efforts to study the various active alloy compositions during the past two decades,some of which are presented in[1].Pourimarza Agha et al.[5]optimized the capacity of the LAB by changing the battery geometry,especially the thickness of the positive and negative electrodes.Also,Paglietti [6] provides a method for determining the concentration of additives in the electrolyte to achieve the highest capacity by examining the additives used in the LAB.Also,Furukawa et al.[7]and Nakhaie et al.[8]have examined the effect of different patterns of the grid wires configurations on the capacity and performance of LAB by using numerical modeling.
Some researchers,such as Nakhaie et al.[8],Yamashita and Matsumar [9],Pavlov and Bashtavelova [10] and Pavlov and Ignatova [11] believe that surface characterization of electrodes is one of the most effective parameters to improve the performance and extend the long-life of the FLAB under special conditions,which is usually determined during the production and preparation of electrodes in the factory.These researchers used various methods such as Cyclic voltammetry,potentiodynamic polarization,galvanostatic polarization,and electrochemical impedance spectroscopy to measure the surface characterization of electrodes(surface roughness)and the crystal structure of positive and negative active material of electrodes at the different charge and discharge rates (C-rates) and at different State of Charges (SOCs)and Depth of Discharges (DODs),and their effects on the electrochemical parameters of electrodes in the battery cells.Nakhaie et al.[12] show that by increasing surface roughness,despite increasing electrochemical active surface of electrodes,passive film formation on the electrode surface is prevented,corrosion resistance of the electrodes is increased,and the oxidation and reduction reactions during the charging and discharging processes of the electrodes are facilitated.Also,by measuring the lead sulfate crystals in FLAB at full charge and full discharge states in the experimental study of Kabzinski et al.[13],the effect of electrolyte stratification on the surface roughness size distribution of electrodes is emphasized.
In FLA batteries,in addition to the main reactions of(1),(3),side reactions of(2)and(4)are performed on the interfaces of the positive and negative electrodes during charging processes[1–3].This phenomenon is illustrated in Fig.1.As a result of these reactions,hydrogen,and oxygen are produced on the cathode electrode and anode electrode of the FLAB,respectively.

It should be mentioned that at the beginning of the charging process and increasing the voltage of the FLAB cell,hydrogen bubbles production begins at the anode,and when the FLAB cell voltage is reaching to gassing voltage (2.25–2.35 V),and the rate of oxygen production increases,the oxygen bubbles production begins at the cathode.Since they cannot be completely dissolved in the electrolyte,they appear as bubbles on the surface of the electrodes.These bubbles grow over time and,after reaching a critical diameter,are released into the electrolyte.Therefore,by forming bubble layers adjacent to the electrodes,two-phase electrolyte flow occurs in the FLAB cells.
This event,in addition to FLAB,in many other electrochemical cells such as water electrolysis systems for hydrogen production,fuel cells,flow batteries,and flooded electrolyte batteries,causes electrochemical disruption and consequently a loss in the performance of electrochemical cells [14–17].The researchers believe that the presence of these bubbles on the electrode surface reduces the electrochemically active surface of the electrodes and increases the ohmic resistance,thereby reducing the rate of reactions in the electrochemical cells.As mentioned earlier,most studies on the surface characterization of electrodes,mostly focused on the study of the crystal size of the active materials in the electrodes and the electrochemical performance of the FLAB.However,effect of surface characterization on the electrolyte flow and bubble dynamics parameters during the charging,and discharging process of the FLAB cells has gained less attention.A few experimental and numerical studies on electrolyte flow within FLAB cells [18–21],often focused on the effect of electrolyte stratification phenomenon and electrolyte concentration field on the electrolyte flow of FLAB.In the mentioned studies,the two-phase electrolyte flow and the importance of the effects of the presence of gas bubbles in the electrolyte haven’t been taken into account especially in fast charging and discharging processes.
It is known that the dynamic parameters of gas bubbles are strongly dependent on the surface characterization [22–24],So it is expected that by change in this characteristic of electrodes,the sliding distance and departure diameter of bubbles on the electrodes reduced and thereby,the bubble departure frequency and the active surface of chemical reactions on the electrodes increased.Also,by reducing the void fraction bubbles,the electrolyte conductivity may be increased and a reduction in the ohmic resistance of the electrolyte and an increase in the performance of FLAB cells can be occured.To the best knowledge of the authors,there is a gap in the literature regarding the effect of the surface characterization of electrodes on the gas bubble dynamics,electrolyte flow,and performance of FLAB cells.Therefore,in this study,using the particle image velocimetry (PIV) method,the importance of different surface characterization of electrodes on the average bubble diameter,bubble rising velocity and the void fraction of gas bubbles and its effect on the electrolyte flow and performance of FLAB cells at different C-rates of 1C-C10is investigated.The results obtained in this paper can be used to improve the performance of many types of flow batteries,such as Al-AgO and Al-Water or Ni-Cd batteries.
2.Preparation and Measurement of Surface Characterization of Electrodes
In this experimental study,positive and negative electrodes with the specifications presented in Table 1.In all prepared FLAB cells,the gap between electrodes is 6 mm,and the 31%-sulfuric acid aqueous solution (molality 4.6 (mol∙kg-1) and density 1.2232 (g∙cm-3)) as electrolytes is used in FLAB cells.
In order to prepare electrodes with different surface characterization,during the production processes of electrodes in the factory (after the grid pasting process and before the curing and formation processes of electrodes),the different roughness on the positive and negative electrode surfaces are created by special loops made of special surface tread rings (used in turnery),as shown in Fig.2(a).It should be noted that after the curing and formulation process on the electrodes and prior to any test,the electrodes preparation process in the battery cells are performed according to the factory instructions under successive charging and discharging cycles at different C-rates for 37 h.
After the preparation of electrodes,Laser profilometer-LPM-D1(from Fanavari Kahroba Company products,as shown in Fig.2(b))was used to measure the final surface characterization of the electrodes.Fig.3 and Table 2 show the average roughness,the average maximum height of profile,the average wavelength of the profile,and the surface area of the electrodes with a maximum accuracy of 2 μm.

Table 1Specifications of electrodes in the 2 V-battery cells

Table 2Surface characterization of prepared electrodes obtained from laser profilometer-LPM-D1 results

Fig.1.Oxygen and hydrogen bubbles at the vicinity of the electrodes FLAB at SOC 60% and constant C-rate of C5.
3.Experimental Method
In the peresnt study,a DC Megatek MP-3010 power supply(accuracy ±0∙05 A),a discharge device of 50 A (accuracy ±0∙02 A)and 20 V (accuracy±0∙02 V) and a FLUKE multimeter (0.1% accuracy)for voltage measurement at different C-rates of 1 C,C3,C5,C7,and C10are used.In all tests,the charging process of the FLAB cells are started with constant current and the voltage at about 1.98–2.02 V.The process continued at about 2.4 V.Also,the FLAB cells are discharged at a voltage of about 1.98 V and the cutoff voltage is set at 1.5 V.
The measurement of electrolyte flow and gas bubble parameters such as bubble diameter and bubble rising velocity is performed using the PIV method (Fig.4).For this purpose,the images were recorded at 5 different SOCs and 5 different DODs for 30 s by a DINO AM7915MZTL digital microscopic camera.This camera is capable of imaging at 15–30 fps with shutter speeds,and its aperture settings can be adjusted according to the distance from the subject to the camera lens.Also,the camera’s resolution is adjustable based on environmental conditions and test requirements from 640 × 480 to 2544 × 1944.In order to measure the electrolyte flow due to chemical reactions in the FLAB cell using the PIV system,the thin suspended particles within the electrolyte(such as Pb,PbO2,and PbSO4) are used.
These 10–20 μm suspended particles in aqueous sulfuric acid solution (Fig.5(a)) have a very low sedimentation velocity in the electrolyte and therefor,can be displaced by electrolyte movement.Due to the fact that the particles are illustrated bright in the light,the distance traveled by the particles can be measured by imaging the movement of these particles in the electrolyte and taking successive images of these particles over a known interval.This determines the instantaneous velocity of the electrolyte at each location of the imaging plane in the middle segment of the FLAB cell.For this purpose,a MATLAB code has been developed for image processing according to the details presented in[25–28].
It should be mentioned that the insoluble gas bubbles present in the electrolyte have a diameter of about 70–200 μm (Fig.5)and very different velocity from those of the suspended particles so that by performing dimensional filtration during image processing,the average diameter of the bubbles and the average bubble rising velocity can be measured.According to the pixel dimensions of the recorded images as shown in Fig.5(b),the measurement accuracy of particle displacement and bubble diameter in each image processing will be 0.01 mm.
4.Results
4.1.The effect of surface characterization of the electrodes on the performance parameters of FLAB cell
In order to investigate the effect of surface characterization of positive and negative electrodes on the performance of FLAB cells,charge and discharge tests are performed at different constant Crates of 1C (14A),C3(4.6),C5(2.8A),C7(2A),C10(1.4A).for verification of the uncertainty and repeatability,the FLAB cell with electrodes surface characterization of Type 3(λa=2.01 mm)at charge and discharge rate of C5are repeated three times and the standard deviation for the FLAB cell capacities in the identical conditions are obtained about 0.2 A∙h as shown in Fig.6.
The voltage and open circuit voltage (OCV) of the FLAB cells during different C-rates of charging and discharging processes are presented in Fig.7.In this study,the OCVs are measured after removing the charger and discharger from the FLAB cells at each of SOCs and DODs for at least two minutes for OCV stability.
The results demonstrate that the effect of the C-rate of the FLAB cells with the same electrodes on the voltage (Fig.7(a)) and OCV(Fig.7(b)) are more considerable than the impact of the surface characterization of electrodes in the FLAB cells.However,at a constant C-rate,by increasing the surface roughness of the electrodes and thereby increasing the active surface of the chemical reaction,the slope of the voltage at the charging mode increase and consequently the slope of the voltage drop at the discharging mode decline.So that at C-rate of C5,by changing the surface characterization of electrodes from Type 1 (λa=1.01 mm) to Type 3(λa=2.01 mm) and Type 5 (λa=2.83 mm),the FLAB cell capacity is increased 11%and 21%,respectively,as shown in Fig.8.This figure depicts that the capacities of the FLAB cells have resulted in a linear behavior concerning the two parameters of surface characterization of electrodes and the C-rate of the FLAB cells.
By measuring the voltage and OCV of the FLAB cells,it is possible to calculate the ohmic resistance of each FLAB cell in different C-rates of charging and discharging processes.As presented in Fig.11.the effect of C-rate and the surface characterization of electrodes on the ohmic resistance of FLAB cells have been investigated.The results of Fig.9(b) reveal that by varying the surface characterization of electrodes from Type 1 to Type 3 and Type 5 at a constant C-rate,the ohmic resistance is significantly reduced,especially at the end of the processes.This phenomenon can be due to changes in the gas bubble dynamics on the electrode surfaces and within the electrolyte flow as a result of the variations in the surface characterization of electrodes.
4.2.The effect of the surface characterization of electrodes on the bubble dynamics parameters within the electrolyte
As mentioned earlier,so far,many researchers [14,24] have investigated the factors affecting bubble dynamics parameters such as the thermo-physical properties and gravity,cavity spacing and pressure conditions,and the surface characterization of thevertical wall in the nucleate boiling and water electrolysis systems.Most of these researchers believed that by increasing the surface roughness,the nucleation site density and bubble departure frequency increased while the bubble departure diameter and sliding bubble distance on the walls decreased [22–24].Based on the authors’ knowledge,for smoother surface of the electrode,the growing and waiting time of the bubbles increases.Thereby,the exsiting bubbles on electrochemical active surface of the electrodes declines and ohmic resistance for the FLAB cells increases.Therefore in present study,by considering the different surface characterization of electrodes for FLAB cells it has been tried to reduce the diameter of the gas bubbles and increase the bubble departure frequency despite increasing the nucleation site density at high Crates.

Fig.2.(a) Tread rings to create desired surface characterization of the electrodes,(b) Laser profilometer-LPM-D1 to surface roughness measurement.

Fig.3.Positive and negative electrodes prepared with different surface characterization parameters (numbers in images in mm).
Fig.10 represents the generation and distribution of hydrogen and oxygen bubbles within the electrolyte for the Type 3(λa=2 mm)FLAB cell at different SOCs in the C-rate of C5.According to this figure,as the charging process of FLAB cell begins and voltage of FLAB cell increases,intial hydrogen production is observed on the cathode (right side of the images in Fig.10(a)).After the electrolyte saturation of hydrogen,hydrogen cannot be removed entirely in the electrolyte and therefore appears as hydrogen bubbles on the cathode surface(Fig.10(b)).After the growth of the bubbles and reaching the critical diameter,they are released into the electrolyte (Fig.10(c) and (d)).This behavior is true for all tests concerning the constant C-rate and voltage variations of the FLAB cell.In all tests,as the voltage reaches the gassing voltage about 2.25–2.35 V,the oxygen bubble production starts due to the electrolysis of water on the anode(left side of the images in Fig.10)and with increasing voltage,the rate of oxygen bubbles production rises sharply(Fig.10(e)).Under these conditions the bubbles have a rotational motion within the electrolyte due to the inability of all bubbles to exit the electrolyte free surface,.The difference between the starting time of hydrogen bubbles production on the cathode and oxygen bubbles production on the anode is due to the difference in the equilibrium potentials of the hydrogen and oxygen electrodes in the electrochemical reactions of the charging and discharging processes in the FLAB cell [1–3].

Fig.4.A view of the PIV system used in the present study.

Fig.5.The images were taken by the present PIV system for FLAB cells with different prepared electrodes.
The average diameter and rising velocity of hydrogen bubbles within the electrolyte of different FLAB cells at different SOCs are shown in Fig.11(a) and (b),respectively.These figures demonstrate that the average diameter and average rising velocity of bubbles increase approximatly linearly by increasing FLAB cell voltage and SOC for all test conditions.Also,as can be seen in Fig.11(a)the average diameter of the bubbles has significantly increased at different SOCs with the increase in the rate of charging processes of the identical FLAB cells.According to this figure,by increasing Ra,Rz,and λa,a rise in average bubble diameter is observed so that by varying the surface characterization of the electrodes from Type 1 (λa=1.01 mm) to Type 3 (λa=2.01 mm) and Type 5(λa=2.83 mm),at C-rate of C5for all FLAB cells,the average diameter of hydrogen bubbles at SOC 70%increases about 12%and 15%,respectively.
As shown in Fig.4,the camera position is located at the top of the FLAB cell electrodes,so that the average diameter and the rising velocity of the hydrogen bubbles can be considered as the maximum average diameter and the rising velocity of the hydrogen bubbles presented within the electrolyte.So far,the diameter and velocity of the gas bubbles due to electrochemical reactions during the charging process of FLAB cells have not been reported in other studies.However,the outcomes of this study are in agreement with the results reported by Parkinson et al.[29]to measure the diameter and velocity of different gas bubbles in the water.
According to the results obtained in this experimental study,in all tests except tests with a constant C-rate of 1C,oxygen bubble production is initiated only at high SOCs (about 70% SOC),and the average diameter of its bubbles due to water electrolysis is in the range of 0.1–0.2 mm.In the charging processes with a constant C-rate of 1C of FLAB cells,as shown in Fig.7(a),the charging start voltage is about 2.6 V,and the electrolysis of water and the production of hydrogen and oxygen bubbles on both electrodes begins.In these conditions,due to the high rate of oxygen and hydrogen pro-duction,the bubbles cannot exit the free surface of the electrolyte.Therefore,the bubbles have rotational movements thus,the electrolyte flow is turbulent.

Fig.6.Repeatability study of the charge and discharge processes of FLAB cells with identical specifications (λa=2.01 mm).

Fig.7.Voltage and OCV of prepared FLAB cells at different C-rates.

Fig.8.The Capacities of prepared FLAB cell by different surface characterization of electrodes at different C-rates.
One of the most important effects of the surface characterization of electrodes in FLAB cells for different modes is on the void fraction (ε) of gas bubbles within the electrolyte.Since in experimental studies,direct measurement of ε from 2D images is challenging due to three-dimensional physics so in most studies[14,16] the estimation of electrolyte resistance Rε in the presence of gas bubbles and relationis used to determine ε.
In the present study,by neglecting the resistance of the anode and cathode electrodes in the prepared cells,the initial ohmic resistance of FLAB cell(Fig.9)is calculated as electrolyte resistance(Re) when the gas bubbles are not present within the electrolyte.Then,with the presence of gas bubbles within the electrolyte,the FLAB cell resistance is taken as Rε and using the relation[14],the ε is calculated.The results in Fig.12(a)for the FLAB cells with a constant C-rate of C5demonstrate that the ε of FLAB cells have decreased at the same period by varying the surface characterization of the electrodes from Type 1 to Type 3 and Type 5.
4.3.The effect of the surface characterization of the electrodes on the electrolyte velocity
When the FLAB cells are charged,according to the main reactions of (1),(3),sulfuric acid is produced and water consumed at the vicinity of the anode and cathode electrodes.Therefore,the increase in concentration of sulfuric acid aqueous solution and its specific density casuse the electrolyte near the anode and the cathode move to the bottom and the electrolyte in the central region between the electrodes moves to the top of the FLAB cells.At low SOCs of FLAB cell and when gas bubbles do not exist in the electrolyte,these electrolyte motions cause the electrolyte flow in the FLAB cell due to natural convection,as shown in in Fig.13(a).Thus,in the bottom and top of FLAB cells,two layers higher and lower acid concentration (greater and lower specific density) of electrolyte are formed,respectively.This vertical concentration gradient of electrolyte is called the stratification phenomenon.This phenomenon is considered as a destructive phenomenon for performance of FLAB,so that causes a vertical gradient in the distribution of PbSO4on the andode and cathode electrodes (where the electrolyte concentration is the highest,the concentration of lead sulfate is higher and vice versa) [1–3].

Fig.9.The Ohmic resistance of FLAB cells (a) with Type 3 (λa=2.01 mm) electrodes at different C-rates and (b) at C-rate of C5 for different types of electrodes.

Fig.10.The generation and distribution of gas bubbles within the electrolyte of FLAB cell with Type3(λa=2.01 mm)electrodes at different SOCs of the charging process with a constant C-rate of C5.
However,due to this phenomenon in FLA batteries,the average electrolyte velocity in the X and Z directions is negligible compared to the vertical component of the average electrolyte velocity[1,28].Fig.13(b)shows the average vertical velocity of electrolyte flow at different SOCs of Type 5 FLAB cell with a constant C-rate of C5so that the anode and cathode electrodes are located at x/d=0 and x/d=1,respectively.As shown in this figure,the electrolyte flow follows the electrolyte stratification phenomenon at SOC 10% and SOC 30% where the presence of gas bubbles on the surface of the electrodes and within the electrolyte is negligible.In this case,the electrolyte flow moves downward and upwardin at the vicinity of the electrode walls and in the middle part of the FLAB cell,respectively.As mentioned earlier,increasing SOC of FLAB cells and reaching their voltage to gassing voltage,the hydrogen and oxygen bubbles production form on the cathode and the anode electrodes,respectively,and release within the electrolyte.This presence of bubbles within the electrolyte at the high SOCs and the effect of their rising bubble velocity changes the pattern of fluid electrolyte flow at vicinity of anode and cathode electrodes and can eliminate the stratification phenomenon in the FLAB cells.The effect of the average rising velocity of bubbles on the electrolyte velocity at the vicinity of electrodes is presented in Fig.13(b) at SOC 50% and SOC 70%.This result shows that the average vertical velocity of electrolyte flow at high SOCs has increased approximately twice in comparison this velocity at low SOCs by increasing the average rising velocity and,the void fraction of bubbles.
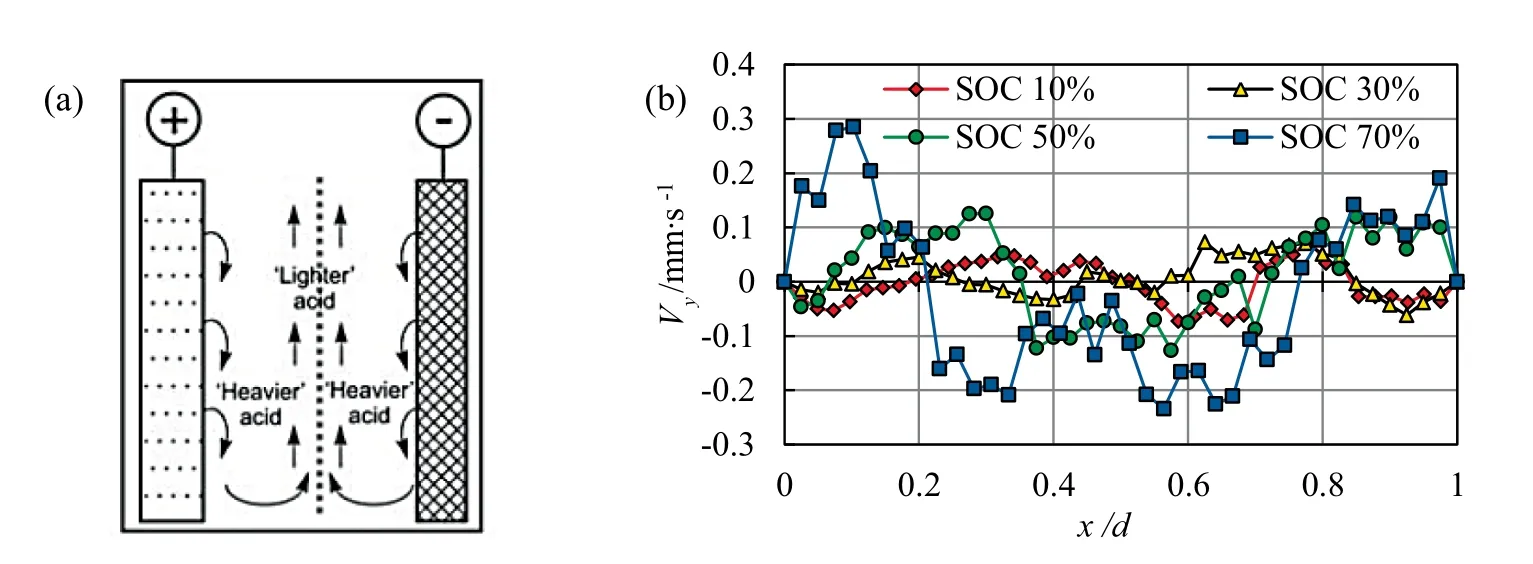
Fig.11.(a) Average diameter and (b) Average rising velocity of hydrogen bubbles within the electrolyte of prepared FLAB cells at different modes.
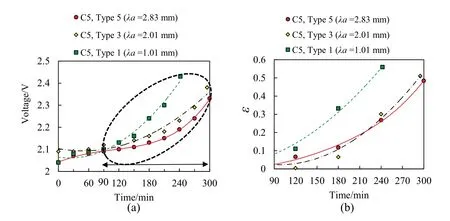
Fig.12.The effect of the surface characterization of the electrodes in the prepared FLAB cells on the void fraction of gas bubbles within the electrolyte during charging processes.

Fig.13.(a)The electrolyte flow pattern during the FLAB cell charging process under the stratification phenomenon[1],(b)average vertical velocity of the electrolyte within the Type 5 FLAB cell at different SOCs (constant C-rate of C5).
In Fig.14,the effect of the surface characterization of the electrodes on the average vertical velocity of the electrolyte within the different FLAB cells with constant C-rate at two SOCs is represented.This result shows that at low SOCs (such as SOC 10% in Fig.14(a)),when gas bubbles do not exist in the electrolyte,the effect of change in the surface characterization of electrodes from Type 1 (λa=1.01 mm) to Type 3 (λa=2.01 mm) and Type 5(λa=2.83 mm),on the average vertical velocity of the electrolyte can be ignored.But at high SOCs (such as SOC 70% in Fig.14(b)),increasing the average roughness and average wavelength of the roughness(λa)of the electrode surfaces,results in increase of average diameter and rising velocity of bubbles due to higher sliding time of bubbles on the electrodes and thereby increase in the average vertical velocity of the electrolyte.

Fig.14.The effect of the surface characterization of the electrodes in the prepared FLAB cells on the electrolyte velocity within the FLAB cells with C-rate of C5 at SOC 10%and SOC 70%.
5.Conclusions
In the present experimental study,using PIV method,the effect of the surface characterization of the electrodes on the performance of FLAB cells and the gas bubble dynamic parameters in electrolyte flow during charging and discharging processes with different C-rates is investigated.The results that the capacities of the prepared FLAB cells have linear behavior with the surface characterization of the electrodes and the C-rate of chargingdischarging processes.In all tests,the average diameter and rising velocity of gas bubbles increased by increasing the average roughness and average wavelength of electrode surfaces.Also,in present paper,the effect of rising movement of gas bubbles within the electrolyte,especially in the vicinity of the electrodes,on the electrolyte flow pattern of FLAB cells at different modes is presented in detail.
Declaration of Competing Interest
The authors declare that they have no known competing financial interests or personal relationships that could have appeared to influence the work reported in this paper.
杂志排行

Chinese Journal of Chemical Engineering的其它文章
- Comparison of catalyst-coated membranes and catalyst-coated substrate for PEMFC membrane electrode assembly:A review
- Experimental investigation of different brines imbibition influences on co-and counter-current oil flows in carbonate reservoirs
- Mechanically activated starch magnetic microspheres for Cd(II)adsorption from aqueous solution
- Robust,fluorine-free and superhydrophobic composite melamine sponge modified with dual silanized SiO2 microspheres for oil–water separation
- Efficient adsorption to hexavalent chromium by iron oxalate modified D301:Characterization,performance and mechanisms
- One-step fabrication superhydrophobic sand filter for capillary-driven separation of water-in-oil emulsions