Magnetostriction and spin reorientation in ferromagnetic Laves phase Pr(GaxFe1−x)1.9 compounds∗
2021-06-26MinYuZeng曾敏玉QingTang唐庆ZhiWeiMei梅志巍CaiYanLu陆彩燕YanMeiTang唐妍梅XiangLi李翔YunHe何云andZePingGuo郭泽平
Min-Yu Zeng(曾敏玉) Qing Tang(唐庆) Zhi-Wei Mei(梅志巍) Cai-Yan Lu(陆彩燕)Yan-Mei Tang(唐妍梅) Xiang Li(李翔) Yun He(何云) and Ze-Ping Guo(郭泽平)
1Guangxi Key Laboratory of Nuclear Physics and Nuclear Technology,Guangxi Normal University,Guilin 541004,China
2School of Electronic Engineering and Automation,Guilin University of Electronic Technology,Guilin 541004,China
Keywords: easy magnetization direction(EMD),magnetostriction,spin-reorientation
1. Introduction
The binary C15 cubic Laves phase compound terfenol-D (Tb0.27Dy0.73Fe2) is well known for its outstanding magnetostriction at room temperature, which is widely applied in acoustic transducers,sensors,and actuators.[1–3]However,the heavy rare earths are expensive, and their excellent magnetostrictive properties can only retain at the temperature range of−20◦C to+60◦C.[4,5]Therefore,the low-cost compound PrFe2,which has large magnetostriction at a wide temperature range(λ111∼5600 ppm at 0 K and|λ‖−λ⊥|∼1100 ppm at room temperature)should be of giant interest.[1,6–8]However,the alloy also exhibits large magnetocrystalline anisotropy at low temperatures. Therefore, in the past decades, much efforts have been paid on developing a RxPr1−xFe2anisotropic compensation system by selecting another RFe2alloy with different signs of magnetocrystalline anisotropy constantK1to PrFe2to obtain large magnetostriction at low magnetic fields.[9–17]
To develop a RxPr1−xFe2anisotropic compensation system, the studies of crystal structures and spin reorientation temperature (TSR) in PrFe2are significant. This is because for RFe2alloys, there is a one-to-one relationship between lattice distortion and EMD (rhombohedral structure with EMD along〈111〉, orthorhombic structure with EMD along〈110〉,and tetragonal structure with EMD along〈100〉,respectively).[1,6,16–21]Besides,different EMDs correspond to different magnetocrystalline anisotropy properties, ifK2and higher-order anisotropy constants are neglected.[21]PrFe2is a tetragonal symmetry below itsTSR(70 K) and a rhombohedral structure above itsTSR.[1,6–8,22]Then, another RFe2alloy considered in a RxPr1−xFe2anisotropic compensation system should be selected basing on the crystal structure andTSRof PrFe2. For example, TbFe2with EMD lying along〈111〉should be considered whenT <70 K,[1,23,24]and DyFe2with EMD lying along〈100〉should be considered when 70 K<T <300 K,etc.[1,19]
As mentioned above,TSRis an important property for PrFe2alloy, which significantly impacts the EMD and magnetic anisotropy. Low magnetocrystalline anisotropy frequently occurs atTSR.[9–16]Therefore, it is of great interest if we find a method to control it for different temperature applications. According to the investigations of Ga substitution for Fe in TbFe2system, the EMD of the compound may deviate slightly from the major axis of symmetry, and it leads to the increase of tetragonal distortionλ100.[25]Besides, the investigation of Ga substitution for Fe in Dy0.6Tb0.3Pr0.1(Fe0.95−xMn0.05Gax)1.85alloys shows that the substitution can affect the homogeneity region and the grain size of the multicomponent pseudobinary compound(Dy,Tb,Pr)(Fe,Mn,Ga)2.[26]These results indicate that Ga substitution for Fe can impact the EMD orTSRin the alloys.Then,we would like to examine here the effect of Ga substitution for Fe in the magnetic and magnetostriction properties,especially the EMD andTSRin PrFe1.9alloy. Here, we choose the ratio of R:(Fe,Ga)as 1:1.9 instead of 1:2 in order to obtain a more pure Laves phase.[7,9]
2. Experiment design
We prepared the ingots of Pr(GaxFe1−x)1.9withx=0.0,0.02, 0.05, 0.10, and 0.15 stoichiometry by melting the high purity metals in a magneto controlled arc furnace in an argon atmosphere. The purities of the constituents are 99.9 wt%.Because the radius of Pr3+is large, and the radius ratio of(R,Pr):Fe ion is too big to fit the ideal atomic radius ratio for Laves phase(1.225),the ingot were pressed to 6 GPa by a hexahedral anvil press and heated to 900◦C for 30 min to obtain single-phase Laves phase.[7,27]Conventional x-ray diffraction(XRD)analysis was carried out at room temperature using CuKαradiation with a Rigaku D/Max-gA diffractometer. Figures 1(a) and 1(b) show the examples of XRD spectrum of Pr(GaxFe1−x)1.9compounds prepared under ordinary pressure and high pressure,respectively. The indices(hkl)of the Laves phase are also indexed here.[7,15,27,28]It can be seen from Fig. 1(a) that cubic Laves phase could hardly be observed in the samples prepared under ordinary pressure. However, all of the samples prepared by high-pressure annealing method exhibit almost single Cubic Laves phase with MgCu2structure, with minor impurity phases (i.e.rare-earth phases) over the whole concentration range investigated.[7,15,27,28]This indicates high-pressure annealing method is an effective method to prepare cubic Laves phase alloys with high content of Pr.The lattice parameters were calculated from the{220},{311},{422},{333}, and{440}XRD spectra of Fig. 1(b) by Unit-Cell. The Curie temperatureTCwas detected by a thermal gravitation analyzer (TGA) with a vertical gradient magnetic field under the samples. The Curie temperatureTCwas determined by the differential thermal analysis(DTA).The crystal structure was determined by the Rigaku-TTR3 x-ray diffractometer. The scaling scale is from 40.5◦to 43◦for the{440}peak and from 70.5◦to 73◦for{222}peak,respectively,both with a step width of 0.02 between 15 K and 300 K. The xray diffraction(XRD)was performed with a fitted time mode,where each point was relaxed for 4 seconds. The XRD peaks were fitted by Jade 6.5 XRD analytical software, and the effect of theKα2radiation was eliminated by a standard process. We used superconducting quantum interference device magnetometer (SQUID) to measure the temperature dependence of the magnetization(M)to determineTSR. The magnetostrictions were measured using standard strain-gauge technique, while the magnetic fields were supplied by Quantum Design physical property measurement system (PPMS). The57Fe M¨ossbauer spectra were collected on a constant accelerated spectrometer with the transmission geometry at room temperature and 77 K, with the source of57Co in Pd matrix with an activity of about 25 mCi. The spectrums were calibrated with a standardα-Fe foil and analyzed by Lorentzian lines in 256 channels using the software Klencsar and Moss-Winn.

Fig. 1. XRD patterns of Pr(GaxFe1−x)1.9 compounds prepared (a) under ordinary pressure and(b)high pressure,respectively.
3. Results and discussion
In order to detect the Curie temperatureTCof Pr(Fe1−xGax) alloys, the thermo gravimetric analysis (TGA)was performed, and the results are shown in Fig. 2. ThenTCwas determined by the differential thermal analysis(DTA),which is shown in the inset of Fig. 2 (taking the alloy withx=0.02 as an example).
The concentration dependence ofTCis plotted in Fig.3.It can be found in Fig.3 thatTCdecreases from 513 K to 433 K with increasing Ga concentrationx, which can be probably attributed to the decrease ofR–Tcoupling strength due to Ga substitution.It is similar to the results of Tb(Fe1−xGax)[25]and Dy0.6Tb0.3Pr0.1(Fe0.95−xMn0.05Gax)1.85alloys.[26]The lattice parameteracalculated from the XRD spectra (Fig. 1(b)) is also plotted in Fig. 3. The lattice parameter increases from 0.746 nm to 0.753 nm with increasing Ga content,which can be attributed to the larger atom radius of Ga compared to that of Fe. This result is also similar to that of Tb(Fe1−xGax)[25]and Dy0.6Tb0.3Pr0.1(Fe0.95−xMn0.05Gax)1.85alloys.[26]
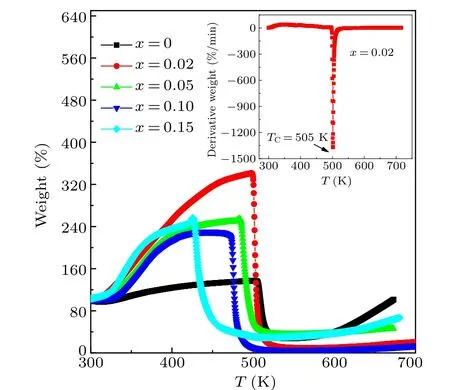
Fig.2. The TGA of Pr(GaxFe1−x)1.9 alloys. The inset shows the differential thermal analysis of the alloy with x=0.02.

Fig.3. Ga concentration dependence of lattice parameter a and Curie temperature TC,respectively.
Figure 4 shows the magnetic field dependence of magnetostrictionλ=(λ||−λ⊥)at both room temperature and 5 K,respectively. As shown in Fig. 4(a), the magnetostriction decreases monotonously with the increasingxat room temperature (RT), due to the decrease of magnetic properties of the compounds.[1,25,26]Once again,this result is similar to that of Tb(Fe1−xGax)[25]and Dy0.6Tb0.3Pr0.1(Fe0.95−xMn0.05Gax)1.85systems.[26]However,at 5 K,Ga substitution reduces the magnetostriction when 10 kOe≤H ≤90 kOe,while it yields an increased magnetostriction with 0 kOe≤H ≤10 kOe,as shown in the inset of Fig. 4(b). This indicates that Ga substitution with 0.02≤x ≤0.05 can enhance the magnetostriction at 5 K.

Fig.4.(a)The field dependence of magnetostriction(λ=λ||−λ⊥)at RT.(b)The field dependence of the magnetostriction(λ||)at 5 K of Pr(GaxFe1−x)1.9 alloys. The inset shows λ|| with 0 kOe ≤H ≤12 kOe.

Fig. 5. Temperature dependence of the magnetization (M) for the alloys with x=0.0, 0.02, 0.05, 0.10, and 0.15, respectively, at the field strength H=50 kOe. The inset shows the determination of TSR when x=0.15.
Figure 5 shows the magnetization (M) temperature dependence of the alloys at the magnetic field of 50 kOe.An abnormity can be seen clearly in the magnetization (M)curve for each compounds, which has been marked by an arrow in the figure. By comparing theM–Tdata with those obtained from the high-precision XRD step scanning,as well as our earlier reported M¨ossbauer spectra measurements,we are able to identify the anomalies corresponding to the spin reorientations.[8,10,13,16–20,29,30]Forx=0,an anomaly appears in the form of a peak at 74 K, which is identified as a spin reorientation taking place from〈100〉to〈111〉. Then this anomalies seems to shift to approximately 120 K whenxincreases from 0.0 to 0.15. The anomaly forx=0.15 is not very obvious, but it can be observed in an enlarged view as shown in the inset of Fig.5,which is similar to the situations of Sm0.76Nd0.24Fe2and Sm0.7Nd0.3Fe2.[29]
In order to further confirm the EMD type in Gacontainning alloys above and below the anomalies temperature inM–Tcurve, a high-precision XRD step scanning was performed on Pr(Ga0.02Fe0.98)1.9for the{222}and{440}peaks during cooling from 300 K to 15 K after elimination of Kα2, which are shown in Figs.6(a)and 6(b), respectively.The double-splitting of the{222}and{440}reflections (the intensity ratio of split peaks is about 1:3 and 1:1, respectively) between 135 K and 300 K are typical for rhombohedral structure,[1,6–8,19,20]indicating the EMD of the compound lies along〈111〉in this temperature range. On the other hand,a prominent tetragonal symmetry can be seen between 15 K and 80 K,which can be confirmed by the non-splitting of the{222}reflections and doubly splitting of the{440}reflections.This indicates the EMD of the compound lies along〈100〉in this temperature range. Thus we can conclude that the spinreorientation occurs in the Pr(Ga0.02Fe0.98)1.9alloy,which has been verified in Pr-containning alloys.[1,6–8]

Fig.6. The profiles of the step-scanned{440}and{222}XRD reflection of the sample with x=0.02.

Fig. 7. 57Fe M¨ossbauer spectra of Pr(Ga0.02Fe0.98)1.9 at 77 K and room temperature,respectively.
Figure 7 shows the57Fe M¨ossbauer spectra for singlephase Pr(Ga0.02Fe0.98)1.9at both 77 K and room temperature,where the circles present the experimental data and the solid lines give the fitted curves. The data can be fitted by two sextets with area ratio about 3:1 at room temperature, indicating that the EMD is along the〈111〉axis.[9,22,23,31]On the other hand,for the data at 77 K,the spectra can be fitted by a single sextet,indicating that EMD is lying along〈100〉.These results are in good agreement with the XRD result in Fig. 6. Therefore,the abnormities in magnetization(M)results in Fig.5 can be explained by the transform of EMD from〈111〉to〈100〉in the alloys.
The phase diagram of the spin configuration accompanied with different structures for Pr(GaxFe1−x)1.9alloys are plotted in Fig. 8, in whichTSRis obtained from the collection of theM–Tcurve in Fig. 5 andTCis obtained from the collection of the DTA data in Fig. 3. Meanwhile, the EMD type were determined by XRD (Fig. 6) and M¨ossbauer spectra measurements (Fig. 7), and were represented by red circle, blue trigon, light blue diamond, and pink trigon, respectively. It can be seen from Fig. 8 that the phase diagram can be separated into three regions,which have been identified by cubic symmetry region I, rhombohedral symmetry region II,and tetragonal symmetry region III, respectively. It can be seen that the EMD types accurately land in the corresponding region (〈111〉in region II and〈100〉in region III). This indicates that the data from XRD and M¨ossbauer spectra measurement are well consistent with theTSRdetermined byM–Tcurve. Furthermore, it shows thatTCdecreases with increasing Ga concentrationx, due to the decrease ofR–Tcoupling strength caused by Ga substitution.[19,20]An increase ofTSRfrom 70 K to 120 K can be seen in Fig. 8, with the increasing Ga concentrationx. It indicates that the 3d–4f hybridization or even 4f–4f coupling is composition-sensitive in this system.[25,26]This result is similar to that of Co or Al substitution for Fe in light rare earth Laves phase compounds,such as Pr0.5Nd0.5(Fe1−xCox)1.9,[16]Nd(Fe1−xCox)1.9,[32]Pr(Fe1−xCox)1.9,[33]and Pr(Fe1−xAlx)1.9systems.[34]However, it is different to that in Tb0.3Dy0.7(Fe1−xMnx)2,[35]and Sm0.88Dy0.12(Fe1−xCox)2systems,[36]in which Co or Mn substitution for Fe slightly decreasesTSR. The underlying physical mechanisms is still to be investigated.

Fig. 8. Phase diagram of the spin configuration accompanied with different crystal structures for Pr(GaxFe1−x)1.9 compounds(Ms denotes the easy magnetization direction,PS denotes the paramagnetic state).
The intrinsic magnetostrictionλ111of the PrFe1.9and Pr(Ga0.02Fe0.98)1.9as a function of temperature is shown in Fig.9,in whichλ111was obtained from
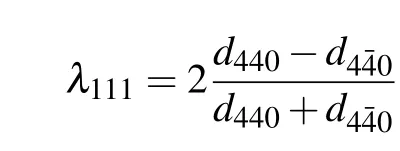
withd440anddenoting the crystallographic plane distances of{440}and{40}, respectively. The parametersd440andcan be calculated by the Bragg’s formulaλ=2dsinθ(λrepresents the wavelength,θrepresents the angle of diffraction in Fig.7).[6,9,30]The data ofλ111in PrFe1.9were obtained from Ref.[8]. The error ofλ111was estimated by the error transfer formula
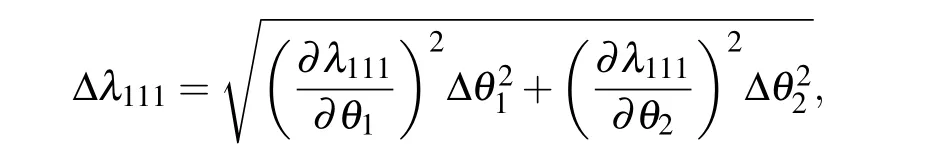
in whichθ1andθ2stand for the diffraction angles of{440}and peaks,respectively,and the scanning angle error is ∆θ=0.02◦/2. Significant decrease ofλ111with increasing temperature can be observed in both samples, which can be attributed to the rapid decrease of the sublattice moment with decreasing temperature.[1]Ga substitution yields a rapid decrease spontaneous magnetostrictionλ111. This is similar to the result of Ga substitution for Fe in TbFe2. which can be explained by the single-ion model.[25,26]According to the singleion model,λ111varies with temperature as magnetic momentσ3R(T). Assuming the rare earth sublattice moment decreases with decreasing Curie temperatureTC,the decrease ofTCwith increasing Ga content results in a decrease ofσ3(T), which leads to a reduction in the spontaneous magnetostrictionλ111.
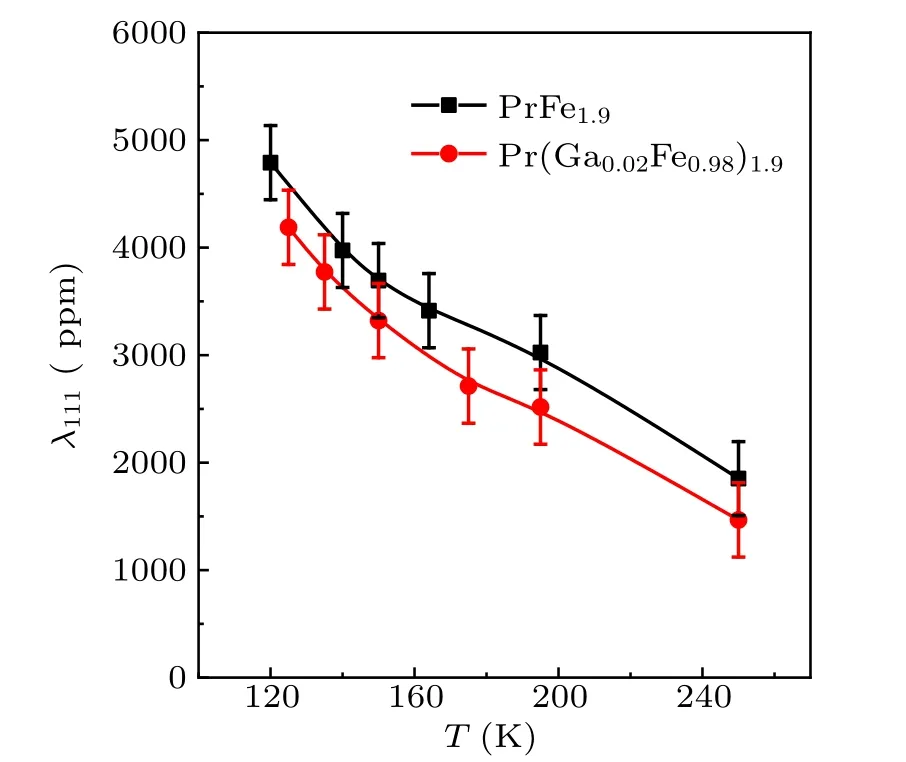
Fig. 9. Temperature dependence of the spontaneous magnetostriction λ111 for PrFe1.9 and Pr(Ga0.02Fe0.98)1.9.
4. Conclusions
Ga substitution decreases the magnetostriction with magnetic field ofH ≥8 kOe, while increases the magnetostriction when 0 kOe≤H ≤8 kOe for the compounds withx ≤0.05 at 5 K. Drastic transition of the step scanned XRD and M¨ossbauer spectra, as well as the abnormal temperature dependence of magnetization and magnetostriction are observed,which indicate the occurrence of spin-reorientation (SR) in all the alloys investigated. The phase diagram is constructed,which illustrates an increase of the spin-reorientation temperatureTSRdue to Ga substitution.
猜你喜欢
杂志排行

Chinese Physics B的其它文章
- Quantum computation and simulation with vibrational modes of trapped ions
- ℋ∞state estimation for Markov jump neural networks with transition probabilities subject to the persistent dwell-time switching rule∗
- Effect of symmetrical frequency chirp on pair production∗
- Entanglement properties of GHZ and W superposition state and its decayed states∗
- Lie transformation on shortcut to adiabaticity in parametric driving quantum systems∗
- Controlled quantum teleportation of an unknown single-qutrit state in noisy channels with memory∗