Dynamics analysis in a tumor-immune system with chemotherapy*
2021-05-24HaiYingLiu刘海英HongLiYang杨红丽andLianGuiYang杨联贵
Hai-Ying Liu(刘海英), Hong-Li Yang(杨红丽), and Lian-Gui Yang(杨联贵)
School of Mathematical Sciences,Inner Mongolia University,Hohhot 010021,China
Keywords: dynamical model,tumor-immune system,chemotherapy,chaos
1. Introduction
It is well known that neoplastic diseases is one of the greatest killer diseases in the world. Tumor growth is a complex process, which puzzles the researchers with new and interesting challenges in relation to the dynamics and control of tumor growth. Unfortunately,interactions between cell populations like normal cells,effector immune cells,tumor cells,or other cell populations have not been fully understood. Thus,theoretical models are required to analyze the key parameters that control system dynamics.[1,2]They can also be used for designing new effective treatments.
Many murine and in vitro studies have shown that immune system can kill tumor cells.[3,4]The immune system is the body’s defensive force. It helps prevent the invasion of foreign substances or promotes killing them. The substances that cause the immune system to response are called antigens.Anything that contains antigens can be recognized and destroyed by the immune system, such as pathogens or cancer cells. Pathogens are very different from normal cells and can be easily recognized as foreign substances, while the difference between cancer cells and normal cells is relatively small.For this reason,the immune system may not always recognize cancer cells as foreign substances. So the immune system’s ability to recognize and attack cancer cells is much weaker than pathogens. Sometimes, the immune system recognizes cancer cells but cannot eliminate them completely. On the one hand,the response may not be strong enough to kill them. On the other hand,cancer cells themselves can release substances to inhibit the immune system.
Kuznetsov et al.[5]proposed an ODE model including effector immune cells and tumor cell populations. They showed that even with two cell populations,these models can provide very rich dynamics based on key parameters and explain some very important issues in cancer progression. Kirschner and Panetta[6]illustrated the dynamics between tumor cells, immune cells,and interleukin-2 through mathematical model. A simple model of three competing cell populations(host cells,immune cells, and tumor cells) was proposed by Letellier et al.,[7]which investigated the action of some parameter values on the resulting dynamics. These theoretical studies of tumorimmune dynamics are very useful and can enlighten scientists to design more effective treatments to help the immune system recognize cancer cells and enhance their response to destroy them. In the past few decades,immunotherapy has become an important part of the treatment of several cancers.
The other most common treatment for cancer is chemotherapy: the treatment with a drug or combination of drugs through some protocols. Chemotherapy is harmful for normal cells and causes a series of side effects due to the poor selectivity of chemotherapeutic drugs. In addition, more effective drugs may be more toxic. Although chemotherapy alone cannot completely eliminate cancer cells,the benefit of chemotherapy persisted.[8,9]Combination therapy has become exciting new strategies for treating tumors. Several studies have shown that an appropriate combination of immunotherapy and chemotherapy can generate synergistic effects.[10–13]Other clinical studies have suggested that the success of combination therapy mainly depends on the choice of drugs used and the administration scheme.[14,15]Here we consider the chemotherapy agent as a predator on all cells. According to experimental protocols, we use a constant amplitude[16]for the continuous infusion rate of chemotherapy.We consider the chemotherapy agent to be a cell-cycle non-specific chemotherapeutic drug(e.g. cyclophosphamide[17])in our model,which can not distinguish proliferating and non-proliferating cells,and has killing effect on all cells.
Mathematical modeling of tumor growth is a powerful tool to understand the system dynamics. Many mathematical models of tumor growth use nonlinear ODEs.[6,18–22]A mathematical model on tumor growth using mixed immunotherapy and chemotherapy is established in this paper. We consider three competing cell populations(host cells,effector immune cells,and tumor cells)and chemotherapeutic drug in our model. This paper is organized as follows: we describe our model in Section 2. In Section 3, we analyze the existence and stability of equilibrium points. We perform a numerical simulation under a certain parameter set and show the chaotic attractor in Section 4. We end with a conclusion in Section 5.
2. Mathematical model
We now present our model of interactions between normal (host) cells, effector immune cells, tumor cells, and chemotherapeutic drug. The model is based on the considerations described below:
(i)Both normal cells and tumor cells exhibit logistic proliferation rates and compete for available resources,as justified in Refs.[24–26].
(ii)In order to keep the model simple,we assume that the rate of recognition of the tumor cells by the immune system depends directly on the number of tumor cells with positive constants ρ2,according to a Holling type-2 function.[5]
(iii) The tumor cells are being destroyed by effector immune cells at a rate proportional to the product of densities of tumor cells and effector immune cells.[7]
(iv) Chemotherapeutic drug acts as a killer, which has a negative effect on all cells.[27]
(v)The concentration of the chemotherapy drug increases due to continuous infusion.[28]
(vi) The concentration of the chemotherapy drug decreases due to its effect on the cells and also because of the washout process.[28]
(vii) Effector immune cells decrease due to their action on the tumor cells,as well as the natural death process and the killing of chemotherapeutic drug.[29]
Hence, the model can be shown by the following set of ordinary differential equations:
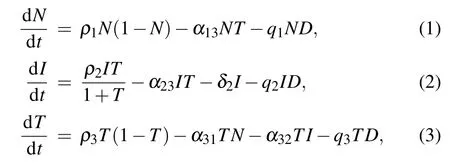
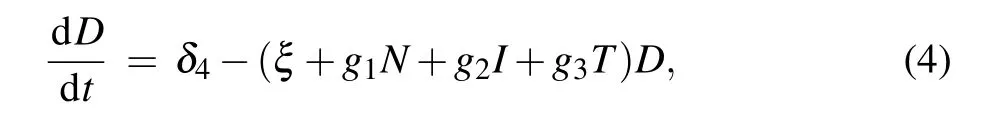
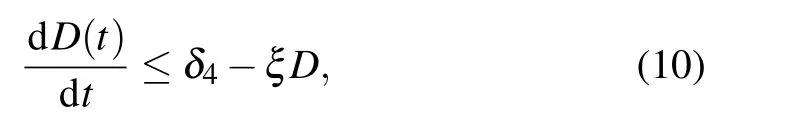
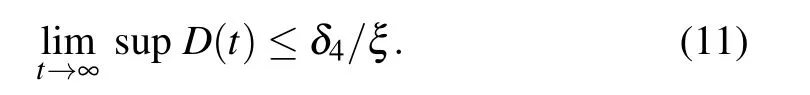
where N(t),I(t),and T(t)are the numbers of normal cells,effector immune cells,and tumor cells,respectively. D(t)is the concentration of the chemotherapeutic drug at time t.
All the model parameters are positive constants and may be interpreted as follows: ρ1, ρ2, ρ3are growth rates of normal cells,effector immune cells,and tumor cells,respectively;α13,α31are competition coefficients between normal cells and tumor cells;α23is effector immune cells inhibition rate by tumor cells; α32is tumor cells killing rate by effector immune cells; δ2is natural death rate of effector immune cells; δ4is the infusion rate of the chemotherapeutic drug; ξ is washout rate of chemotherapy;q1,q2,q3are coefficients of chemotherapeutic drug on normal cells, effector immune cells, and tumor cells,respectively;g1,g2,g3are the combination rates of the chemotherapeutic drug with normal cells,effector immune cells,and tumor cells,respectively.
Theorem 1 The solutions N(t), I(t), T(t), and D(t) of system equations (1)–(4) with nonnegative initial conditions N(0), I(0), T(0), and D(0) remain in the nonnegative ones other than t for all t ≥0.
Proof Let us consider the system Eqs. (1)–(4) in vector form X =(N,I,T,D)T∈R4and

where F : C+→R4, F ∈C∞(R4). Then the system equations(1)–(4)become

From the standard Kamke comparison theory[30,31]we have
Similarly,system(3)leads to
Since gi>0,with i=1,2,3,we obtain from system(4)
which means that
Now,from system(2)it follows that

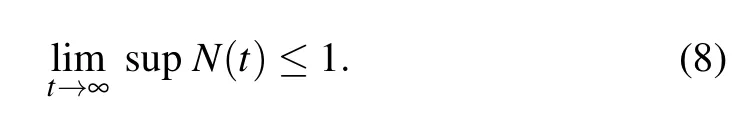
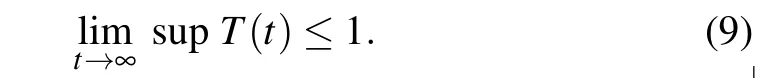
We assume that supN(t)=Ns,infN(t)=Ni,supT(t)=Ts,infT(t)=Ti,sup D(t)=Ds,infD(t)=Didue to the boundedness of N(t),T(t),and D(t),where sup stands for supremum and inf stands for inferior. Hence

Then we have

Therefore,
which completes the proof.
3. Existence and stability of equilibrium points
In this section, we will obtain the equilibrium points of our system and investigate the existence and stability behavior of the system at various equilibrium points. In order to get the fixed points of the system Eqs.(1)–(4),we set
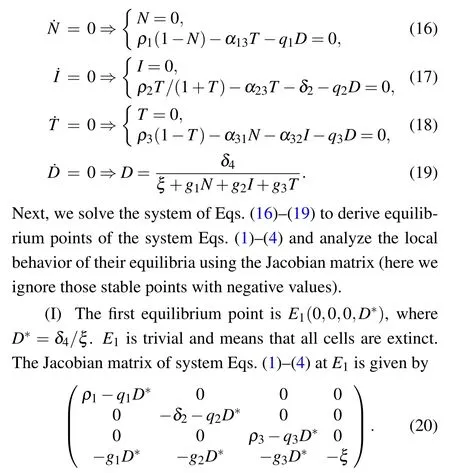
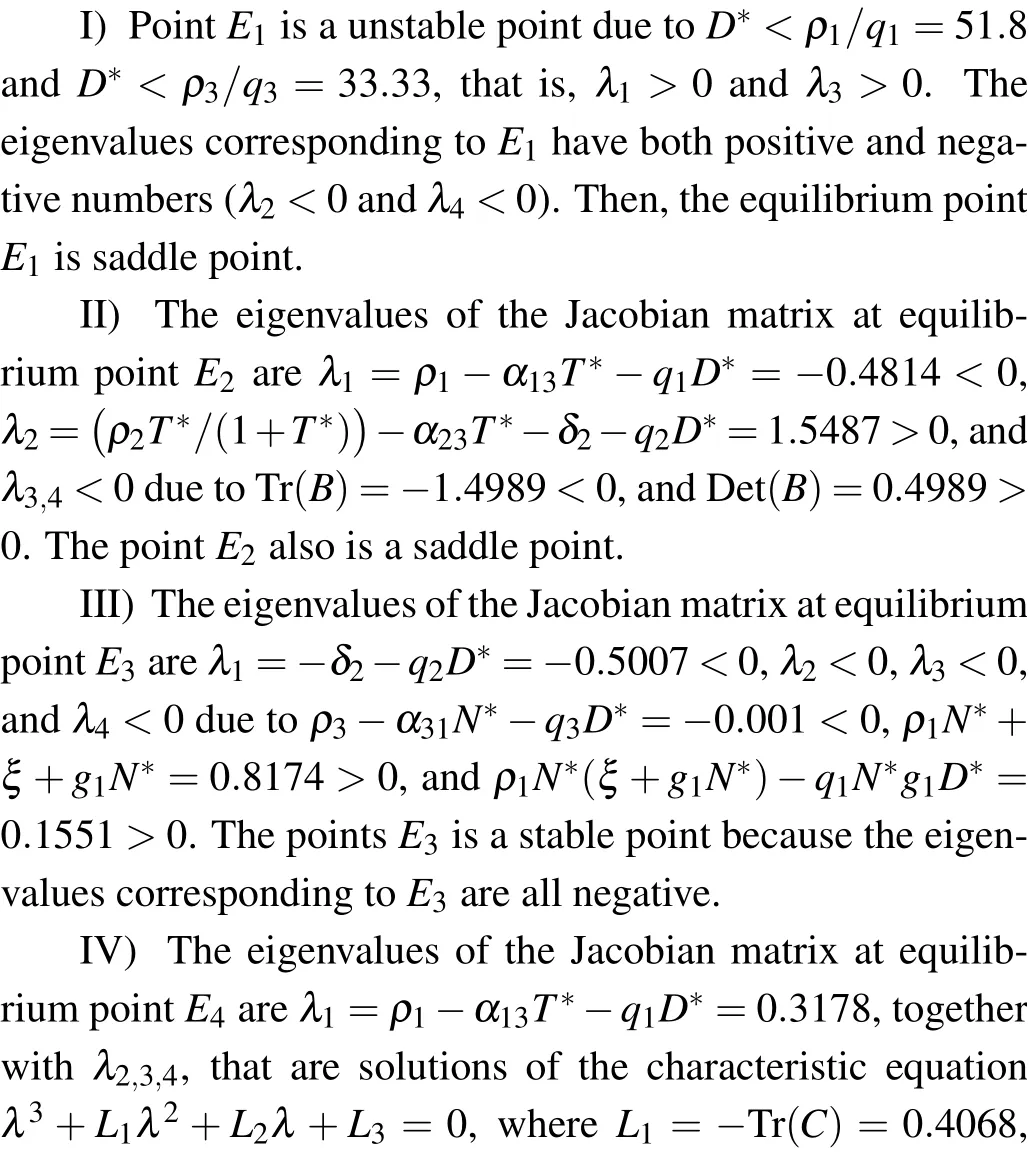
The eigenvalues of the Jacobian matrix at equilibrium point E1are
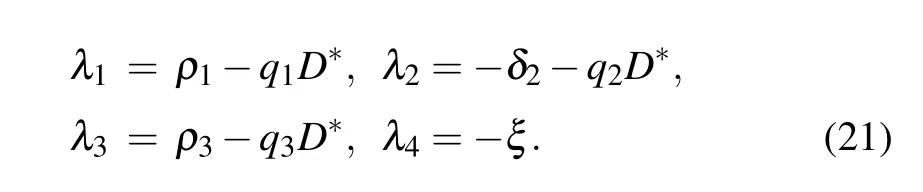
It is clear that λ2and λ4are negative. E1is stable if λ1<0 and λ3<0,i.e.,D*>ρ1/q1and D*>ρ3/q3.
(II) The second equilibrium point is obtained as E2=(0,0,T*,D*),where T*and D*satisfy the following equation:
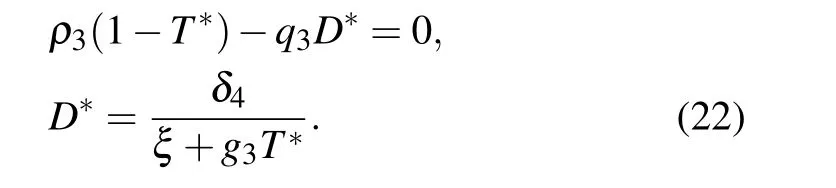
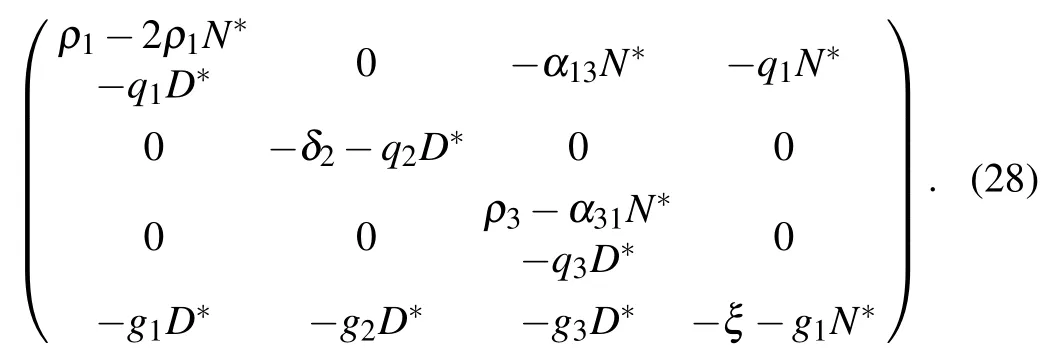
The equilibrium point E2corresponds to a site where only tumor cells are observed. The Jacobian matrix of system Eqs.(1)–(4)at E2is given by
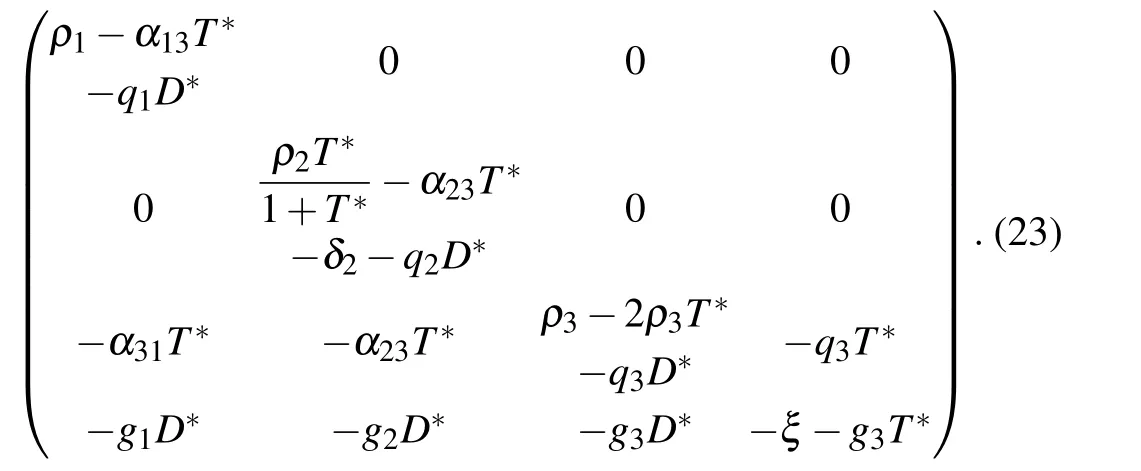
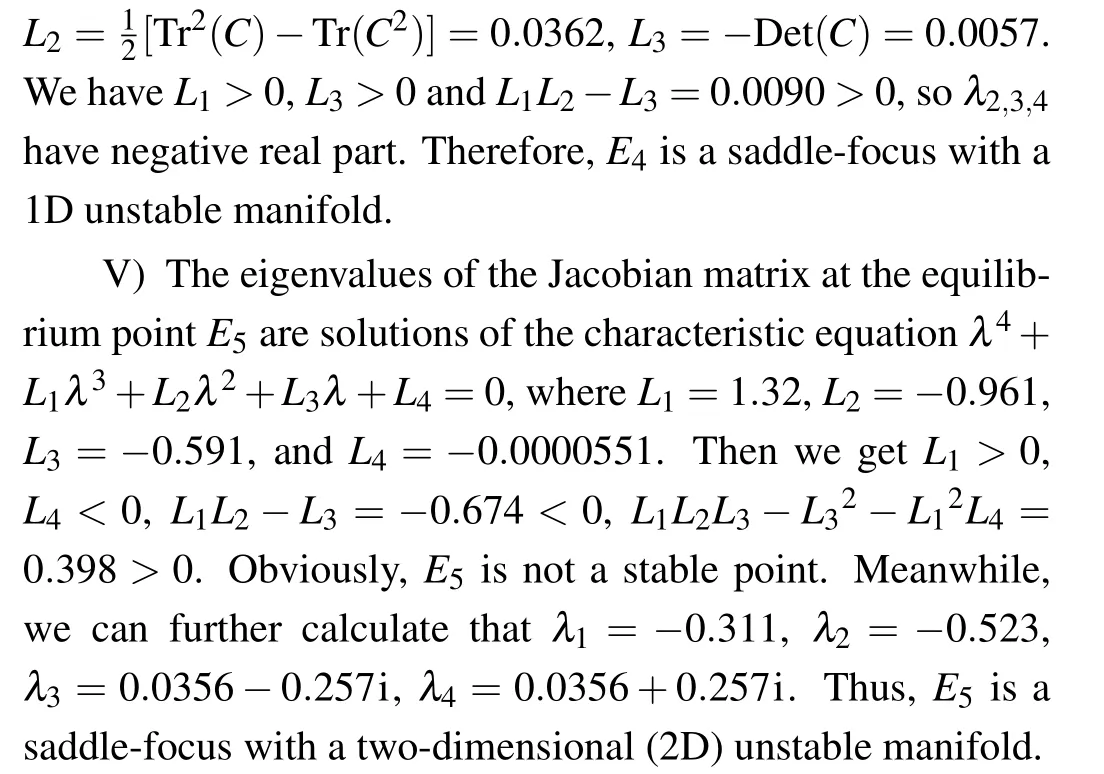
The eigenvalues of the Jacobian matrix at equilibrium point E2are

and λ3,4are solutions of the characteristic equation

where B is the Jacobian submatrix

E2is stable for ρ1−α13T*−q1D*<0,(ρ2T*/(1+T*))−α23T*−δ2−q2D*<0,Tr(B)<0,and Det(B)>0.
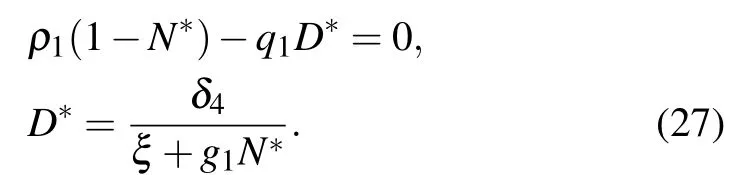
(III) The third equilibrium point of the system is E3(N*,0,0,D*), which means that the system is in healthy stage. N*and D*are the solutions of the following equation:
The Jacobian matrix at E2is
Therefore,eigenvalues of the characteristic equation are

E4corresponds to a site where tumor cells are at equilibrium with effector immune cells. Similarly,we can get the Jacobian matrix at E4
where
The eigenvalues of the Jacobian matrix at the equilibrium point E4are

together with λ2,3,4, which are solutions of the characteristic equation
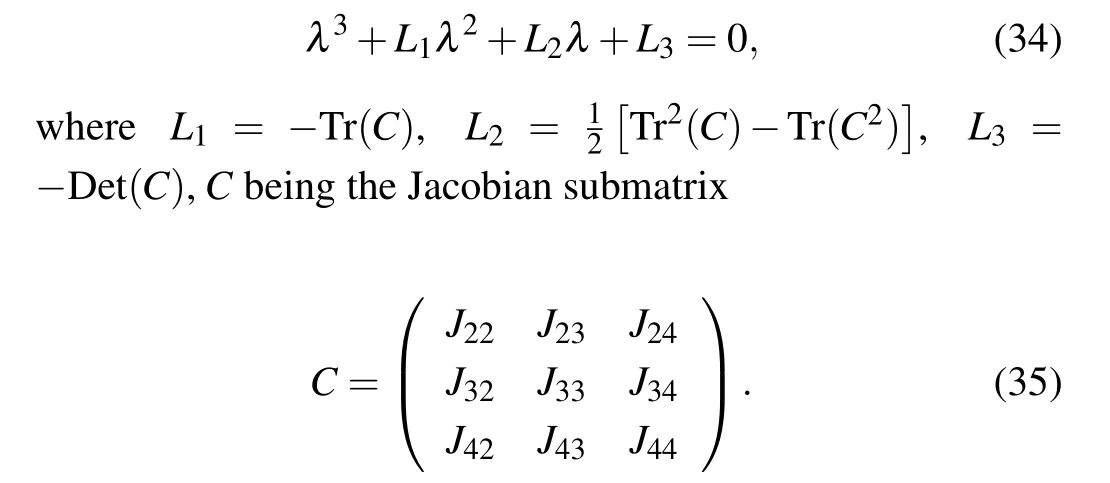
By the Routh–Hurwitz criterion,[32]the roots of Eq.(34)have negative real part if and only if

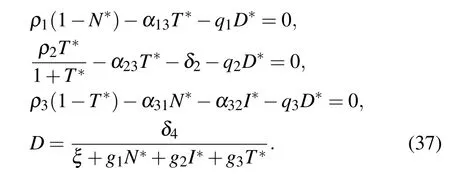
(V) The fifth equilibrium point is E5=(N*,I*,T*,D*),which corresponds to a site where host, immune, and tumor cells co-exist. N*,I*,T*,D*satisfy
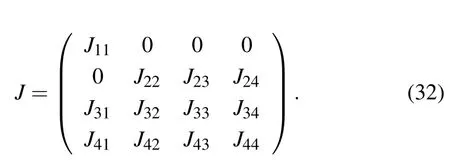
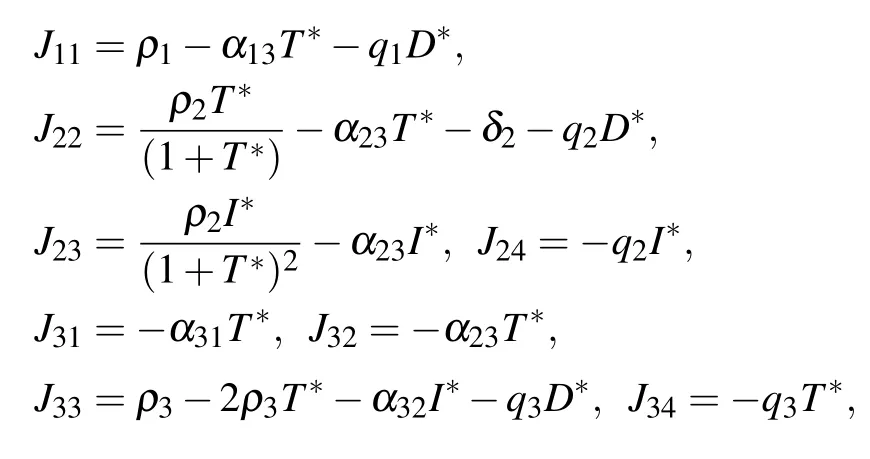
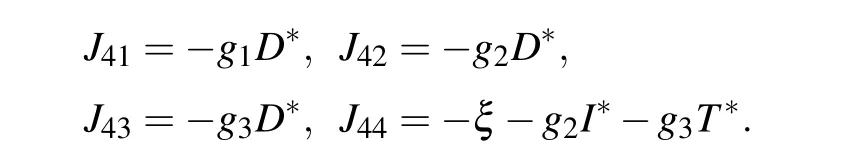
The stability analysis is performed using the Jacobian matrix
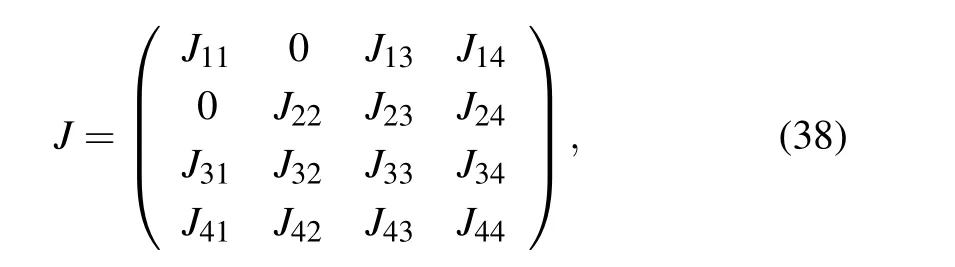
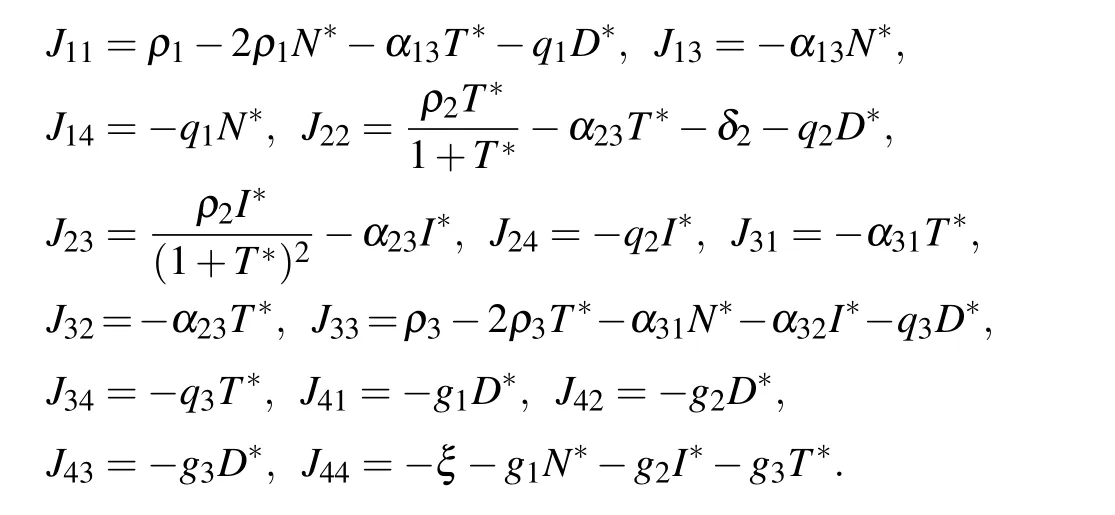
where
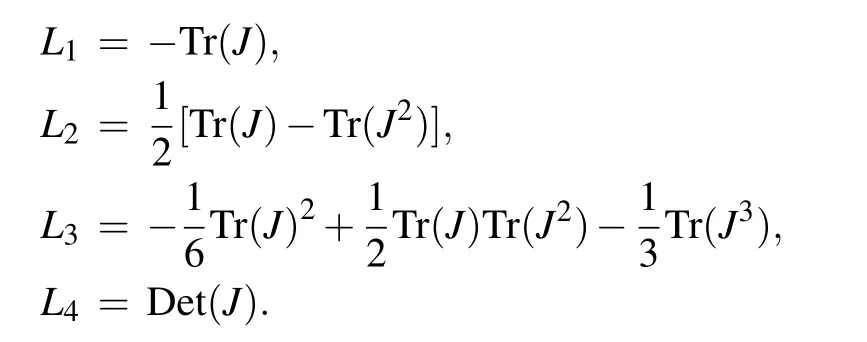
The eigenvalues of the Jacobian matrix at the equilibrium point E5are solutions of the characteristic equation
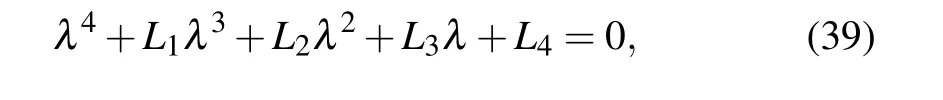
where
E5is a stable point if and only if
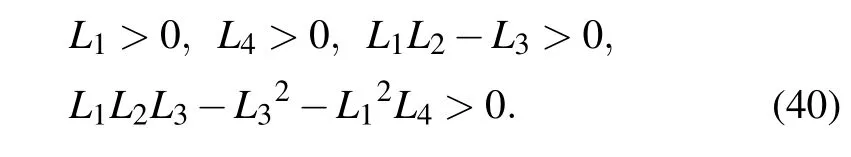
Table 1 presents the parameter default values that we consider in our model obtained from the literatures.
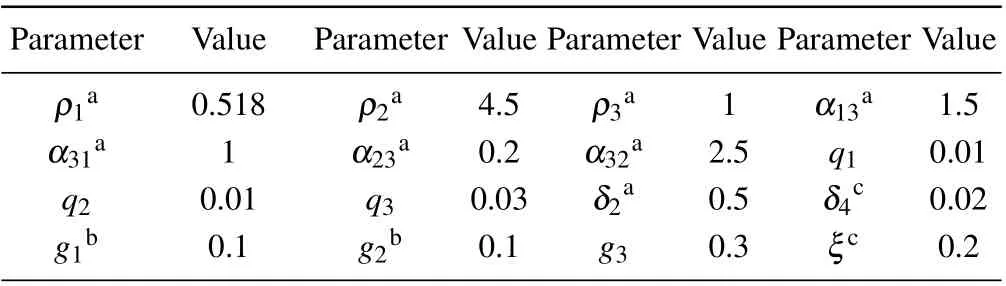
Table 1. Parameter values.
With these parameter values, the model has five equilibrium points with nonnegative coordinates,
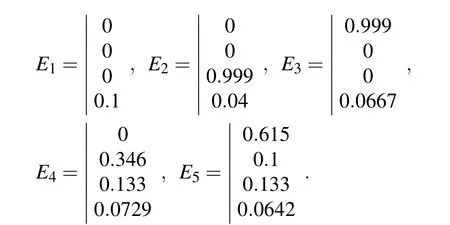
The instability of point E2indicates that a site cannot remain too long without normal cells. The stability of point E3confirm that it is possible to achieve a cure state (cancer cells are eradicated) with the selected parameter set but it is sensitive to the initial conditions (Fig. 1). When the initial conditions are (N0,I0,T0,D0)=(0.8,0.8,0.01,0), the system reaches a stable cure state. But when the initial conditions are(N0,I0,T0,D0)=(0.8,0.5,0.01,0),the system becomes unstable.E4is a saddle-focus with a one-dimensional(1D)unstable manifold and E5is a saddle-focus with a 2D unstable manifold. It means that the system may exhibits chaotic dynamics.
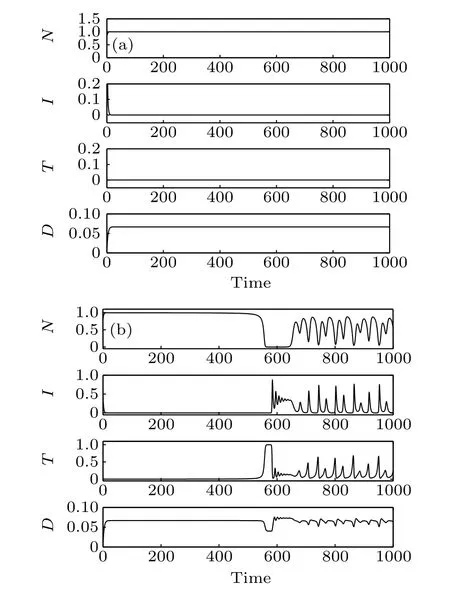
Fig. 1. Time responses of the system states, where N, I, and T are the numbers of normal cells, effector immune cells, and tumor cells, respectively. Parameter D is the concentration of the chemotherapeutic drug. (a) The initial conditions of the system are(N0,I0,T0,D0)=(0.8,0.8,0.01,0),(b)the initial conditions of the system are(N0,I0,T0,D0)=(0.8,0.5,0.01,0).
4. Chaotic dynamics
Many nonlinear dynamical systems found in nature exhibit routes to chaos[35,36]and some studies in the literature show that the cancer models also exhibit chaos.[22,37]In this section, we present computer simulation of the system to show that the system exhibits chaotic dynamics with the selected parameter set. The initial conditions are selected as(N0,I0,T0,D0)=(0.1,0.01,0.01,0).
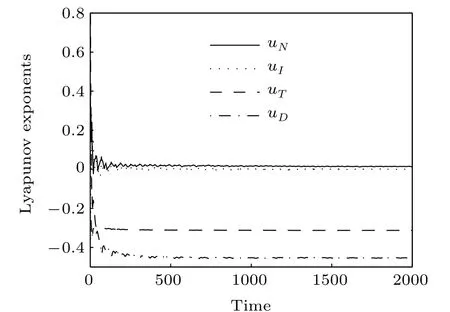
Fig.2. The Lyapunov exponents.
The Lyapunov exponent provides a qualitative and quantitative characterization of dynamic behavior and is related to the exponential divergence or convergence of nearby orbits in phase space. A system with one or more positive Lyapunov exponents is defined as chaos. The Lyapunov exponents of system Eqs.(1)–(4)are depicted in Fig.2 which are computed to be uN=0.013560,uI=−0.000513,uT=−0.312961,and uD=−0.453686. It is clear that uN>0,that is,the system to be chaotic. Since uN+uI>0,uN+uI+uT<0,the Lyapunov dimension is
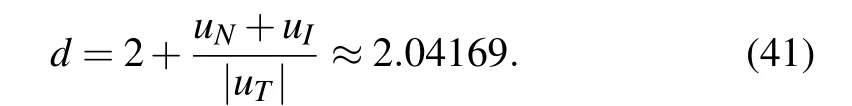
The fractal Lyapunov dimension further shows that the system exhibits chaotic dynamics(see a detailed discussion about Lyapunov exponent and Lyapunov dimension in Refs. [38,39]).
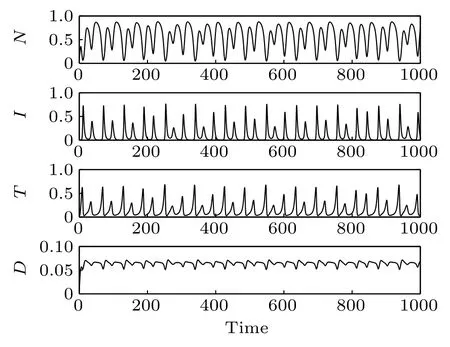
Fig.3. Time responses of the system states.
Time responses of the states N,I,T,and D are shown in Fig. 3. First, normal cells proliferate rapidly due to the high initial concentration. However,because of the competitive advantage, tumor cells start to proliferate quickly and followed by a decrease of normal cells. Subsequently,on the one hand,the population of effector immune cells increased rapidly,in reaction against the cancer progression. On the other hand,the infusion of the chemotherapeutic drug accelerates the decrease of tumor cells. However,the decrease of tumor cells is accompanied by the decrease of immune effector cells and the concentration of the chemotherapeutic drug. Thereby, all the populations start to oscillate. The projection of the attractor onto the 2D coordinate planes are shown in Figs.4 and 5. And the projection of the attractor onto the three-dimensional(3D)coordinate plane is illustrated in Fig.6.
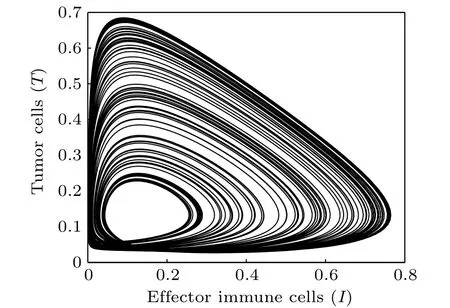
Fig.4. Projection of the attractor onto the I–T plane(δ4=0.02).
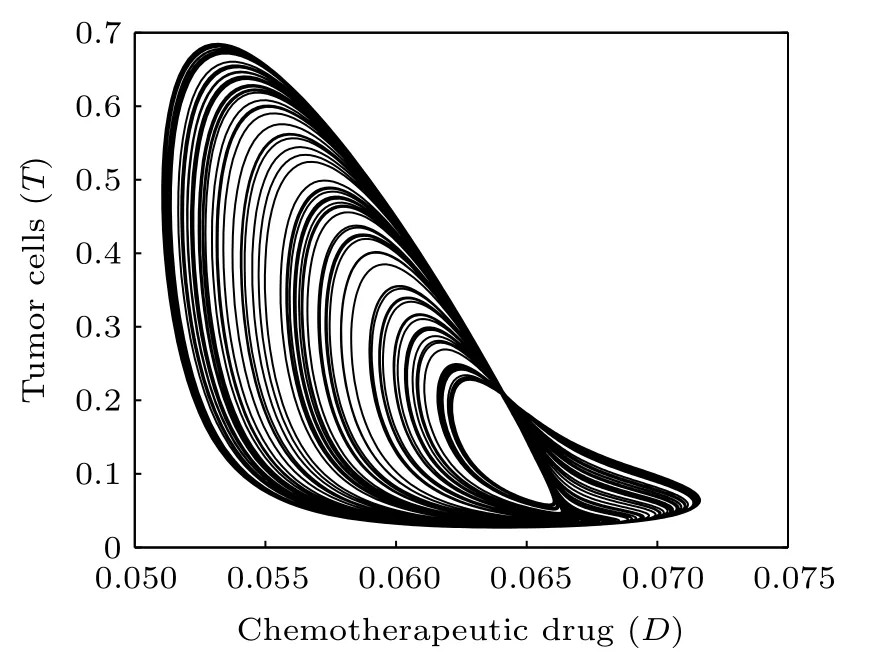
Fig.5. Projection of the attractor onto the D–T plane(δ4=0.02).

Fig.6. Projection of the attractor onto the 3D D–I–T plane, where N,I,and T are the numbers of normal cells,effector immune cells,and tumor cells,respectively. D is the concentration of the chemotherapeutic drug(δ4=0.02).
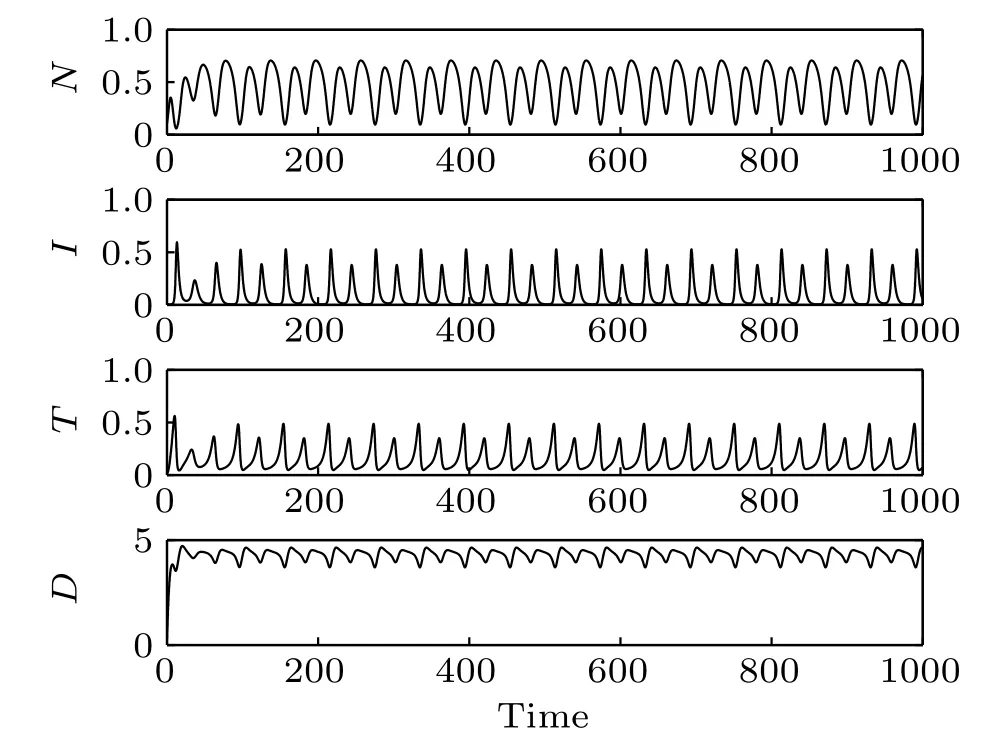
Fig.7. Time responses of the system states(δ4=0.13).
The effect of immunotherapy on tumor cell proliferation has been studied(see a detailed discussion in Ref.[7]). Here we focus on the effect of chemotherapy in the treatment of cancer tumors by immunotherapy. The infusion rate of the chemotherapeutic drug is chosen as δ4=0.13(Figs.7 and 8),δ4=2(Figs.9 and 10),and δ4=4(Figs.11 and 12),respectively. As δ4increases from 0.13 to 4, the transformation of the system from the period-2 state to period-1 state and then from the period-1 state to a stable state can be observed. It can also be seen from the time responses of the system states that with the increase of δ4followed by a decrease of tumor cells.
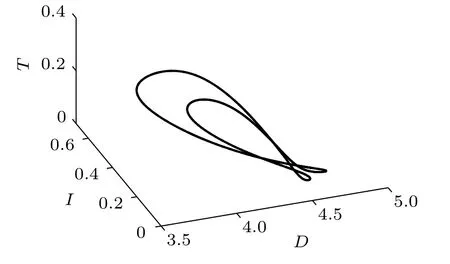
Fig.8. Projection of the attractor onto the D–I–T plane(δ4=0.13).
Bifurcation diagrams of tumor cells densities and normal cells densities in terms of the infusion rate of the chemotherapeutic drug(δ4)are computed(Figs.13 and 14). It is clearly that when the infusion rate of chemotherapy is low, the peak fluctuation range of tumor cell oscillation is larger than that of normal cells, but the fluctuation range of valley value is much smaller than that of normal cells. As the increasing of δ4,the chaotic dynamics gradually disappears,and the system reaches a stable state after experiencing period-doubling bifurcation and limit cycle oscillation. We also find an interesting phenomenon that chemotherapy-induced effector immune cells and normal cells damage seriously, which may cause treatment failure, is observed in Figs. 13 and 14 with highdose chemotherapy drug. When the system reaches a steady state,the density of tumor cells increases with the increase of chemotherapeutics, while the density of normal cells is negatively correlated with chemotherapeutics. This means that increasing the intensity of chemotherapy (by increasing the dose)is not necessarily the best way to improve treatment. In fact, increasing the intensity of chemotherapy can have side effects on host cells and immune cells,thereby weakening the barrier against tumor progression. Therefore,a set of effective and safe dose of combined chemotherapy and immunotherapy needs to be further determined.
It can be seen that high-dose chemotherapy drug can minimize the number of tumor cells,but it is difficult to eradicate them completely.
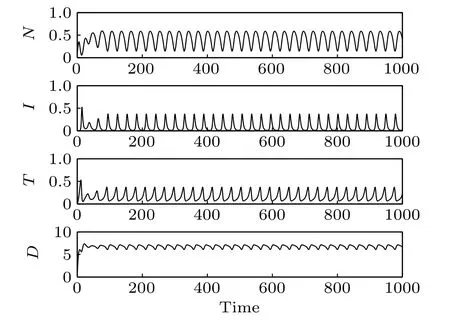
Fig.9. Time responses of the system states(δ4=2).

Fig.10. Projection of the attractor onto the D–I–T plane(δ4=2).
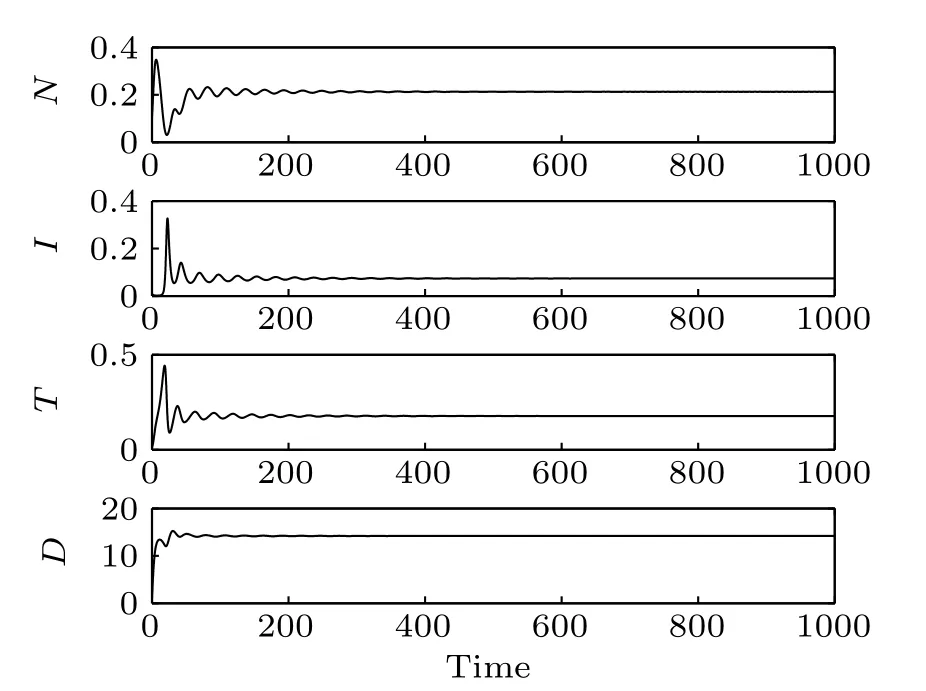
Fig.11. Time responses of the system states(δ4=4).

Fig.12. Projection of the attractor onto D–I–T plane(δ4=4).

Fig.13. Bifurcation diagram of tumor cells densities in terms of δ4.
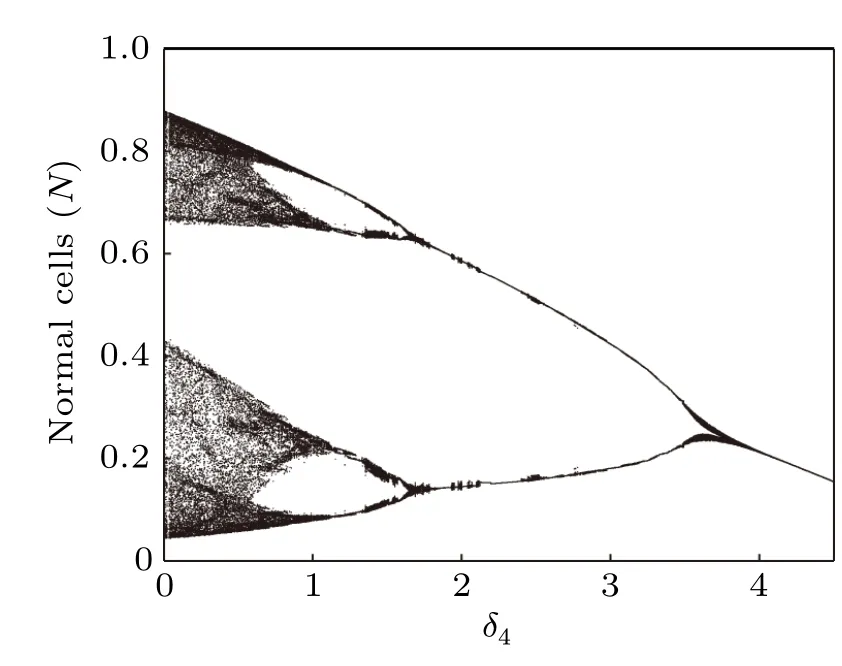
Fig.14. Bifurcation diagram of normal cells densities in terms of δ4.
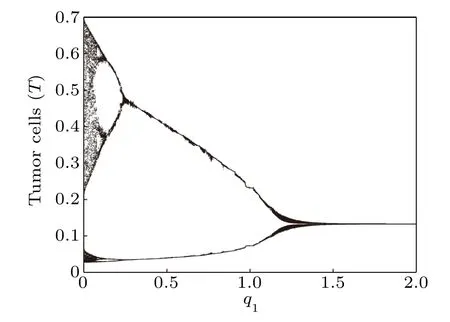
Fig.15. Bifurcation diagram of tumor cells densities in terms of q1.
Next,we compute the bifurcation diagrams of the q1and q2: coefficients of chemotherapeutic drug on normal cells and effector immune cells,respectively. Unlike δ4,when the system reaches a steady state,the number of normal cells gradually decreases with the increase of q1(Fig.16),but the number of tumor cells is almost unchanged(Fig.15). However, from Figs.17 and 18,we find that when the system reaches a steady state,the number of normal cells also gradually decreases with the increase of q2,but the number of tumor cells is positively correlated with q2. This means that the immune system has a much greater impact on tumor cells than normal cells compete with tumor cells.

Fig.16. Bifurcation diagram of normal cells densities in terms of q1.
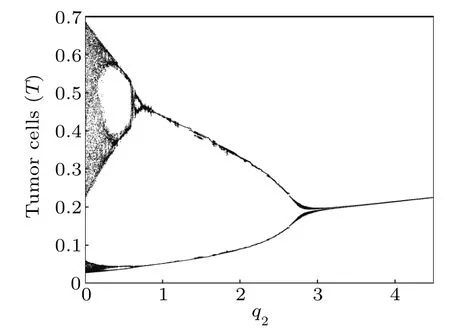
Fig.17. Bifurcation diagram of tumor cells densities in terms of q2.
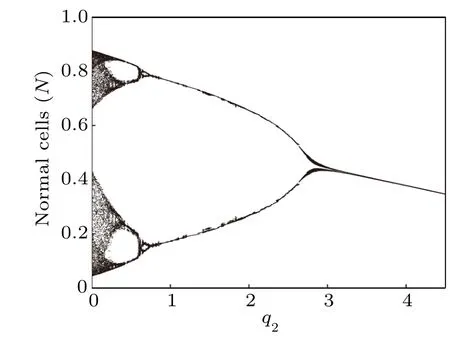
Fig.18. Bifurcation diagram of normal cells densities in terms of q2.
5. Conclusions
In this paper, we develop and analyze a mathematical model on tumor growth using mixed immunotherapy and chemotherapy, which inspired by population dynamic. Three competing cell populations (normal cells, effector immune cells,tumor cells)and chemotherapeutic drug have been considered in our model. We analyze the existence and stability of the equilibrium points and show that the model exhibits chaotic dynamics, that is, the nonlinear growth observed in cancer cell culture. Moreover, we confirm the chaotic dynamics by computing the Lyapunov exponents and the Lyapunov dimension which is obtained to be fractal. The phase diagrams show that there exists a chaotic attractor in the system. This model produces a large number of tumor cell oscillations,which corresponds to the rapid growth of cancer,and reproduces some clinical evidence well.[39–41]
Bifurcation diagrams of tumor cells densities and normal cells densities in terms of the infusion rate of the chemotherapeutic drug (δ4) have shown the effect of chemotherapy in chaotic dynamics. As the increase of the infusion rate of the chemotherapeutic drug(δ4), the transformation of the system from chaotic state to period-doubling state, from the perioddoubling state to period-1 state and then from the period-1 state to a stable state can be observed. This means that appropriate chemotherapy can reduce the proliferation rate of tumor cells and effectively control the growth of tumor. However,under the action of high-dose drug may lead to treatment failure. The bifurcation analysis of q1and q2shows that the main reason for the failure may be severe damage to the immune system.
Because of the abnormal development of cells division and replication, the original regular protein replication produces chaotic motion under the action of external stimuli,leading to the occurrence of tumors. Some studies have provided evidence that tumor growth is a complex chaotic system.[42–44]This chaotic phenomenon corresponds to the rapid and uncontrolled growth of tumors observed in the clinic.The essence of chaos is dependence on initial conditions,which is a nonlinear problem. Our analysis is based on the study of the stability of equilibrium points and providing a parameter set with chaotic attractors. In the current treatment of tumors, chemotherapy and immunotherapy are used to control the chaotic by taking advantage of the extreme sensitivity of chaos to initial conditions. Our results show that immunotherapy and chemotherapy are only adjustments and suppressions of this chaos, so it is difficult to achieve a complete cure state. For this reason, a new direction is proposed for tumor treatment, that is,to fundamentally destroy the condition of chaotic production of protein molecules,and it is possible to truly cure tumors.
猜你喜欢
杂志排行
Chinese Physics B的其它文章
- Corrosion behavior of high-level waste container materials Ti and Ti–Pd alloy under long-term gamma irradiation in Beishan groundwater*
- Degradation of β-Ga2O3 Schottky barrier diode under swift heavy ion irradiation*
- Influence of temperature and alloying elements on the threshold displacement energies in concentrated Ni–Fe–Cr alloys*
- Cathodic shift of onset potential on TiO2 nanorod arrays with significantly enhanced visible light photoactivity via nitrogen/cobalt co-implantation*
- Review on ionization and quenching mechanisms of Trichel pulse*
- Thermally induced band hybridization in bilayer-bilayer MoS2/WS2 heterostructure∗