Resistance fluctuations in superconducting single crystals studied by low-frequency noise spectroscopy∗
2021-05-06HaiZi子海YuanYao姚湲MingChongHe何明冲DiKe可迪HongXingZhan詹红星YuQingZhao赵宇清HaiHuWen闻海虎andCongRen任聪
Hai Zi(子海), Yuan Yao(姚湲), Ming-Chong He(何明冲), Di Ke(可迪), Hong-Xing Zhan(詹红星),Yu-Qing Zhao(赵宇清), Hai-Hu Wen(闻海虎), and Cong Ren(任聪),‡
1Physics Department,School of Physics and Astronomy,Yunnan University,Kunming 50500,China
2Beijing National Laboratory for Condensed Matter Physics,Institute of Physics,Chinese Academy of Science,Beijing 100190,China
3Physics Department,Nanjing University,Nanjing 210093,China
Keywords: KxFe2−ySe2,phase separation,noise and chaos,percolation
1. Introduction
Correlated electron systems have been an important research area in condensed matter physics. In these materials,the competition or/and coexistence of correlated states, such as metallic,insulating,magnetic,and superconducting phases,quite often occurs, leading to a rich phase diagram with unconventional ordering phenomena. In many cases this results in an intrinsic tendency to electronic phase separation.[1–4]For oxide-based materials, nanoscale inhomogeneous electronic states include dopant-driven spin or/and charge density stripes or spatial variations of the superconducting gap in high-Tccuprates,[5–8]or the mixed-valence phase separations in manganese oxides.[9,10]Respectively, these effects together with associated percolation phenomena are essential ingredient for the understanding of the unconventional superconductivity or the unusually colossal magnetoresistance.[11–13]
Resistance fluctuations are sensitive to the degree of the phase orders of the systems under investigation,and the fluctuation spectroscopy has been used as a powerful method to investigate the intrinsic dynamics of carriers of a large variety of magnetic,semiconducting,and metallic/superconducting materials, in particular, systems close to a metal–insulator transition (MIT) or the percolation limit. In this work we provide experimental insight to the effect of iron-vacancy order on the transport properties by probing low-frequency resistance fluctuations in superconducting KxFe2−ySe2single crystals. Our result reveals the percolative nature of both normal state and superconducting transition regimes for such AFM insulator/superconductor mixed compound.
2. Experiment
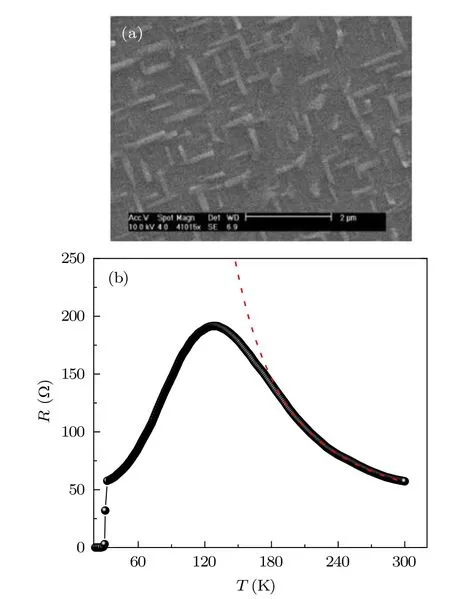
Fig.1.(a)Back-scattered electron images of SEM measurements on the cleaved surface of a K0.76Fe1.71Se2 crystal(SMP#1). (b)Temperature dependence of the resistance of SMP#1. The dotted red curve is the fit to the R–T data in high-T regime,yielding a thermally activated energy gap of 38 meV,see text.
Single crystals of KxFe2−ySe2were grown with the Bridgman technique following a quenching process. By this quenching process, the resulting crystals contain different iron-vacancy domain structures which depends on the quenching temperatures, although they have the same stoichiometry(as determined by an inductively coupled plasma)and the superconducting phase 17%–20%in volume,as described in detail in Ref.[32]. We choose crystal K0.76Fe1.71Se2which was quenched at 473 K as SMP#1 for our study. The sample is highly inhomogeneous in chemical stiochiometry on a submicron length scale. It seems that the minority phase, identified as a conducting component, is in an ordered state in orientation in the matrix of the majority phase, as shown by the back-scattered electron images of SEM measurements in Fig.1(a). Figure 1(b)shows the temperature T dependence of the resistance(resistivity)R of K0.76Fe1.71Se2in the whole T region. A pronounced hump in R following an insulator-tometal transition (MIT) occurs at T =120 K with an activation energy of Eg=38 meV,similar to previous report.[17,18]The MIT is rather broad due to the underlying inhomogeneity of the coexistence region. Upon further cooling, the sample undergoes a superconducting transition at the onset temperature of 31.4 K within ∆Tc= 2.7 K between the Ts of the onset and zero-R. The residual resistance(resistivity)is quite high (400 mΩ·cm) comparing with those of other iron-based superconductors.[33]
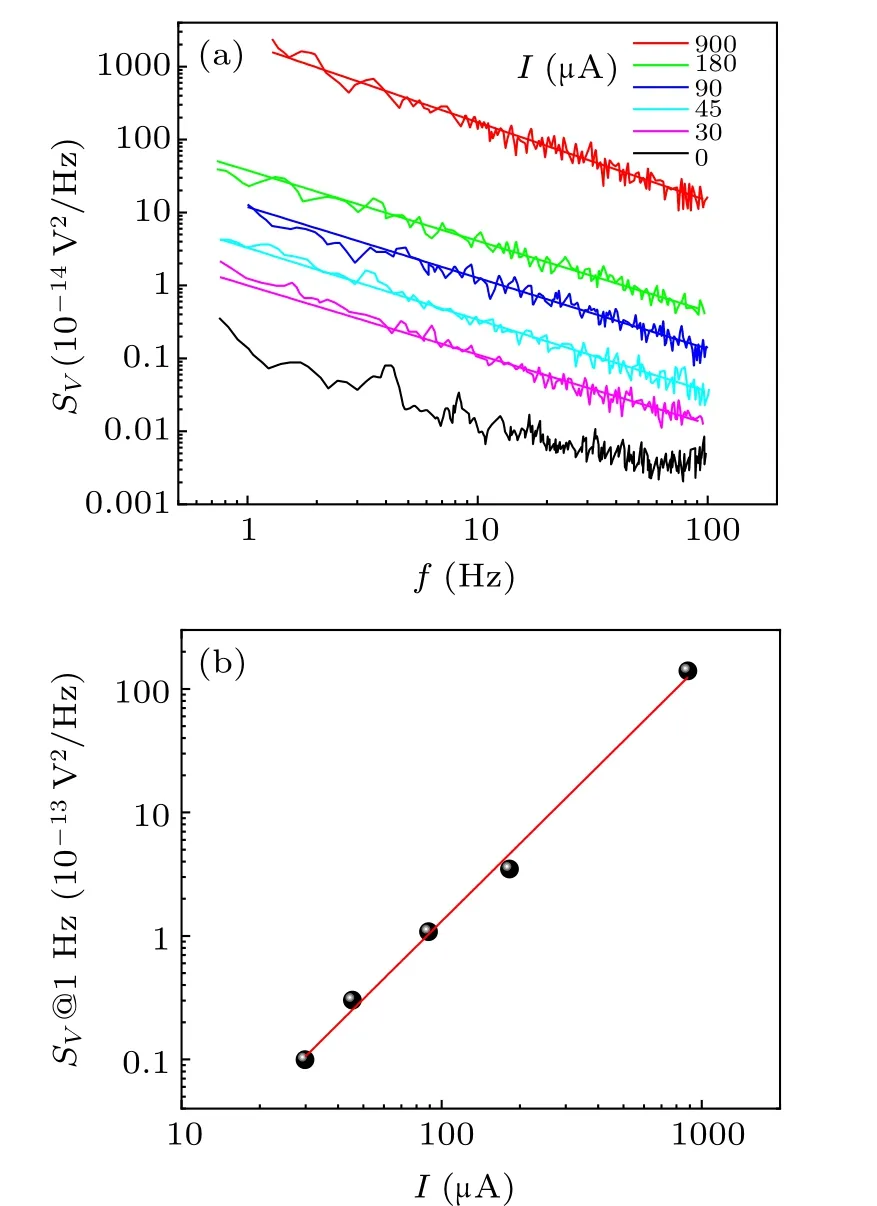
Fig.2. (a)Typical voltage noise spectrum at various sense current I and T =40 K for SMP#1. The colored solid lines are the fits to the data in log–log plot to display the nature of the low frequency 1/fα-type noise. (b)Voltage noise spectrum SV at f =1 Hz as a function of sense current I. The red solid line is the log–log linear fitting to display the relationship of SV ∝I2.
To measure the resistance noise,the crystals were cleaved and peeled using scotch tape into a dimension of 1.5×0.5×0.01 mm3with the thinnest side along c-axis.The electric contacts were made quickly using silver paste wiring gold wires(16 µm in diameter). Noise and voltage measurements were performed simultaneously by the standard four-probe method on a Quantum Design physical property measurement system with temperature stability of 0.01%. The sense current was provided by a 9-V battery and a series of metal-film resistors with resistance a factor of 500–1000 higher than the sample resistance. The voltage V across the sample was fed into a battery-powered low-noise preamplifier (SR560) with a gain of 100, and the amplified output was processed using a dynamic signal analyzer(HP35660A)to obtain the voltage power spectral density(PSD).In all cases,a zero-current background spectrum was subtracted to obtain the voltage power spectral density SV(f,T), the portion of S(f,T) due to fluctuations in resistance. As shown in Fig.2(a), SV(f,T)shows a typical 1/fα-like noise spectrum in low frequency with α close to unit below 100 Hz in the sense currents. The noise magnitude at f =1 Hz strictly follows a quadratic law of SV(I,f =1 Hz)∝I2checked at several Ts, as shown in Fig.2(b). This current-dependent noise is an experimentally important result as it confirms that the noise obtained is intrinsic to the samples under investigation.
3. Results and discussion
Figure 3 shows the main results of the voltage (resistance) fluctuations in SMP#1. The typical raw data of voltage spectral density SVof generic 1/fα-type at selected Ts are shown in Fig.3(a)in the frequency domain of 0.625 Hz< f <100 Hz. By log–log fitting as shown in Fig.3(a)together with the simultaneously measured V, two parameters, the normalized resistance noise SR/R2≡SV/V2at 1 Hz and the exponent α, are extracted as a function of T, and the results presented in Figs.3(b)and 3(c),respectively. It is found that the normalized resistance noise power SR/R2peaks at Tp≈100 K,about 20 K below the corresponding resistance hump (∼122 K).Based on a generalized activation fluctuation model originally proposed by Dutta,Dimon,and Horn(DDH),the 1/fαnoise spectrum is simply deduced from an integration of the Lorenzian spectra over the distribution of the activation energies for more and less conductive phases.[34]The α exponent of the 1/fαspectral density and the temperature dependence of the noise are related by[34–36]
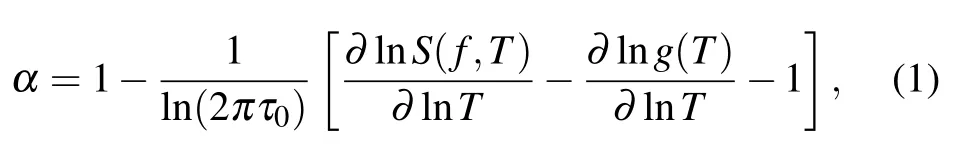


with kBthe Boltzmann constant. This means,in our case,that the 1/fαnoise we measure between 0.1 Hz and 100 Hz and 40 K and 300 K arises from the transition energies between 0.09 eV and 0.6 eV, indicating a highly inhomogeneous energy distribution configuration.

Fig.3. (a)Typical voltage noise spectrum at various Ts for SMP#1. The colored solid lines are the fits to the data in log–log plot to display the nature of the low frequency 1/fα-type noise. (b)Normalized resistance noise SR/R2 at 1 Hz and resistance R as functions of T. (c) The corresponding frequency exponent of the 1/fα noise as a function of temperature, α(T).Circles are the values extracted from the fits to the individual spectra at different temperatures, as in (a). The red solid line is the best fit to the α(T)data from the data of SV(f =1 Hz,T),see text.
A feature in SR/R2of the present samples is that in the superconducting transition region, as illustrated in Fig.3(b),the magnitude of the resistance noise shows a narrow plateau at Tonset,then a substantial rise follows with decreasing T. We have measured 4 crystals from the same patch, the noise behaviors are almost identical. The steep rise in SR/R2at Tonsethas also been observed for granular superconductors,[37]high-Tc-cuprates,[38,39]and organic superconductors,[40]and is interpreted as a result of the percolative nature of the superconducting transition in these systems. In general, for homogeneous superconducting transitions, one expects small fluctuations in the resistance with T decrease, since more quasiparticles condense into cooper pairs leading to a less noisy volume in bulk. In contrast,for inhomogeneous superconductors,large fluctuations in the resistance in the transition regime are expected, because in strongly disordered conductors, the resistance fluctuations are determined not by the entire volume of the conductor but by an essentially smaller volume,leading to a large noise level.[41,42]In other words, strongly disordered superconductors exhibit an extremely enhanced resistance noise due to the strongly nonuniform critical current density and electric field distribution confined to narrow paths,forming a normal metal(insulator)-superconductor Josephson junction-like network. To substantiate this percolative picture for the present samples,we study the nature of the resistance fluctuations in more details in the critical superconducting transition regime. The percolation theory has an important application for the real disordered systems that the relative resistance noise SR/R2scales with resistance by a power-law as[39,42]

where lrsis the resistor–superconductor network scaling exponent which is related to the index of percolative conduction path. In our case of SMP#1, such scaling law expressed in Eq.(2)is illustrated in Fig.4 as we tune R through changing T. In Fig.4, SR/R2scales with R excellently with lrs∼=1.38±0.06 in T-domain as R drops to 20%of the normalstate resistance,details in T-domain are shown in the inset of Fig.4.

Fig.4. Scaling of the normalized resistance noise SR/R2 versus the resistance R of SMP#1. The red solid line is the log–log fitting line based on Eq.(2). Inset: normalized resistance noise SR/R2 at f =1 Hz(red solid dots)and resistance R(black solid dots)as functions of T in the vicinity to the superconducting fluctuation region.
For a comparison, we have performed isothermal resistance noise measurements under magnetic field in percolative regime (Fig.5(a)). The results are shown in the inset of Fig.5(b)with T =29.6 K.By applying H to tune R from the normal-state at H = 6.5 T to the superconducting transition regime of H =0, the corresponding resistance noise level increases by more than one order of magnitude from H=2 T to H =0,as expected according to the percolation theory. Similarly,SR/R2scales with R rather well with lrs∼=1.48±0.04,as shown in Fig.5(b). Considering that random magnetic flux motion in a superconducting cluster is one of the sources of resistance noise when H is applied, the two scaling exponents lrsin T-domain and H-domain are highly self-consistent.In the existing percolation models accounting for the resistance noise behavior,Kiss et al. predicted that at a given current the number of Josephson junctions in the superconductive state fluctuates. It is equivalent to fluctuations δ p(t) of the portion p of short-circuited resistors for a normal–metal–superconductor mixture. Taking account of the fluctuations in p, the noise exponent lrs∼=2.74 differs from lrs∼=0.9±0.32 of the“classical”three-dimensional(3D)random percolation model in which the noise is generated only by fluctuations of the non-short-circuited normal resistors.[43]However, our result of lrs∼=1.4 in K0.76Fe1.71Se2is quite different from those of the p-fluctuation or classical 3D random percolation models. From microstructure point of view, we suggest that the new noise exponent in K0.76Fe1.71Se2is correlated to the formation of an orientation-ordered rather than random minor superconducting phase 122 in the matrix of the AFM insulating phase 245.

Fig.5. (a)Typical voltage noise spectrum under various magnetic field H and T =29.6 K for SMP#1. The colored solid lines are the fits to the data in log–log plot to display the nature of the low frequency 1/fαtype noise.(b)Normalized resistance noise spectrum SR/R2 at f =1 Hz as a function of the resistance R in the vicinity to the superconducting fluctuation region.The red solid line is the scaling line based on Eq.(2).Inset: normalized resistance noise SR/R2 at f =1 Hz (red solid dots)and resistance R (black solid dots) as functions of T in the vicinity to the superconducting fluctuation region(T =29.6 K).

Fig.6.(a)The T-dependence of resistance of SMP#2(K0.76Fe1.70Se2).Inset: typical SEM images of the microstructure of SMP#2. (b)Normalized resistance noise SR/R2 at f =1 Hz as a function of T for SMP#2. Arrows indicate the onset of the superconductive transition in R at low-T and a peak in normalized resistance noise at high-T.
To verify the effect of microstructure of iron vacancy order on the percolative process in KxFe2−ySe2, we measured the resistance noise of another superconducting K0.76Fe1.70Se2(SMP#2)crystal.It is noted that this crystal has the same material composition with SMP#1 but with a different quench temperature of 673 K (above the AFM ordering temperature∼550 K,leading to a different iron vacancy-order state(inset of Fig.6(a)).[32]From a comparison in Fig.6,the effect of the iron vacancies on both normal and superconducting states can be seen clearly by a higher T of 210 K for resistance hump,one order of magnitude lower residue resistivity,an enhanced Tonsetof 32.4 K,and a narrower transition region ∆Tc=0.9 K[Fig.6(b)]. These results imply a larger metallic phase in SMP#2. Correspondingly, the magnitude of the resistance noise shown in Fig.6(b) is reduced comparing with that of SMP#1 by a factor of 2–5 at high Ts. It is interesting to note a similar peak in SR/R2at T ≈100 K,indicating a characteristic energy distribution for the insulator–metal crossover with that of SMP#1. However, in the superconducting transition region the level of SR/R2is greatly suppressed by an order of magnitude with decreasing T, in strong contrast to the case of SMP#1. In phase separation scenario, this strongly suppressed resistance noise indicates the improvement of the Josephson tunnel-junction network,suggesting a possible occurrence of geometrical phase transition for conduction channels,similar to the case of granular superconductors.[43]
4. Summary
We performed low frequency resistance fluctuation spectroscopy measurement on several superconducting KxFe2−ySe2single crystals. A resistance noise peak is observed corresponding to the well-observed resistance hump.Based on a generalized DDH model the resistance noise peak together with the resistance hump is interpreted as insulator–metal transition with a characteristic transition energy about 0.1–0.6 eV. We find evidence of a Josephson junction-like network in the superconducting transition region, and the resistance noise power scales with resistance R excellently as SR/R2∝R−lrswith the noise exponent lrs≈1.4. With improved microstructure of iron vacancy order to enhance the superconductivity of KxFe2−ySe2crystals,the resistance fluctuations are greatly suppressed due to the establishment of a much effective conduction/superconducting network.
猜你喜欢
杂志排行

Chinese Physics B的其它文章
- Speeding up generation of photon Fock state in a superconducting circuit via counterdiabatic driving∗
- Micro-scale photon source in a hybrid cQED system∗
- Quantum plasmon enhanced nonlinear wave mixing in graphene nanoflakes∗
- Restricted Boltzmann machine: Recent advances and mean-field theory*
- Nodal superconducting gap in LiFeP revealed by NMR:Contrast with LiFeAs*
- Origin of itinerant ferromagnetism in two-dimensional Fe3GeTe2∗