Analysis of bicyclist-vehicle crashat intersection area considering behavior prior to crash:A random parameter ordinal probit approach
2021-04-24YuanFangYangZhen
Yuan Fang Yang Zhen
(Key Laboratory of Road and Traffic Engineering of Ministry of Education, Tongji University, Shanghai 201804, China)
Abstract:In order to analyze the risky factors that affect vehicle-cyclist crash injury severity at the intersection area, especially the factors relating to the road users’ behaviors, an empirical study was conducted by collecting accident records from 2011 to 2015 from the General Estimates System. After preliminary screening, the variables were classified into 5 main categories including cyclists’ characteristic and behavior, drivers’ characteristic and behavior, vehicle characteristic, intersection condition, and time. The random parameter ordinal probit (RPOP) was used to study the significant influencing factors and corresponding heterogeneity. The results show that failing to obey traffic signals, failing to yield to right-of-way, dash and drinking before cycling can increase the injury severity for cyclists, and the corresponding fatal injury likelihoods increase by 53.2%, 40.0%, 86.3%, and 211.5%, respectively. Moreover, drivers’ inattention, speeding, going straight and left turning increase the risk of crashing for cyclists. The corresponding fatal injury likelihoods increase by 134.5%, 186.5%, 69.3%, and 22.7%, respectively. Other indicators such as age, gender, vehicle type, traffic signal and intersection type can also affect injury severity.
Key words:traffic safety; injury severity; cyclist crash; intersection; random parameter ordinal probit (RPOP)
In recent years, the governments in the North American area have been actively devoted to increasing investment in bicycle facilities to encourage bicycling[1-2]. But quite a few researchers regard cycling as dangerous mode of transportation[3-4]. According to the reports from the National Highway Traffic Safety Administration(NHTSA)[5-7], the number of cyclists killed in cyclist-motor vehicle crashes have increased from 729(2014) to 857(2018) during the past years. The problem of cycling safety in the U.S. seems to become more and more serious. At least there’s no downward trend in deaths.
An intersection is one of the most complex parts in a transportation system[8-9]. Bicycling through intersections may significantly increase the risk of traffic accidents[10]. Many studies have confirmed the factors which affect the frequency and injury severity of cyclist related crashes at intersections. Most of them focused on inherent characteristics of the environment (e.g. green space, light condition, etc.), road (e.g. number of cycle lanes, intersection type, etc.) and road users (e.g. age, gender, race, etc.)[11-15]. A few took cyclists and vehicles’ movements (e.g. turning direction, riding with/against traffic, etc.) into account[14,16]. Wang et al.[15]and Rodgers[17]pointed out that the risks for cyclists aged 18 to 24 and over age 64 were significantly higher than those aged 25 to 65. In terms of gender, women seemed to be more likely to be hit by vehicles than men[18]. Volume is another important influencing factor. Strauss et al.[8]pointed out that a 1.0% increase in bicycle flows would result in a 0.87% increase in the number of injuries. For movement, wrong-way bicycling is dangerous for all bicyclists[14]. Regarding lighting, street lighting can decrease the severity of injury[12]. Roundabouts improved motor vehicle safety, but a similar safety effect was not found for bicycles[19]. Crash risk may greatly increase when people cycle around roundabouts[20].
Actually, drivers’ and cyclists’ behaviors prior to crashes are the most direct cause of accidents. But as far as it is concerned, there are few studies in this area. The objective of this study is to analyze the risk factors of cyclists’ injury severity in intersection-related cyclist-vehicle crashes. But in a departure from previous studies, cyclists’ and drivers’ behaviors are taken into account. The data source are accident records from 5 years (2011—2015) from the General Estimates System (GES). The random parameter ordinal probit (RPOP) is adopted to identify the significant factors and corresponding random effects.
1 Materials and Methods
1.1 Data source and variable processing
The datasets of crash records from GES are used for analyzing cyclist-related crash. Data for GES comes from nationally representative samples of police reported motor vehicle crashes of all types[21]. These accident reports are chosen weekly from approximately 400 police jurisdictions in 60 areas across the U.S. Approximately 90 data elements are coded into a common format[21].
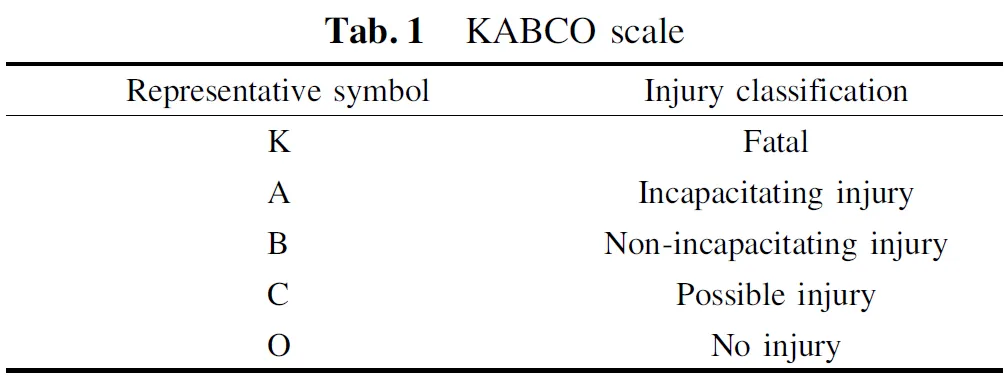
The records for cyclist crash occurring at intersections from 2011 to 2015 are filtered out. The final dataset includes 6 383 observations. The injury severity in the dataset is described by the KABCO scale, shown in Tab.1. This scale was developed by the National Safety Council (NSC) and is frequently used by law enforcement for classifying injuries[22].
There are few observations for some injury level. So the injury severity indicators are regrouped, as shown in Tab.2.
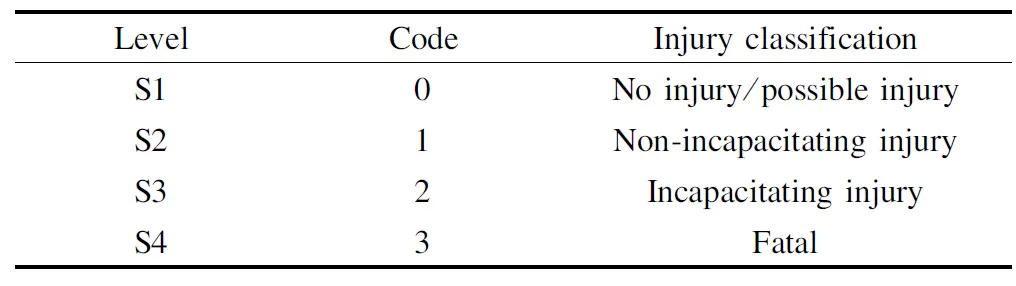
Tab.2 Injury level and code
The room was only 13 square meters with two nails on the wall next to the door, one for her to hang her bag and the other for hanging umbrellas. At that time, she threw all her stuff such as her bag and umbrella on the floor once she entered the room, staring at the whole mess and feeling terribly upset.
1.2 Methodology
Random parameter discrete choices models which accommodate unobserved heterogeneity across observations by adding a random effect to the parameters of the utility function are widely used to analyze accident severity[23]. In this study, the RPOP is adopted to investigate the influencing factors for injury severity.
23.To take the air along the river-side: To air in this instance means to expose to cool or cold air so as to cool or freshen (WordNet). In other words, the king and his daughter are going for a ride to enjoy the fresh air, a soothing activity especially before the modern era of good ventilation and frequent bathing.Return to place in story.
There are 4 levels of injury severity. The utility function of injury severity for thei-th cyclist can be expressed as
(1)
Pr(Yi=0)=Pr(Zi+εi<δ1)=Φ(δ1-Zi)
(2)
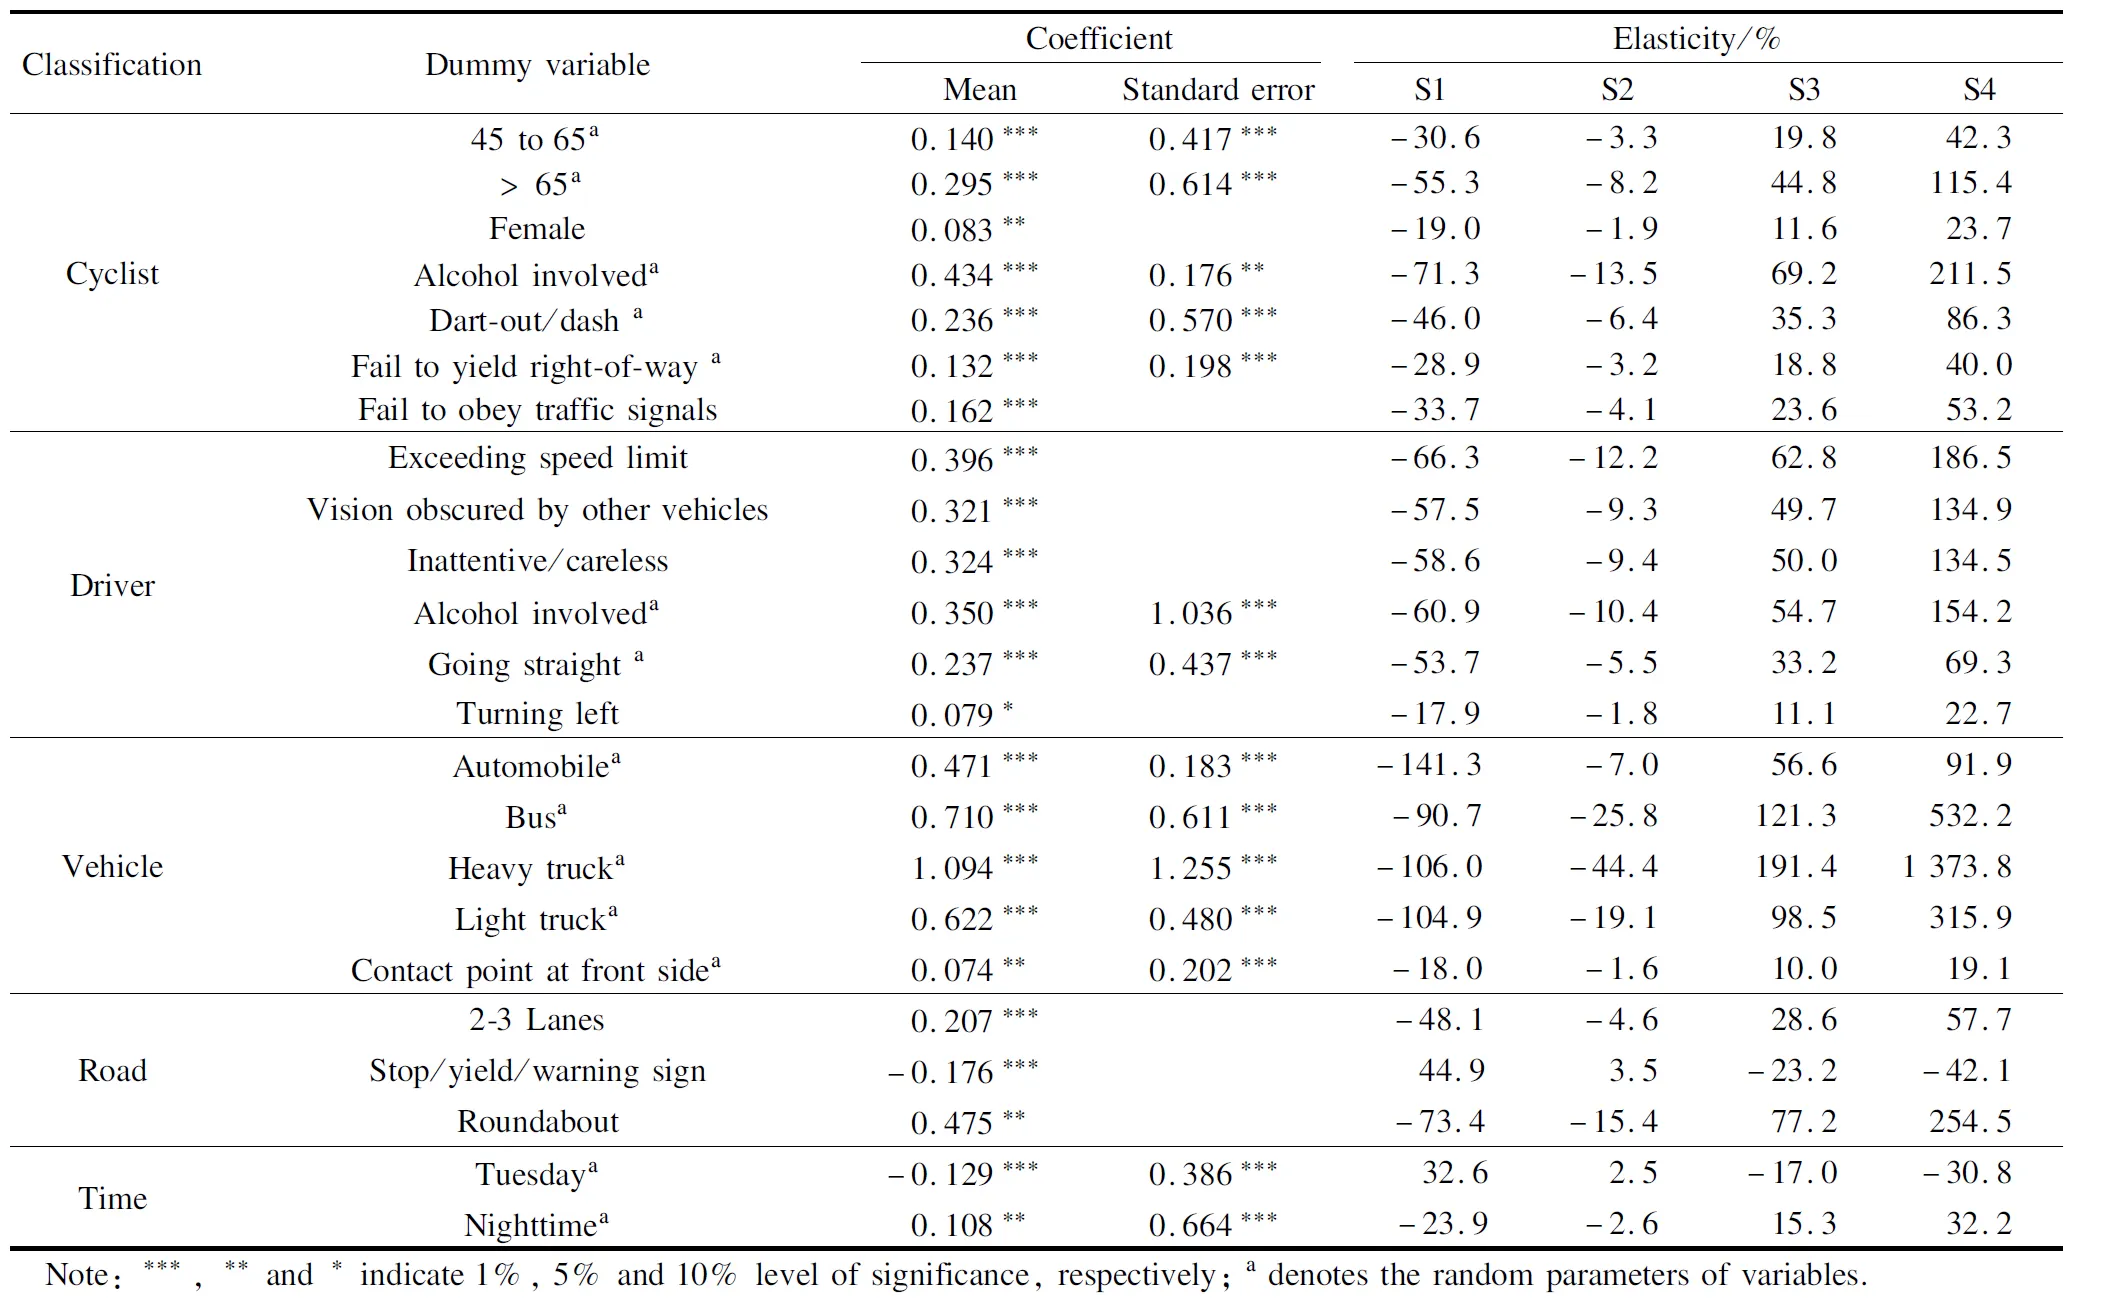
Pr(Yi=1)=Pr(δ1 (3) Pr(Yi=2)=Pr(δ2 (4) Pr(Yi=3)=Pr(Zi+εi>δ3)=1-Φ(δ3-Zi) (5) whereΦis the probability function ofεi. There may be certain random effects for each influencing factor. In order to detect unobserved heterogeneity of each explanatory variable, a random error term, also normally distributed, is added to each coefficient. β′=β+σi (6) whereβ′ is the random coefficient vector;σiis the random error term.β′,δ1,δ2andδ3are estimated by the maximum likelihood method. The likelihood function of thei-th cyclist suffers levelminjury may be written as (7) Then, the corresponding log-likelihood function is I d agreed to help my brother, Mac, move from the East Coast to California. He would drive a rental2 truck loaded with his belongings3 and I would follow him in his sedan, then fly back. We figured it would be a simple trip, with four or five motel stops along the way.。,,。,。 (8) wheref(β′|w) is the probability density function ofβ′;wis the distribution parameter ofβ′;di,mis equal to 1 if thei-th cyclist suffers levelminjury and is zero otherwise. Each coefficient inβ′ of the probit model does not reflect the quantitative effects of the explanatory variables. Therefore, the elasticity is reported. It indicates the change rate for the likelihood of each injury level[25]. (9) whereXi,nis then-th explanatory variable inXi;Ei,nis the elasticity ofXi,n. 3.4.1 Roadway width Three types of cyclists’ violation including fail to obey traffic signals, dashing and fail to yield right-of-way are significant, which may cause more serious injury. Among them, dashing is the most dangerous factor of which the elasticity for incapacitating injury is 35.3% and that for fatal injury is 86.3%, followed by failing to obey traffic signals of which the elasticity for incapacitating injury is 23.6% and that for fatal injury is 53.2%. Moreover, the likelihood for fatal injury tends to increase by 40.0% if cyclists fail to yield right-of-way in crashes. Cycling at a high speed increases the risk of serious conflict with motor vehicles, which commonly occurs among male cyclists[18]. This may be attributed to their self-identified riding skills and risk-taking tendency. Previous studies have shown that red-light running could lead to serious injuries[26]. It is quite common in many western countries, and at least 50% of the cyclists have different degrees of red-light running behavior[30-32]. It is particularly prevalent among young and middle-aged cyclists, and there is also gender difference[31]. This may also be the reasons for the high mortality of male cyclists. However, studies also indicate that females are becoming more risk-taking regarding violation behaviors[18]. In addition, drivers are often not willing to share right-of-way with cyclists[33], which also increase the risk of collisions. Tab.3 The results of the RPOP and elasticities 3.3.1 Body type The 45 to 65 years old indicator and beyond 65 years old indicator are positively significant. The elasticity for cyclists aged 45 to 65 for incapacitating injury is 19.8%and for fatal injury is 42.3%. It means that compared with younger cyclists (age<45), the likelihood for incapacitating injury will increase by 19.8% and for fatal injury will increase by 42.3%. The parameter of this dummy variable is normally distributed with a mean of 0.14 and a standard deviation of 0.42. It means that 63.1% of them tend to sustain a greater injury. Similarly, compared with younger people (age<45), the likelihood for 68.4% of the older cyclists (age>65) will increase by 44.8% for an incapacitating injury and 115.4% for a fatal injury, respectively. The results indicate that older cyclists are prone to greater injury compared with younger cyclists, which is consistent with previous studies[23,26].In fact, the proportion of older cyclists (age>45) in the total number of commuting cyclists is smaller than 15% in the U.S.[27]. A recent official report from the National Highway Traffic Safety Administration(NHTSA) shows that the average age of cyclists killed in crashes has increased from 41 to 47 during the past 10 years[28].The phenomenon could be explained by the fact that the perceptional skill and reaction of the older people may be lower. Consequently, they may not have enough flexibility to yield and respond to emergencies[14,23,26]. In addition, some of the older cyclists’ own health conditions also increase the degree of injury in crashes[23,26]. Therefore, given the alarming issue, it is recommended that older people should pay more attention to their safety during daily cycle travelling. 3.1.2 Gender 64.3% head-on crashes cause higher injury than other impacting patterns. The likelihood for incurring an incapacitating injury and that of a fatal injury tend to increase by 10.0% and 19.1%, respectively. This finding is consistent with previous reports[23,26]because the energy of a head-on collision is higher. The significant normal distribution of the coefficient of the dummy variable can be explained by cyclists who can be easily seen by the driver when they appear in front of the vehicle. Drivers often have enough time to take effective evasive maneuvers. So, not all the cyclists involved in head-on collision are seriously injured. 3.1.3 Alcohol-intoxicated In many states of the U.S., bicycles are classified as vehicles. Therefore, cyclists are subject to the same legal restrictions on alcohol as drivers. Compared with cyclists who are not drunk, 99.3% alcohol-intoxicated cyclists tend to suffer higher injury (the coefficient is normally distributed with a mean of 0.43 and a standard deviation of 0.18). The likelihoods for incapacitating injury and for fatal injury will increase by 69.2% and 211.5%, respectively. Drinking will not only reduce their flexibility to take evasive maneuvers[23], but also reduce the use of helmets[26]. Therefore, it is highly recommended that drink-driving or cycling should be prohibited by explicit order. 3.1.4 Behavior prior to crash The backward elimination method is used to exclude non-significant variables. Then, 23 dummy significant variables are obtained. Thep-value of Waldχ2test is smaller than 0.01. The value of the Akaike information criterion (AIC) for the RPOP is 10 038.6, which shows improvement compared with the AIC(10 114.5) for the fixed parameter model, so the RPOP shows a better fit performance in this study. The results of the RPOP and the elasticities are shown in Tab.3. 3.2.1 Speeding Exceeding speed limit is significant for increasing injury severity.The likelihood for incapacitating injury tends to increase by 62.8% and that for fatal injury increases by 186.5%. This result is logical and consistent with expectations. Speeding can increase the momentum of the collision intensely, which also reflects the driver’s aggressive personality[26]. 3.2.2 Alcohol intoxicated Then the possible correlated indicators are classified into 5 main categories including cyclists’ characteristics and behavior, drivers’ characteristics and behavior, vehicle characteristics, road condition, and time. All of them are discontinuous categorical variables, so they are processed into dummy variables. Some of the variables were classified detailedly in origin datasets, so the observations for some sub-classifications of them are few. In sight of this, some detailed classifications are merged into upper classifications. The age of cyclists is divided into 4 types (<25, 25 to 45, 45 to 65, and >65). Vehicles are merged into 5 main types including automobiles, buses, heavy trucks, light trucks, and motorcycles. The volume was not provided in the GES datasets. But this information is partly included in the time indicator. Therefore, time is divided into 3 types including peak time (7:00 a.m.—10:00 a.m., 4:00 p.m.—7:00 p.m.), off peak time (10:00 a.m.—4:00 p.m.) and night time (7:00 p.m.—12:00 p.m., 0:00 a.m.—7:00 a.m.). Considering the correlation between time and lighting, the lighting indicator is excluded. For some sub-classification of few observations (<5%), which cannot be merged into other categories, are merged into the “other” type. Alcohol intoxicated drivers caused 63.2% of the cyclists’ incurring higher injury. The likelihood for incapacitating injury tends to increase by 54.7% and that for fatal injury increases by 154.2%. Under the influence of alcohol, drivers’ reaction ability is reduced and they drive more recklessly. The heterogeneity of this variable may be explained by different kinds of responses from the cyclists interacting. Among people covering the large slope, either reclining, sitting, or squatting8 on the grass in twos and threes, I intoned lines by Jacques Prevert the French poet 3.2.3 Vision obstacle and inattention When drivers’ vision is blocked by other vehicles at intersections, their perception of risk will be weakened and their reaction time will be longer. The elasticity for incapacitating injury is 49.7% and that for fatal injury is 134.9%. Meanwhile, inattention can easily cause failing to be evasive, which would lead to a higher speed before incident. The elasticity for incapacitating injury is 50.0% and that for fatal injury is 134.5%. 3.2.4 Movement Movement indicates the moving direction of drivers before the collision occurs. Consistent with the previous research, both going straight and turning left are significant for increasing the injury severity relative to turning right and other movements[16]. The elasticity for going straight for incapacitating injury is 33.2% and that for fatal injury is 69.3%. The coefficient is heterogeneous with a mean of 0.24 and a standard deviation of 0.44. It means that 70.3% cyclists sustain higher injury if they are hit by a going-straight vehicle. The possible reason is that the speed of straight cars is higher.But some of the risks are compensated for because it is easier for drivers to see cyclists when going straight than turning. The elasticity for turning left for incapacitating injury is 11.1% and that for fatal injury is 22.7%. This is because vehicles may have potential conflicts with the existing traffic flow[2]. 3.1.1 Age Compared with motorcycles, all other types of vehicles will increase the injury severity for cyclists. In general, the injury severity is positively correlated with the mass of the vehicle body[12]. The elasticities of vehicle types for fatal injury are 91.9%(automobiles), 532.2%(buses), 1 373.8%(heavy trucks), 315.9%(light trucks), respectively. This finding is consistent with previous studies[34-35]that stated heavy vehicles have a higher risk of impact. Significantly, heavy trucks contribute the most to the likelihood of fatal injury, because they generally have higher bumpers, which can cause severe upper body or head injuries to cyclists in collisions[34-35]. All the coefficients of vehicle types are heterogeneous and the standard deviations are also positively correlated with vehicle mass. It is probably due to the lower speed of heavy vehicles at the intersection area. As the years passed, other occasions--birthdays, recitals13, awards, graduations--were marked with Dad s flowers. My emotions continued to seesaw14 between pleasure and embarrassment. 3.3.2 Initial contact point The dummy indicator of being a female is positively significant. The elasticity for incapacitating injury is 11.6% and that for fatal injury is 23.7%. It means that women are more vulnerable to serious injuries than men at intersections. However, females generally do not prefer commuting by bicycle and only 24% of commuting cyclists are female in the U.S.[27]. This finding is consistent with previous studies[18]. Male cyclists are less likely to have dangerous conflicts at intersections than women, and they can calmly adopt the right maneuvers in conflicts[18]. This might be attributed to the higher long-term accumulated experience and skills in cycling commuting of males. Nevertheless, other studies show that males could have a much higher risk of fatal injury than females[17-18,28-29]. This could be attributed to higher average speed of male cyclists, which increases the severity of potential collision risks[18]. While the noodles boiled in the broth in my kitchen, I realized that I was reconnecting with my mother through food. I laughed a bit at myself when I reflected on all the dishes I had cooked that week. Without knowing it, I had created a beautiful ritual to honor my mother and to comfort myself at this vulnerable time. I suddenly felt my mother at hand and was filled with her presence. I was so uplifted and excited that I began talking to her, imagining she were there. When they came to the troll s dwelling18 it was no longer in the bank, but on the top of this there stood a large castle which the youth had never seen before The dummy variable “2-3 lanes” is significant. The elasticity for an incapacitating injury is 26.8% and that for a fatal injury is 57.7%. It means that the likelihood for an incapacitating injury and that for a fatal injury increase by 26.8% and 57.7%, respectively, on a 2-3 lanes roadway. However, some previous studies have shown that the increase in the roadway width can increase the injury severity in crashes[36]. One possible explanation is that in the non-crossroad sections, the wide road leads to a higher vehicle speed. While at intersections, the speed is generally lower than those at other sections. Wide roadways increase drivers’ visibility and reaction ability, and also provide enough time and space for cyclists to react and yield. Meanwhile, a narrower roadway means that the mixed traffic flow of motor vehicles and bicycles is relatively dense, which increases the potential conflicts. In particular, if there are other vehicles blocking drivers’ vision, the blind area of drivers can be larger, which can lead to a dangerous conflict. This was the way she chose of making him fond of her; but afterwards, as he grew older, she spared no pains in educating and training him as a prince should be trained 3.4.2 Intersection type A roundabout is a dangerous form of intersection for cyclists, which has been confirmed by previous studies[19-20,37]. Especially in built-up areas, both the number of accidents and the severity of injuries is increased[20]. The possible reason is that they reduce the risk perception of cyclists[19]. The result in this study accords with the former’s. Compared with the intersections of other types (four-way intersection, T-shape, etc.), the likelihood for an incapacitating injury will increase by 77.2% and that for a fatal injury will increase by 254.5%. And when the people saw it, there arose general laughter and derision,34 and she was so ashamed that she would rather have been a thousand fathoms33 below the ground 3.4.3 Traffic control device The stop/yield/warning sign indicator is negatively correlated to crash severity. Compared with the intersection without control devices and with other devices, the likelihood for incurring an incapacitating injury will decrease by 23.2% and that for a fatal injury will decrease by 42.1%. This result indicates that controlled intersections are related to less severe injuries because they can reduce vehicle speeds and improve the risk perception level[15,36]. Thus, the conflicts between bicycles and motor vehicles can be reduced accordingly. The nighttime indicator is significant. The result shows that 56.5% cyclists suffer higher injuries at night. The likelihood for incurring an incapacitating injury will increase by 15.3% and that for fatal injury will increase by 32.2% compared with the daytime. This finding is consistent with Eluru’s report[23]. Lower visibility at night reduces the driver’s reaction ability, hence increasing collision energy[23].In addition, the factor Tuesday is also significant. The reason for this interesting phenomenon is unknown and further study is needed. I looked at the drawing on the kitchen wall, sketched13 by my grandfather s hand so many years before. The picture became distorted as tears filled my eyes. You are my Joy. I love you with my life. I murmured quietly. The young woman in the drawing sat on her park bench and with twinkling eyes smiled broadly at me, an engagement ring carefully drawn14 on her finger. 1) In the U.S., commuting by bicycle is quite dangerous for older cyclists and women. Therefore, more attention must be paid to them. Reinforcing safety education and adding safety facilities are effective ways to reduce collision risk. ” In the following year, one of the sisters would be fifteen: but as each was a year younger than the other, the youngest would have to wait five years before her turn came to rise up from the bottom of the ocean, and see the earth as we do 2) Considering the behavioral factors, the main causes of higher injury severity in vehicle-cyclist collision include high speed (racing, dashing, etc.), insufficient reaction time (racing, drinking, etc.) and increased chance of conflict (turning left, red-light running, etc.). Therefore, it is important to strengthen the law enforcement for both drivers and cyclists. 15.Cave below the earth: The cave could be a reference to Hell. There is also Plato s metaphor34 of the cave, of being unable to see the light (Biedermann 61). A cave can also mean a return to the womb (Biedermann 62).Return to place in story. 3) Improving road environment can effectively reduce the risk of collision. Lighting facilities should be improved to increase visibility at night and signs can be expended to limit speed and enhance the vigilance of road users.2 Results
3 Discussion
3.1 Cyclist characteristics and behavior
3.2 Driver characteristics and behaviors
3.3 Vehicle characteristics
3.4 Intersection condition
3.5 Time
4 Conclusions
杂志排行

Journal of Southeast University(English Edition)的其它文章
- Expansion performance and self-stressing behavior of CFST columns considering concrete creep and shrinkage effect
- Min-max fuzzy model predictive tracking control of boiler-turbine system for ultra-supercritical units
- Firm review revelation policy considering social ties among consumers
- Fundamentals of quasigroup Hopf group-coalgebras
- A fault feature extraction method of gearbox based on compounddictionary noise reduction and optimized Fourier decomposition
- Coupling dimensions of human resource archetypes and organizational learning modes