A bearing fault feature extraction method based on cepstrum pre-whitening and a quantitative law of symplectic geometry mode decomposition
2021-04-23ChenYiyaJiaMinpingYanXiaoan
Chen Yiya Jia Minping Yan Xiaoan
(1 School of Mechanical Engineering, Southeast University, Nanjing 211189, China)(2 School of Mechatronics Engineering, Nanjing Forestry University, Nanjing 210037, China)
Abstract:In order to extract the fault feature of the bearing effectively and prevent the impact components caused by bearing damage being interfered with by discrete frequency components and background noise, a method of fault feature extraction based on cepstrum pre-whitening (CPW) and a quantitative law of symplectic geometry mode decomposition (SGMD) is proposed. First, CPW is performed on the original signal to enhance the impact feature of bearing fault and remove the periodic frequency components from complex vibration signals. The pre-whitening signal contains only background noise and non-stationary shock caused by damage. Secondly, a quantitative law that the number of effective eigenvalues of the Hamilton matrix is twice the number of frequency components in the signal during SGMD is found, and the quantitative law is verified by simulation and theoretical derivation. Finally, the trajectory matrix of the pre-whitening signal is constructed and SGMD is performed. According to the quantitative law, the corresponding feature vector is selected to reconstruct the signal. The Hilbert envelope spectrum analysis is performed to extract fault features. Simulation analysis and application examples prove that the proposed method can clearly extract the fault feature of bearings.
Key words:cepstrum pre-whitening; symplectic geometry mode decomposition; eigenvalue; quantitative law; feature extraction
Rolling bearings play a key role in modern industry. The failure of the rolling bearing may lead to the failure of the whole mechanical system or even an accident[1-2]. With the advantages of accurate positioning and convenient data collection, the vibration signal analysis is considered to be the most effective method in feature extraction and fault diagnosis[3]. Vibration signals collected by vibration sensors mounted on bearing boxes are indirect sources of information, which are usually interfered with by various noises. Fault feature signals are usually weak, which hinders the detection of bearing faults. Therefore, it is necessary to adopt effective signal processing methods to provide more obvious information for the fault diagnosis of rolling bearings[4].
The failure modes of bearings mainly include pitting corrosion, spalling, abrasion, etc., among which spalling is the main fatigue damage type of ball bearings[5]. When the bearing fails, the collision between the damaged part and the surface of other components will produce temporary impact components in the time domain. The bandwidth of the frequency domain is large, which covers the natural frequency of the bearing system and even the sensor, thus causing system resonance. Effective extraction of fault features can be obtained by envelope demodulation spectrum analysis, but the optimal resonance band should be selected, and the background noise in the mechanical system will seriously affect the accuracy of demodulation. In recent years, many advanced methods have been applied to bearing diagnosis. For example, Chen et al.[6]proposed a fault diagnosis method based on the integration of resonance-based sparse signal decomposition (RSSD) and wavelet transform. Ding et al.[7]proposed a dynamic structure adaptive sign method for predicting the life of slewing bearings under variable working conditions. Jiang et al.[8]proposed a method based on minimum entropy deconvolution and envelop spectrum analysis. However, the above method requires a huge amount of calculation, and the effect of background noise on fault feature extraction is not considered.
In 2011,Sawalhi and Randall[9]proposed a signal pre-whitening method based on the cepstrum editing procedure (CEP). By editing the cepstrum value of the vibration signal, the corresponding cepstrum value in the real cepstrum is set to be zero to obtain the pre-whitening signal. The advantage of this method is that there is no need to select the resonance frequency band, and the envelope analysis can improve the bearing fault diagnosis effect; however, there is the disadvantage of increased noise interference[10]. SGMD is a new nonlinear dynamic decomposition method based on the symplectic geometry similarity transformation proposed by Pan et al[11]. Existing decomposition algorithms include wavelet transform[12], ensemble empirical mode decomposition (EEMD)[13], local feature-scale decomposition (LCD)[14], and singular spectrum analysis (SSA)[15]etc. These methods have some defects for the signal analysis of the nonlinear system. When the signal is more complex, especially with noise, LCD and SSA will force the signal to decompose into several incomplete components. In addition, wavelet transform and EEMD require user-defined parameters and are very sensitive to parameters[11]. SGMD can effectively reconstruct the signal and eliminate noise without any user-defined parameters.
However,SGMD also has certain disadvantages. First, SGMD directly constructs the trajectory matrix through the original time series. Under background noise, weak fault features may be drowned in the global time series. Secondly, SGMD reconstructs the final symplectic geometry mode component by calculating the frequency similarity and component correlation of the initial components, which requires a large amount of computation and lacks a theoretical basis. Based on these two shortcomings, this paper combines the signal pre-whitening method based on CEP and the quantitative law of SGMD. Firstly, the original fault signal is preprocessed by CPW to remove the discrete frequency component in the signal and eliminate its interference in the unsteady shock component caused by bearing damage. Secondly, SGMD is performed, and the bearing fault signal was reconstructed according to the quantitative law of eigenvalues found in the SGMD. Finally, the reconstructed signal was analyzed by the Hilbert envelope spectrum to realize the effective extraction of bearing fault features. Moreover, simulations and experiments are carried out to verify the effectiveness of the proposed method.
1 Cepstrum Pre-Whitening
CPW means to set all the values to be zero in the real cepstrum domain. It removes discrete frequency components such as harmonics and sidebands in the signal spectrum to obtain the best smooth distribution of discrete frequency components in the signal spectrum. The pre-whitening signal contains only non-stationary impact components caused by white noise and bearing damage. Signal pre-whitening process based on cepstrum editing enhances the vibration shock components of bearing fault signals. The schematic diagram of the CPW of vibration signal is shown in Fig.1.
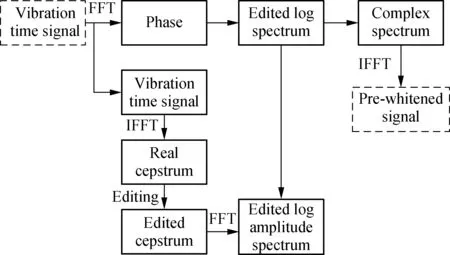
Fig.1 Schematic diagram of the cepstrum pre-whitening procedure
The signal pre-whitening process essentially removes all discrete frequency components and resonance effects in the original vibration signal. It turns the entire spectrum of the pre-whitened signal into a resonance frequency band. Therefore, there is no need to determine the optimal resonance frequency band. Pre-whitened signals can be directly enveloped. However, it does not remove much white noise in the weak bearing failure and the results of envelope demodulation are not obvious.
2 Simulation Analysis and Theoretical Derivation of SGMD’s Quantitative Law
SGMD reconstructs the final symplectic geometric modal component by calculating the frequency similarity and component correlation of the initial symplectic geometry components (SGCs), which is computationally intensive and lacks a theoretical basis, and it easily attracts noise. The initial SGCs are positive. It is the eigenvector corresponding to the eigenvalue of the Hamilton matrix during the decomposition process. Therefore, this paper explores and finds the quantitative relationship between its eigenvalue and the number of frequencies in the original signal, and theoretically derives the quantitative law to better understand the physical meaning of the initial SGCs.
2.1 Symplectic geometry mode decomposition
2.1.1 Phase-space reconstruction
The original time series can be expressed ass=x1,x2,…,xn, wherenis the length of the time series, andXis obtained by the phase-space reconstruction of the raw time series:
(1)
wheredis the embedding dimension, andτis the delay time, andm=n-(d-1)τ. By selecting the appropriate embedding dimensiondand the delay timeτ, the corresponding reconstruction matrixXcan be obtained. In this paper, the PSD is used to ascertain the embedding dimension. When the normalized frequency is less than 0.001,k=n/3, otherwisek=1.2×(fmax/fs), wherefmaxis the frequency of the maximum peak in the PSD andfsis the sampling frequency.
2.1.2 Symplectic geometry similarity transformation
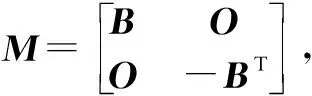
(2)
(3)
The eigenvalues of matrixBare arranged in a descending order as
σ1>σ2>…>σd
(4)

Z=Z1+Z2+…+Zd
(5)
2.1.3 Diagonal averaging

(6)
By Eq.(6), we can determineYi(y1,y2,…,yn), and a set of seriesYiwith one-dimensional lengthncorresponding to matrixZiis obtained. The initial SGCs obtained from the diagonal averaging can be expressed as
Y=Y1+Y2+…+Yd
(7)
2.1.4 Components reorganization
First, similar components with high similarity are summed to obtain the first component SGC1. Then, the reconstructed components of SGC1are removed from matrixY, and the remaining matrix can be expressed asG1. Finally, the remaining signalg1is obtained by summing the residual signal, and the normalized mean square errorEbetween the residual and the original signal is then calculated as
(8)
wherehis the number of iterations. When the normalized mean squared error is less than the given threshold 1%, the whole decomposition process will end. Otherwise, the residual matrix is used as the iterative original matrix to repeat the above iterative process until the iterative stopping condition is satisfied, and the final decomposition result is obtained as
(9)
whereNis the number of component series identified.
2.2 Simulation analysis of the quantitative law in SGMD algorithm
During the process of SGMD, it is found that there is an important relationship between symplectic geometric spectrumσiof matrixBand the number of signal frequencies. The smaller value ofσi(close to zero) is regarded as the noise component, and the larger value ofσi(not close to zero) is the effective eigenvalue of matrixB, which is denoted asαi.
By the method of repeated experiments, the number of frequencies in the signal gradually increases from 1 to 8, and each signal adds a frequency component to the previous signal. Then, the trajectory matrix with the same dimension is constructed for SGMD. The changes in the number ofαiare observed and analyzed during the process. The signal expression is
(10)
In order to verify the influence of noise on the results, each signal in Eq.(10) is added with the noise of -5 and -10 dB. The sampling frequency of each signal is 1 024 Hz, and 1 024 points are collected in [0,2π].The dimension of the constructed trajectory matrix is 522×523. The symplectic geometry of matrixBin SGMD is calculated, and the results are shown in Fig.2.
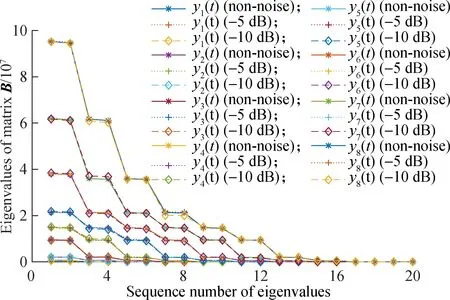
Fig.2 Symplectic spectrum of matrix B
It can be seen from Fig.2 that the number of effective eigenvalues in the symplectic geometric spectrum of frequency component matrixBis always increased by only two for every increase of a frequency in the signal. In the symplectic geometry spectrum of the newly added signal, except for the two newly added eigenvalues, the rest of the eigenvalues are almost the same as the eigenvalue of the previous signal, and the two newly added eigenvalues are almost equal. If other frequencies and amplitudes are used for decomposition, the same result will be obtained; that is, one frequency component always corresponds to two effective eigenvalues, and is independent of frequency, amplitude and signal-noise ratio.
In summary, the number ofαiis determined by the number of frequencies in the signal and is independent of the frequency size, amplitude and phase. As long as the dimension of the trajectory matrix constructed by the signal is greater than twice the number of frequencies in the signal, each frequency component will correspond to twoαi. Since the corresponding eigenvector ofαiis the initial SGC, every two initial SGCs correspond to a frequency component.
2.3 Theoretical derivation of the quantitative law in SGMD algorithm
In order to verify the correctness of the quantitative law in Section 2.2, this section makes a theoretical derivation of the double quantity relationship betweenαiand the number of signal frequencies in the symplectic geometry mode decomposition process. There is a continuous deterministic signaly(t) in the time domain, includingifrequency components, which is expressed as
(11)
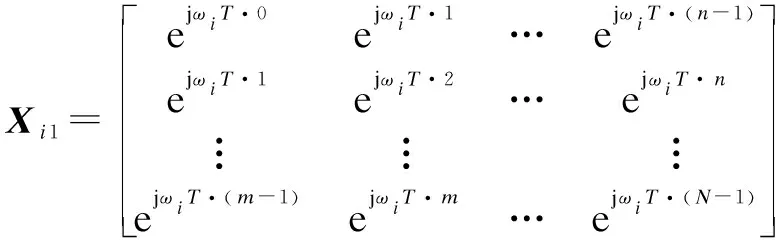
Sampling Eq.(11) at equal time intervals, the constructed trajectory matrix is
(12)
According to the trigonometric function relation,we can obtain
sin(ωit+φi)=aisin(ωit)+bicos(ωit)
(13)
(14)
By the Euler formula ejωiTs=cosωiTs+jsinωiTs,we can obtain
(15)
Substituting Eq.(15) into Eq.(14) and by simplification, we can obtain
(16)
Xican be rewritten as the sum of two matrices as
(17)
where
Xis the sum of the trajectory matrixXiconstructed by a single frequency component:
(18)
From Eq.(17) and Eq.(18), the total trajectory matrix containingIfrequency component signals can be obtained as
(19)
It can be seen from Eq.(19) that the total trajectory matrixXis obtained by summing upItrajectory matrixXi, and it can be proved that the rank of the trajectory matrixXiis 2 and is only related to frequency. Sinceω1≠ω2≠ω3≠…≠ωI, the trajectory matrixXiformed by each frequency signal is linearly independent. Therefore, when the original signal containsIfrequency components and the total matrixXsatisfies min(m,n)≥2I, the rank of the total matrixXis 2I. In the SGMD process, since the matrixB=XTX,r(B)=r(XTX)=r(X)=2Ican be obtained. The number of non-zero eigenvalues of a matrix is equal to the rank of the matrix, so the number of effective eigenvalues of matrixBobtained after SGMD should also be 2I, and is independent of amplitude and phase.
According to the above simulation and theoretical derivation, it can be seen that the feature frequency component of the vibration signal is included in the feature value sequence spectrum. In the following, the SGMD’s quantitative law will be further applied to the extraction of feature frequencies of bearing fault simulation signals and experimental vibration signals.
3 Procedures of the Proposed Method for Fault Detection of a Rolling Bearing
In this paper, a bearing fault feature extraction method based on CPW and SGMD quantitative law is proposed. CPW can remove the discrete frequency components in the signal, so that the entire frequency spectrum of the pre-whitening signal becomes a resonance frequency band. There is no need to determine the optimal resonance frequency band, and the pre-whitening signal can be directly enveloped and analyzed. The double relationship between the number of effective eigenvalues of the Hamilton matrix and the number of signal frequencies during the SGMD indicates that every two initial SGCs correspond to a frequency component in the signal, so that the corresponding initial SGCs can be combined to extract feature frequencies and reduce the amount of calculation. Moreover, the detailed process of the proposed method is illustrated as follows:
1) First, CPW is used to preprocess the bearing fault signals and remove the discrete frequency components so as to eliminate its interference in the unsteady impact components caused by bearing damage.
2) Subsequently, the envelope spectrum analysis is performed on the signal after CPW, and preliminary feature extraction is performed.
3) Construct the trajectory matrix for the pre-processed signal, conduct SGMD and obtain the initial SGCs.
4) Finally, according to the SGMD’s quantitative law, select the eigenvalues corresponding to the corresponding fault feature frequency components in the envelope spectrum, and reconstruct the eigenvectors (initial SGCs) corresponding to these eigenvalues. The signal was analyzed by the Hilbert envelope spectrum to extract the feature frequency of the fault.
4 Simulation Analysis
To validate the excellent effectiveness of the proposed algorithm in extracting feature frequencies, this section will employ an emulation of the simple rolling bearing model. Consequently, the simulated vibration signal of a bearing with partial failure is established as follows[16]:
(20)
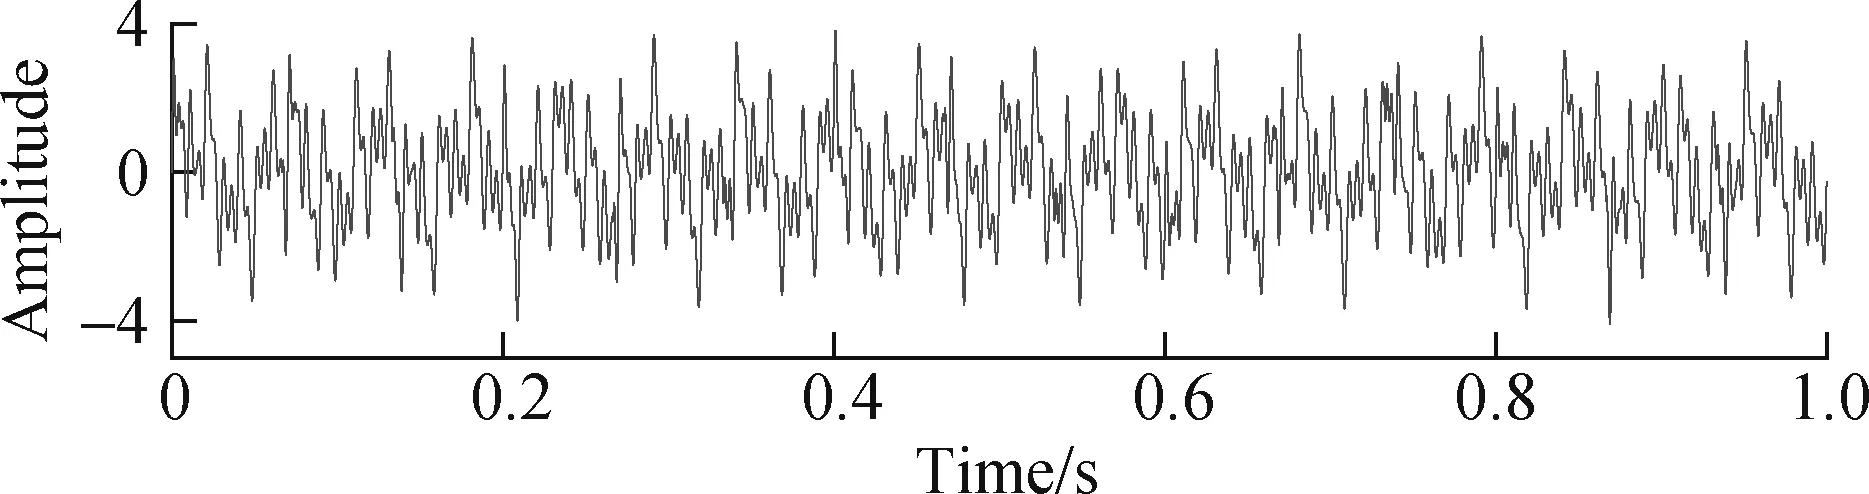
The simulation signalx(t) is composed ofx1(t),x2(t) andi(t). The sinusoidal signal frequency componentsf1,f2,f3, andf4are 18, 56, 100 and 200 Hz, respectively, and are used to simulate the number of interference sources when bearing failures occur. Signalx2(t) is applied to simulate the white noise, which can be generated in Matlab using the function awgn. Signali(t) is employed to imitate the periodic impulses; the amplitude is 1.2; the natural frequency is 300 Hz; and the pulse feature frequency isfo=15 Hz. Here, the sampling length isN=10 240, and the sampling frequency is 10 240 Hz. The waveform, FFT spectrum and envelope spectrum of the simulation signalx(t) are depicted in Fig.3.
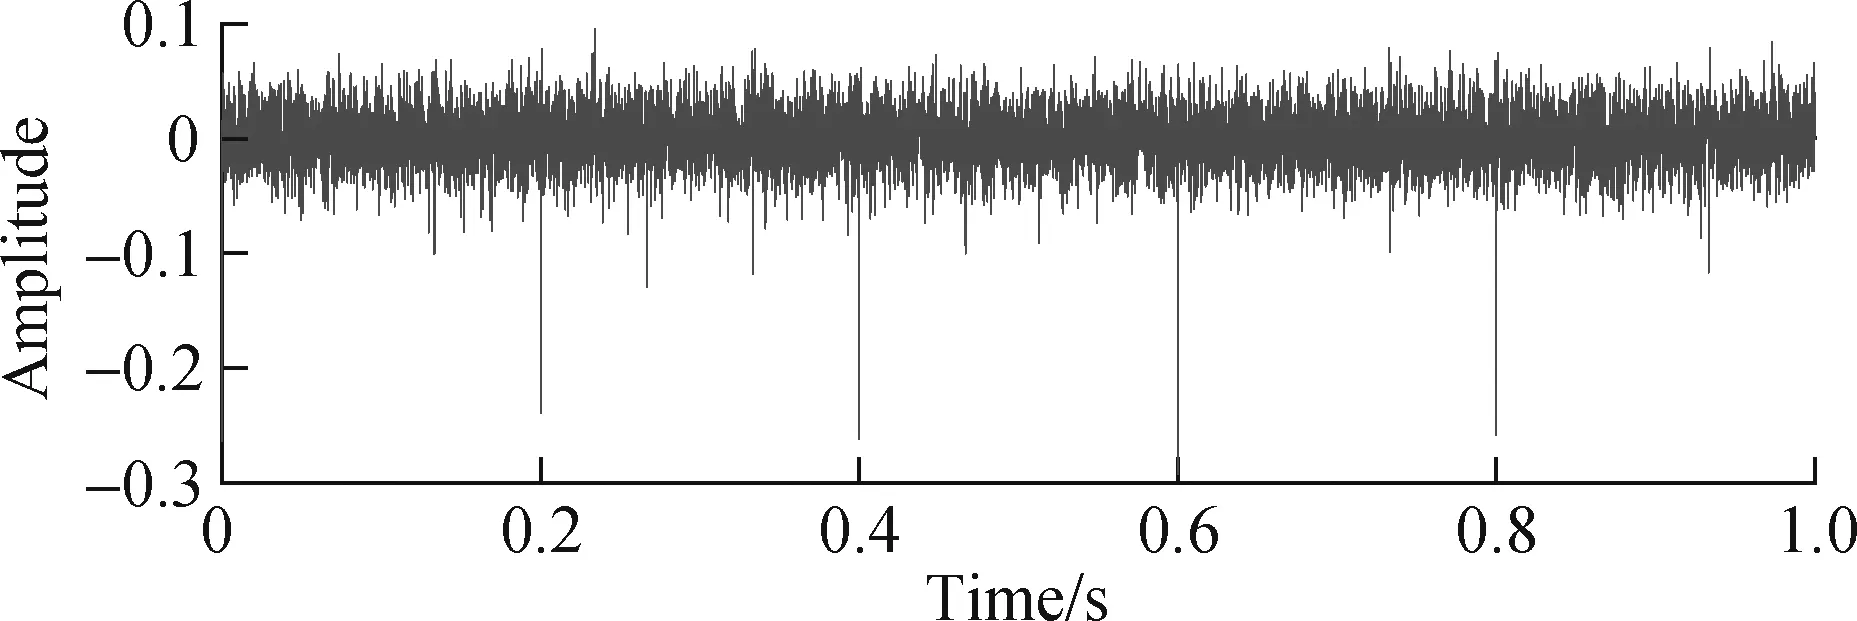
It can be seen from Fig.3 that the transient impact features of the signalx(t) are disturbed by the background noise and cannot be clearly identified. Its spectrum and envelope spectrum have no prominent spectral lines atfo, and the extraction effect is not good. Therefore, the method of this paper is used to analyze the simulation signal, as shown in Fig.4. Fig.4(a) and Fig.4(b) are the time-domain waveform and envelope spectrum of the CPW signal, respectively. The bearing fault feature frequencyfoand its harmonics can be seen from the envelope spectrum in Fig.4(b).
(a)
(a)
In order to further purify the fault features of the bearing and verify the quantitative law in SGMD, the trajectory matrix of the above pre-whitening signal is constructed, and then SGMD is carried out and the symplectic geometry spectrum of matrixBis solved, as shown in Fig.5. It can be seen from the envelope spectrum of Fig.4(b) that the magnitudes of the feature frequencies of the bearing faults are arranged from large to small as follows: 2fo, 4fo, 7fo, 5fo, 6foand 3fo, respectively. The value spectrum ranks first, second, third, fourth, and fifth, and the amplitude of 3fois relatively small, almost drowned in the envelope spectrum. The above research shows that in the process of SGMD, the number of effective eigenvalues of matrixBis twice that of the frequencies in the signal. Therefore, the eigenvalues corresponding to the top 5 frequencies of amplitude are the first 10 eigenvalues in matrixBsymplectic spectrum. The eigenvectorQi(i=1,2,…,10) corresponding to these 10 eigenvalues is selected for reconstruction, and then the signal is recovered through diagonal averaging. The envelope spectrum is obtained as shown in Fig.6.
It can be seen from the envelope spectrum that the fre-quency component of the reconstructed signal is only the fault frequency component of the bearing, and their amplitude is basically the same as the amplitude spectrum after pre-whitening. There are some differences due to the influence of noise in Fig.4(b). It is inevitable that it can be said that the fault feature frequency and its multiplier can be basically completely extracted via the SGMD’s quantitative law.
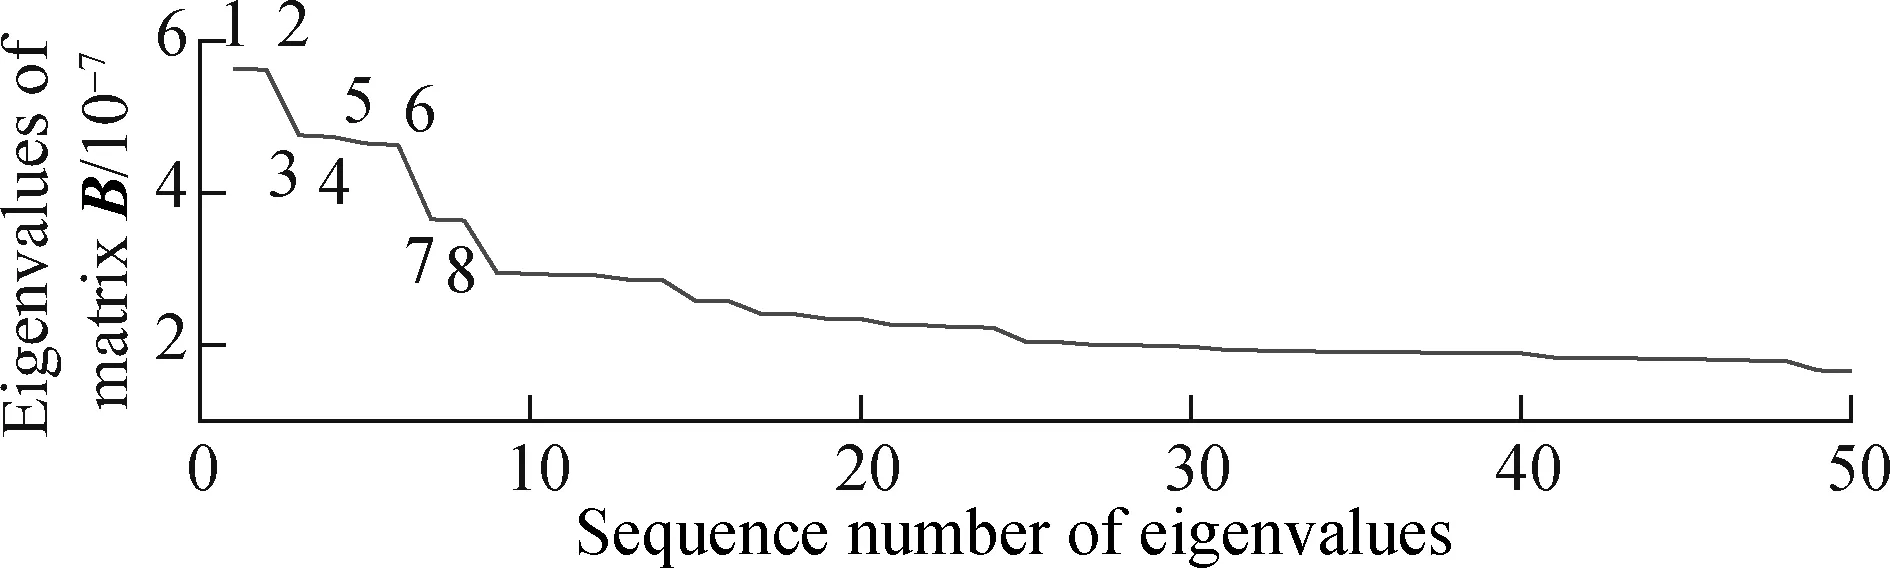
Fig.5 Symplectic geometry spectrum of matrix B in SGMD after pre-whitening signal
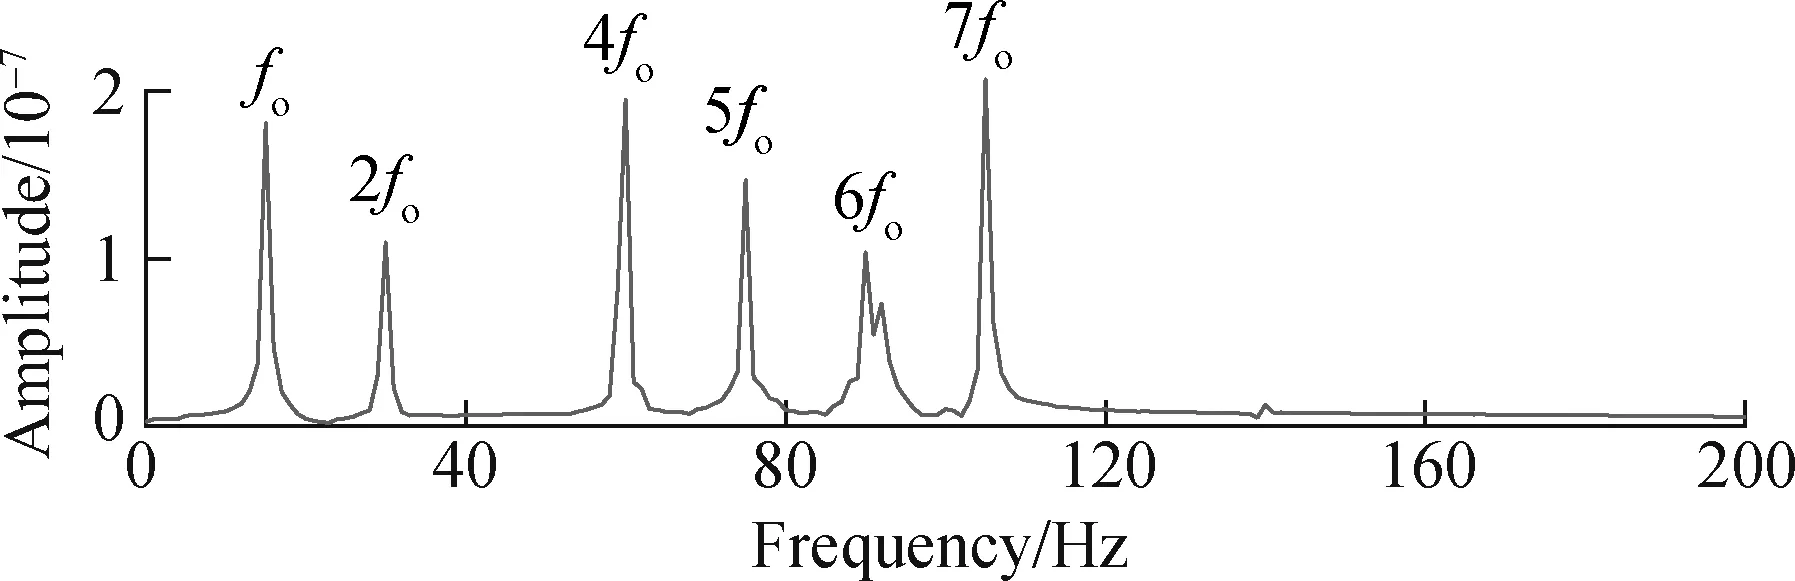
Fig.6 Envelope spectrum of SGMD reconstructed signal
The feature frequency of the shock and its multiples in Fig.6 are clearly extracted. Compared to the direct envelope spectrum analysis of the pre-whitening signal in Fig.4, the SGMD reconstructed spectrum diagram clearly shows the feature frequency of the bearing failure. It shows that the method in this paper can effectively extract the features of weak bearings under the influence of background noise and interference frequency, and has good noise reduction and separation performance for vibration signals.
For comparison, the fault feature extraction method of the wavelet-SVD difference spectrum[17]is introduced to process the above-mentioned simulation signals. First, using the “db5” wavelet coefficient, wavelet decomposition of the signal is performed on 5 scales, and then SVD is performed on the detailed signals of each scale (d1, d2, d3, d4, and d5) to obtain the singular value difference spectrum in Fig.7. Each detail signal is reconstructed according to the singular value difference spectrum, and the spectrum of the reconstructed signal is shown in Fig.8. The main frequency component in the frequency spectrum of the detailed signal d3 has an edge frequency. It is an amplitude-modulated signal. It is demodulated by the Hilbert transform. The envelope spectrum is shown in Fig.9, and the fault feature frequencyfoand its harmonics can be obtained. This is consistent with the fault feature frequency extracted by the method proposed in this paper, which further verifies the accuracy of the method. However, the selection of small and medium wave coefficients and the determination of the decomposition scale in this method have a great impact on the accuracy of the analysis results. Moreover, SVD is required for every detail signal after wavelet decomposition, which requires a huge amount of computation and much time. The method proposed in this paper only needs to construct a trajectory matrix for pre-whitening signals after CPW, and perform SGMD, which requires less calculation and greatly improves the calculation efficiency. Moreover, it is found through comparison that the method used in this paper to extract bearing fault features is more obvious.
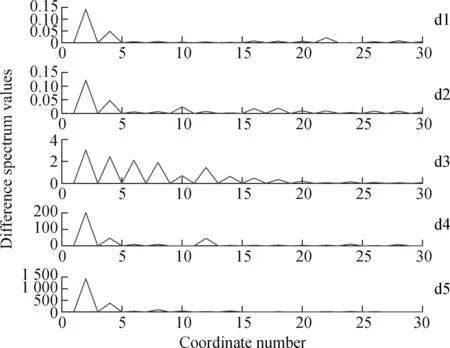
Fig.7 Singular value difference spectrum of wavelet detail signals
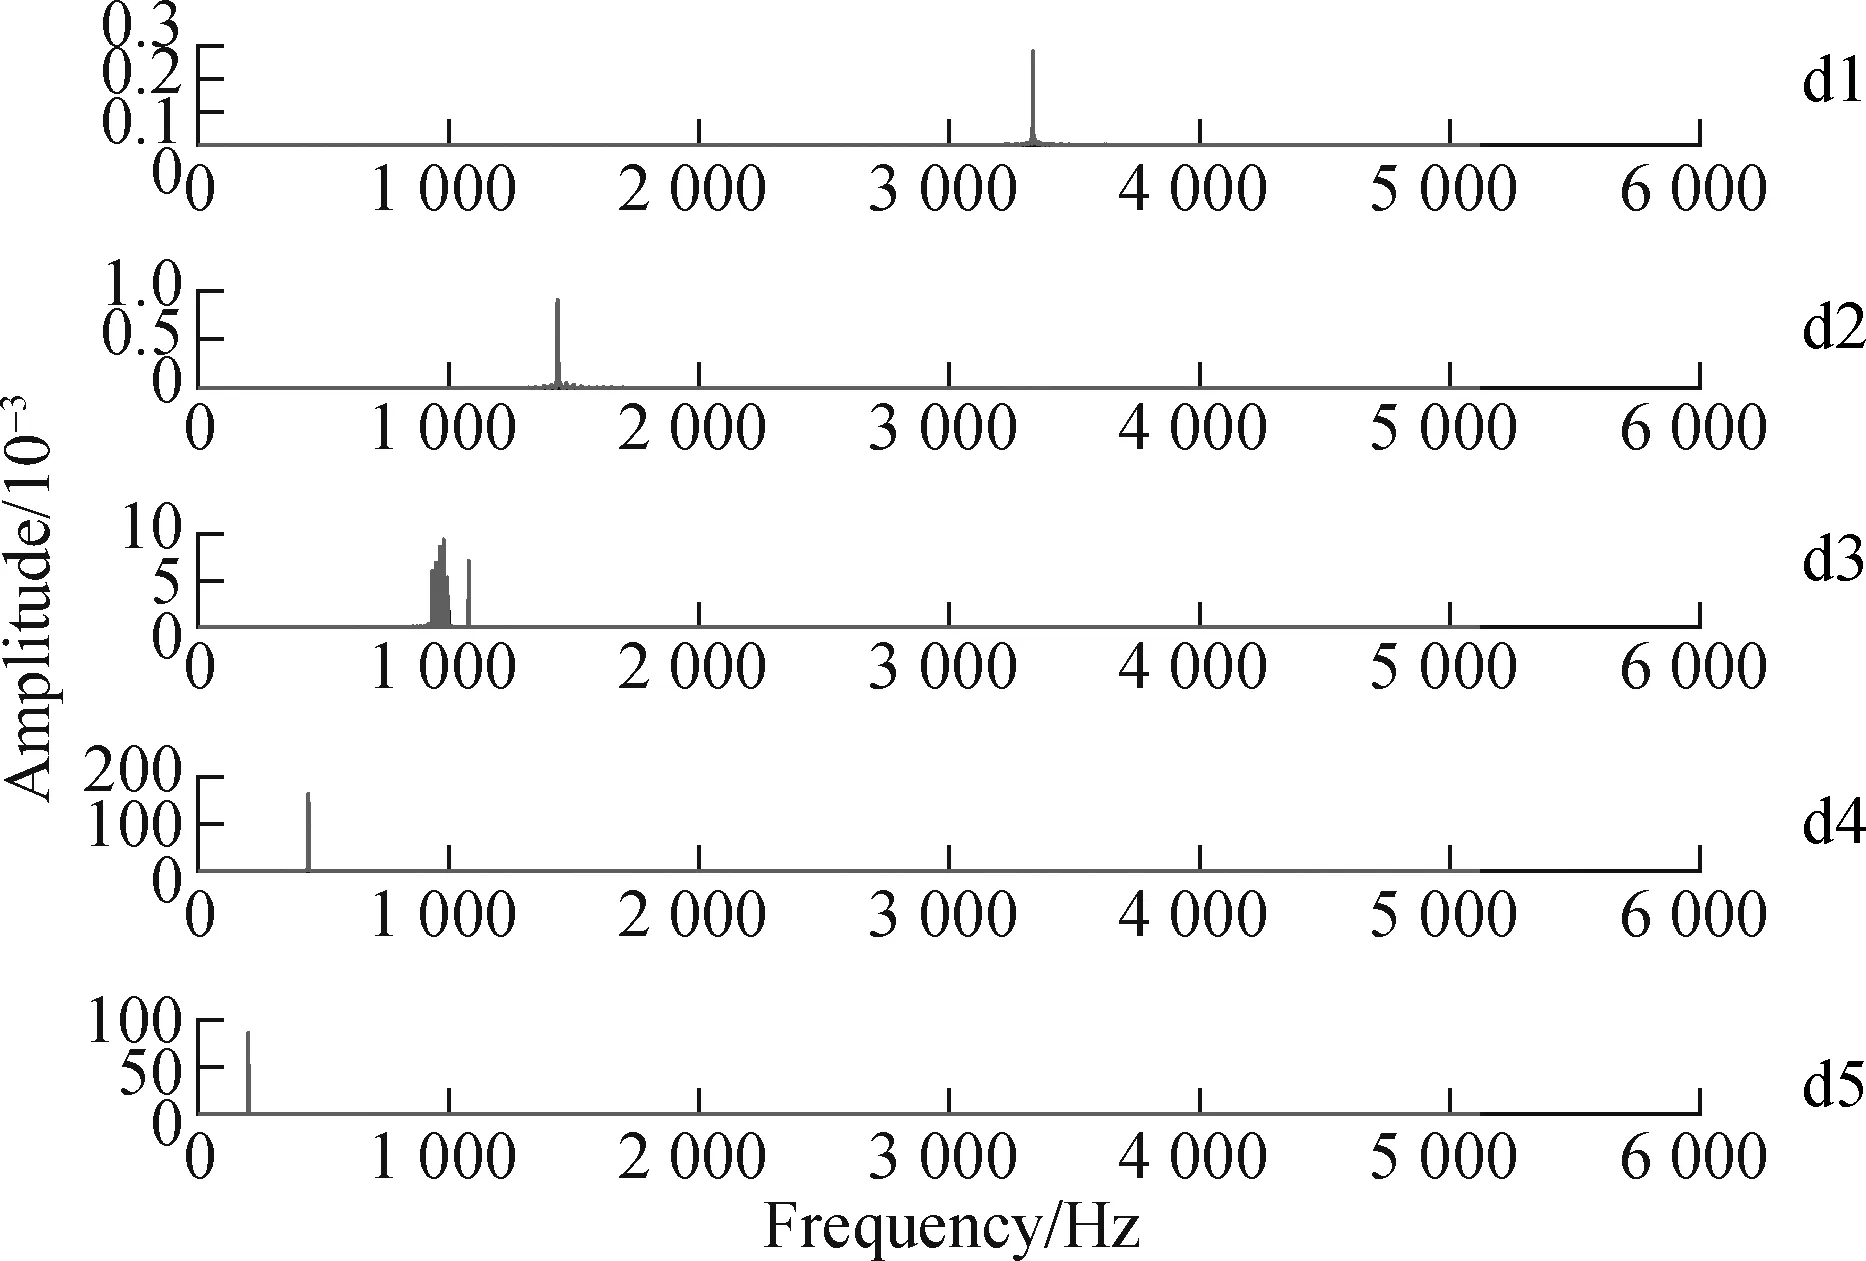
Fig.8 Envelope spectrum of wavelet detail signal based on SVD reconstruction
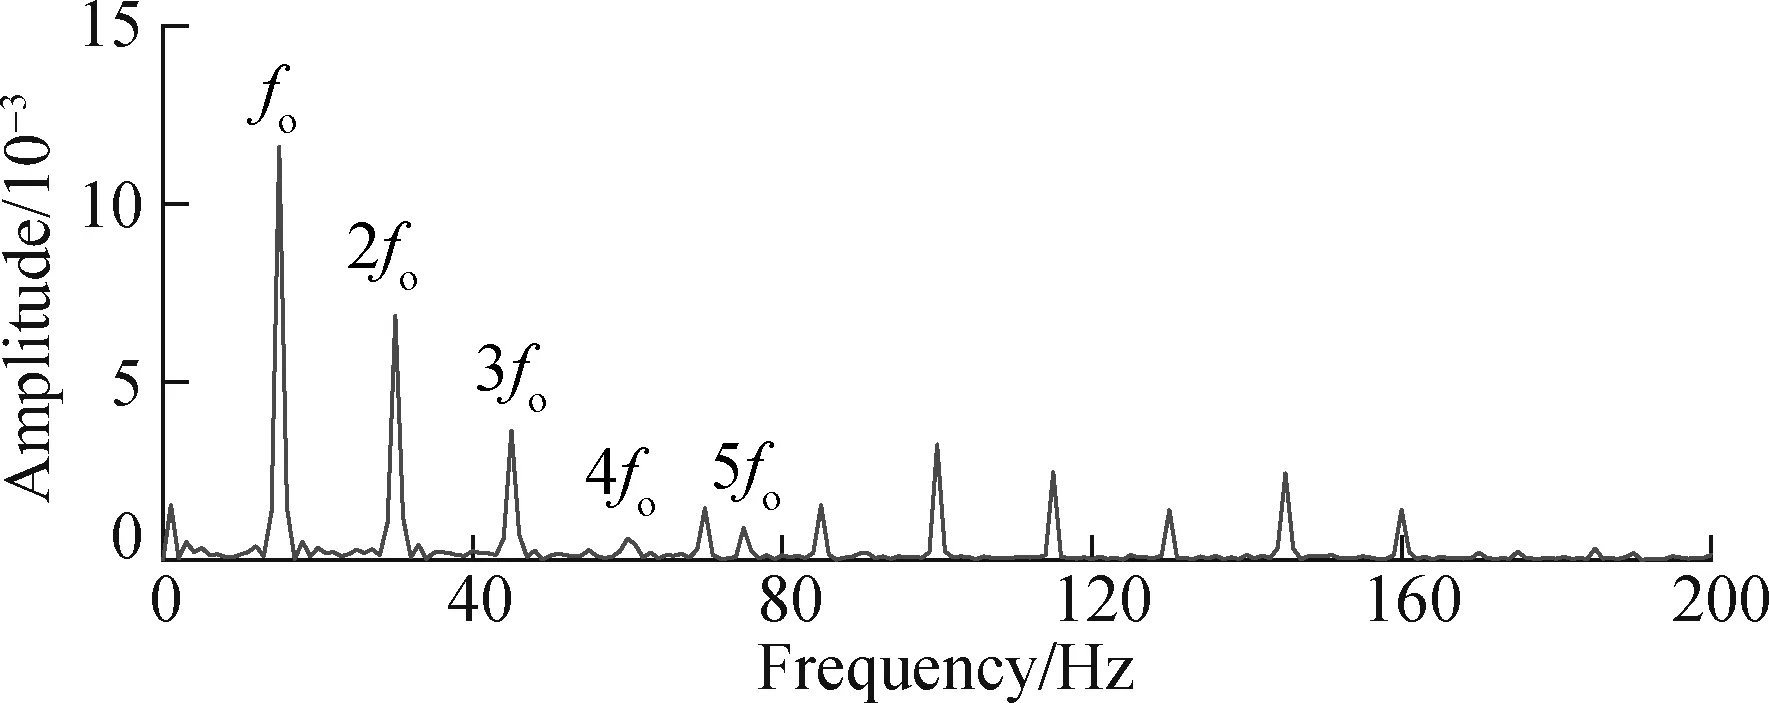
Fig.9 Envelope spectrum of wavelet detail signal d3
5 Experimental Validation
In this section, the accelerated bearing life tester (ABLT-1A), provided by the Hangzhou Bearing Test and Research Center, is adopted to further confirm the performance of the proposed method. The test rig is shown in Fig.10,which mainly consists of the loading system, lubrication system, transmission system, electrical control system, and computer monitoring system. The detailed parameters of the analyzed bearing are listed in Tab.1. The rotation speed is 1 050 r/min. The sampling frequency and length are set to be 10 240 Hz and 10 240, respectively. Moreover, the feature frequency of the bearing fault is listed in Tab.2.
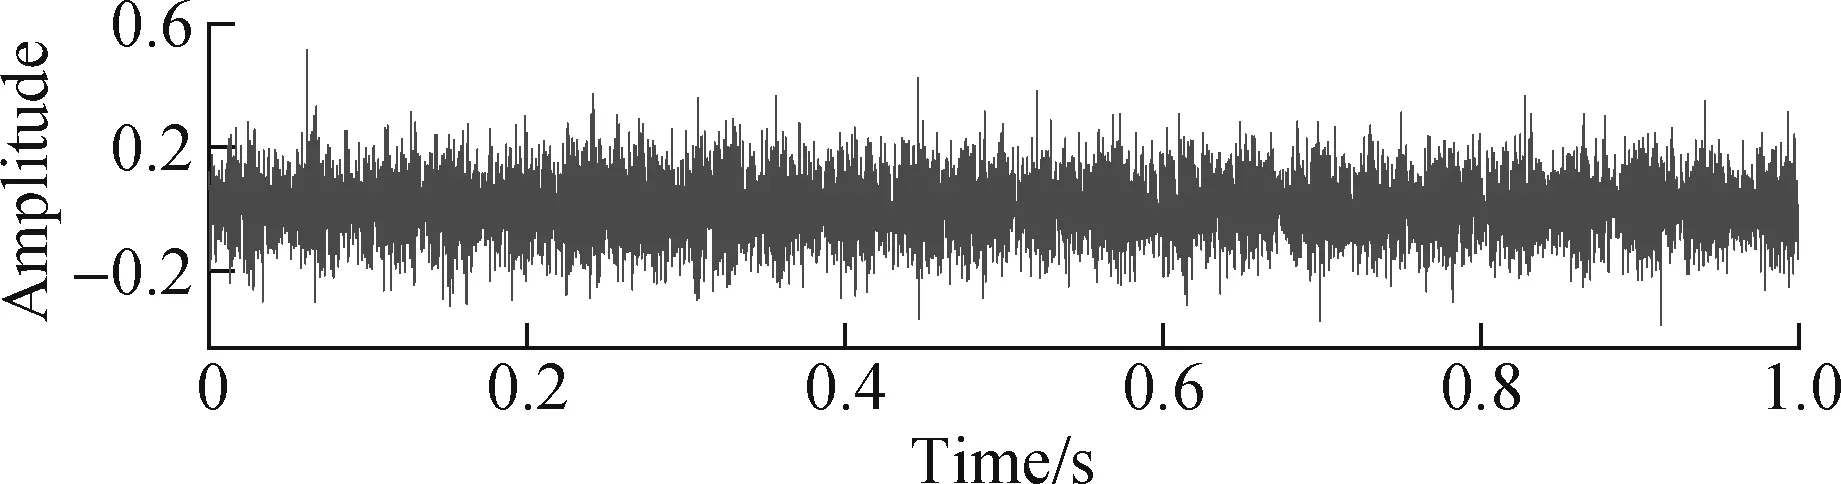
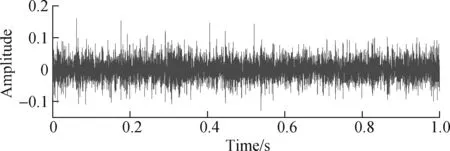
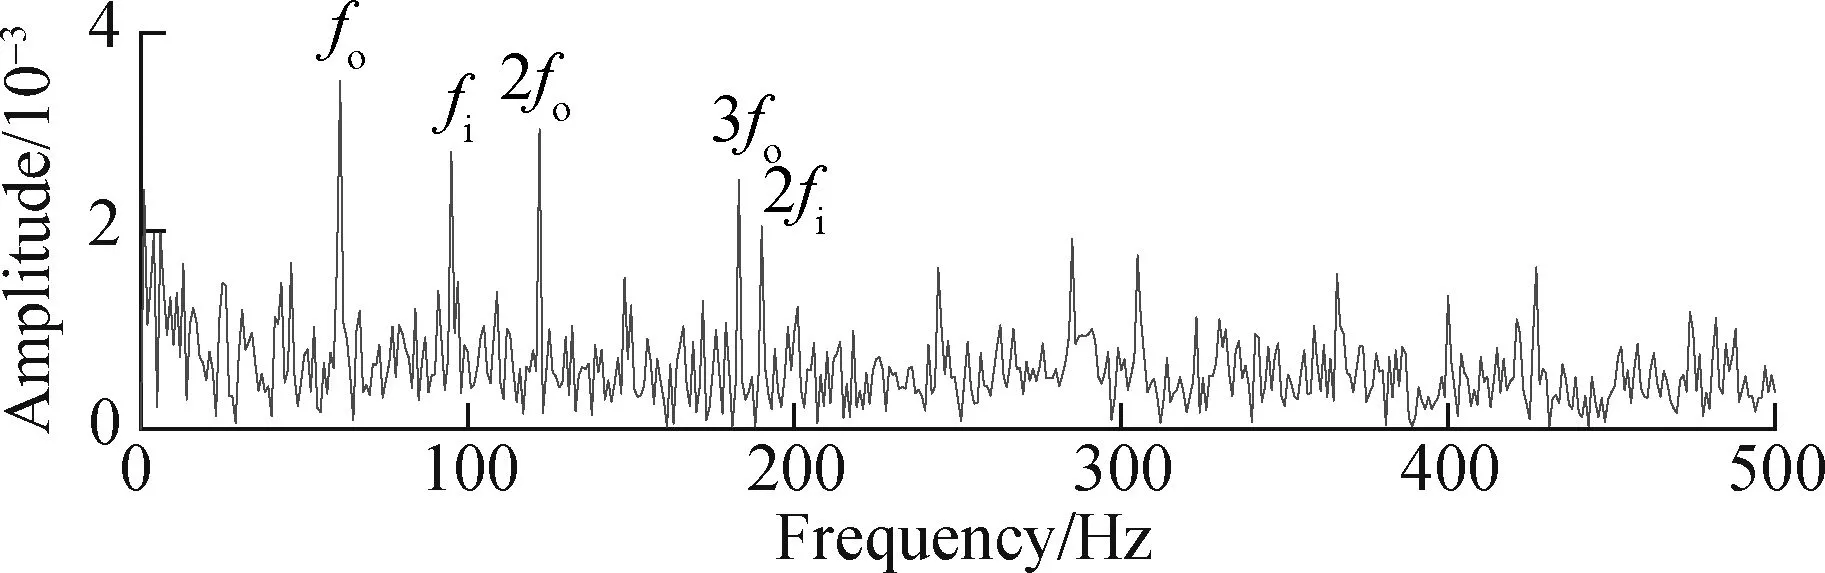
Next, the raw vibration signal of the rolling bearing with the inner and outer fault is selected for analysis, as shown in Fig.11(a). Its FFT spectrum and envelope spectrum are described in Figs.11(b) and (c), respec-tively. It can be seen that the transient impact features of the signal are overwhelmed by background noise and interference signals, and the impact phenomenon is not obvious. In the envelope spectrum, there are no prominent spectral line peaks at the feature frequenciesfoandfi. The prominent spectral line frequency and the fault feature frequency do not correspond with each other, and the fault feature extraction effect is not good.
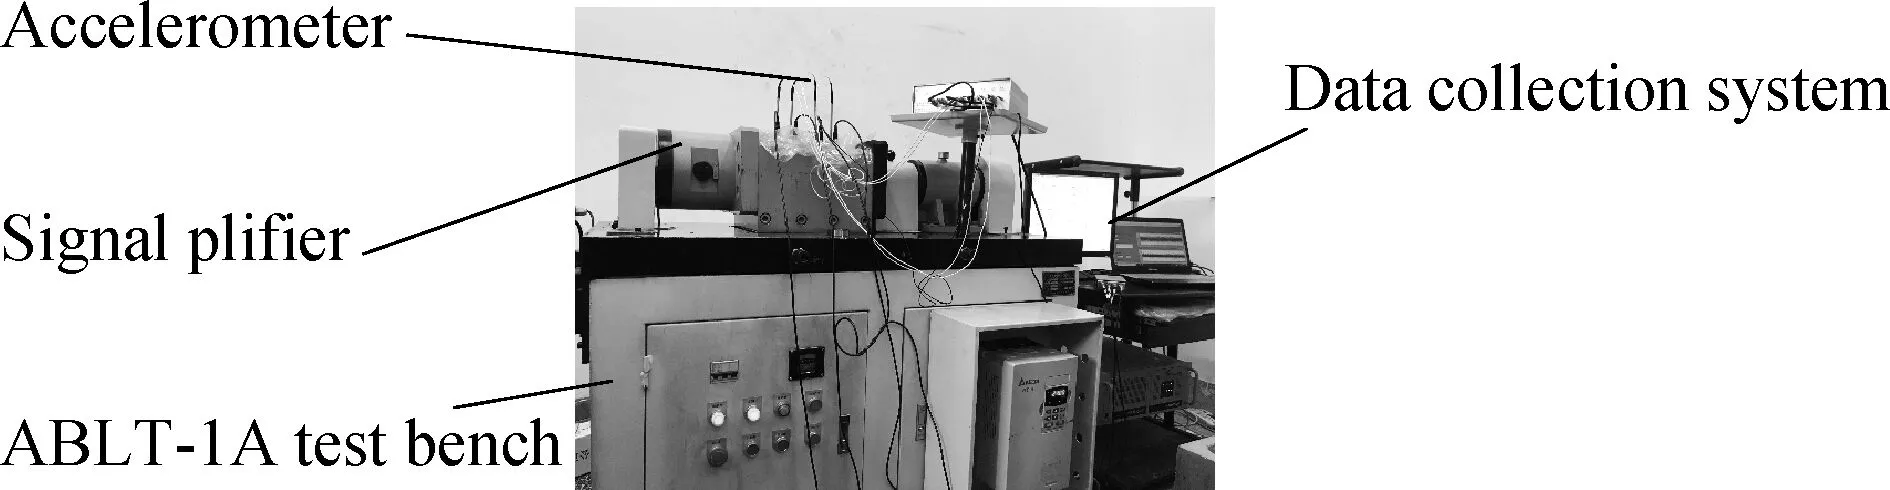
Fig.10 Experimental device
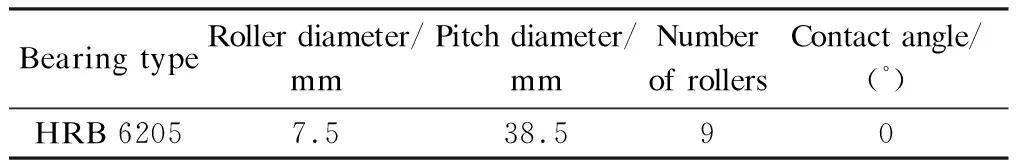
Tab.1 Parameters of the deep groove ball bearing
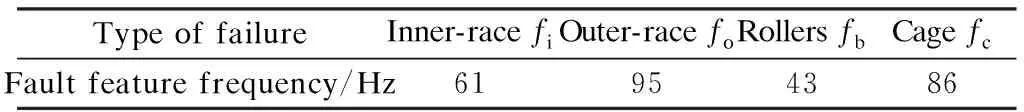
Tab.2 Rolling bearing theoretical fault feature frequency
(a)
The proposed method is therefore exploited to analyze the experimental signal and detect the rolling bearing fault. Figs.12(a) and (b) show the time-domain waveform and envelope spectrum of the pre-whitening signal of the faulty bearing, respectively. From the envelope spectrum of Fig.12(b), the fault feature frequencies of bearing inner-racefiand outer-race fault feature frequencyfocan be clearly seen.
The trajectory matrix consists of the pre-whitening signal, SGMD is performed and the symplectic geometry spectrum of matrixBis solved(as shown in Fig.13). It can be seen from the envelope spectrum of Fig.12(b) that the amplitudes of the spectral lines, where the feature frequencies of the bearing faults are arranged from large to small, arefo, 2fo,fi, 3fo, and 2fi, and the amplitudes of these frequency components ranks, respectively, the first, the second, the third, the fourth, and the sixth are in the amplitude spectrum. From the above studies in this paper, we can find that the eigenvalues corresponding to these five frequencies are the first 8 eigenvalues and the 11th to 12th eigenvalues in matrixBsymplectic geometry spectrum. The feature vectors corresponding to these feature values are selected for reconstruction. Then, the signal is recovered through diagonal averaging, and its envelope spectrum is obtained as shown in Fig.14.
(a)
(b)

Fig.13 Symplectic geometry spectrum of matrix B in SGMD
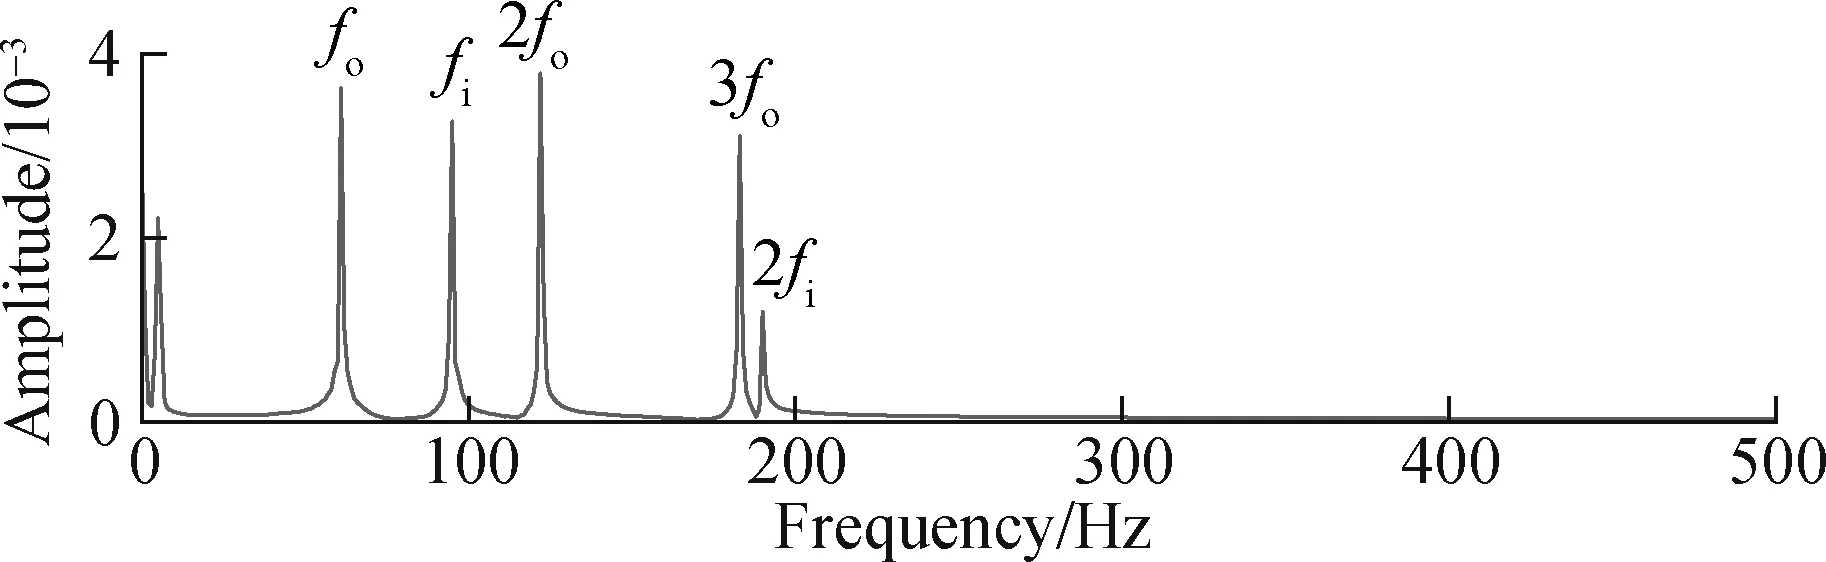
Fig.14 Envelope spectrum of SGMD reconstructed signal
From the envelope spectrum, it can be seen that the frequency component of this reconstructed signal is only the fault frequency component of the bearing, and its amplitude spectra after pre-whitening are the same. Fig.11(b) is basically the same. There are some differences caused by the effect of noise. Therefore, the fault feature frequency can be extracted from the SGMD based on the quantitative law.
For comparison, the fault feature extraction method of the wavelet-SVD difference spectrum is introduced to process the above signals. The obtained envelope spectrum is shown in Fig.15. The feature frequency of the bearing outer fault can be seen from it, which is consistent with the feature frequency of the bearing outer fault extracted by this method. This further confirms the accuracy of the proposed method in extracting bearing fault features. However, the fault features of the inner were not extracted. Through comparison, it is found that the proposed method is more effective for extracting bearing fault features.
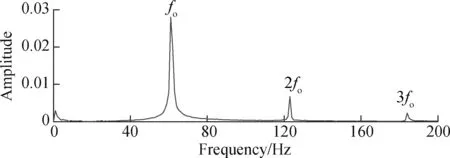
Fig.15 Envelope spectrum of wavelet detail signal d3
6 Conclusions
1) This paper proposed a bearing fault diagnosis method based on CWP and SGMD’s quantitative law. This method first processes the signal through CWP without determining the bearing resonance frequency band, and it can effectively eliminate the interference of background noise and discrete frequency components.
2) In this paper, we find that in the SGMD process, the number ofαiis twice that of the frequency components contained in the signal, and this number is applied to the feature extraction of bearing faults.
3) The initial symplectic geometric component can be effectively reconstructed by the quantitative law, and the feature frequency of the fault can be clearly extracted by Hilbert envelope spectrum analysis.
4) The performance of the proposed method is verified by the analysis of both simulated examples and an experimental signal. Furthermore, the method proposed in this paper is better than wavelet-SVD for extracting weak bearing fault features.
杂志排行

Journal of Southeast University(English Edition)的其它文章
- Intracellular temperature measurementby a dual-thermocouple difference method
- 3D heterogeneous integration of wideband RF chipsusing silicon-based adapter board technology
- A method for constraining the end effect of EMD based on sequential similarity detection and adaptive filter
- Fatigue life evaluation of girth butt weld within welded caststeel joints based on the extrapolation notch stress method
- Urban ecological sustainability assessment of the human-made system and natural system based on emergy and GIS approach
- A neural network method for estimating weighted mean temperature over China and adjacent areas