Value of shear wave elastography with maximal elasticity in differentiating benign and malignant solid focal liver lesions
2021-01-15HuiPingZhangJiYingGuMinBaiFanLiYuQingZhouLianFangDu
Hui-Ping Zhang, Ji-Ying Gu, Min Bai, Fan Li, Yu-Qing Zhou, Lian-Fang Du
Abstract
Key Words: Focal hepatic lesions; Shear wave elastography; Conventional ultrasound; Maximal elasticity
INTRODUCTION
Focal liver lesions (FLLs) are common. Accurate differential diagnosis is important for treatment and assessment of prognosis[1]. Conventional ultrasound (US), with the advantages of real-time imaging, no radiation, and low cost, is the first choice for the detection and diagnosis of FLLs[2]. The diagnostic efficiency, however, is not as good as that of computed tomography (CT) and magnetic resonance imaging (MRI).
With the development of new US techniques, especially the application of microbubbles and US elastography (UE), the diagnostic efficiency of US has been improved rapidly[3,4]. The value of contrast-enhanced US (CEUS) for the differential diagnosis of solid FLLs has been confirmed and the diagnostic efficiency of CEUS is comparable to or even better than that of contrast-enhanced CT[5].
UE is a useful tool that can provide elasticity information of tissue; a different physical property other than acoustic impedance. UE, especially shear wave elastography (SWE), which can provide elastic information quantitatively, is widely used and with promising results in the differential diagnosis of thyroid and breast nodules[6,7]. The value of SWE in the assessment of liver fibrosis is significant too[8]. However, the value of SWE for the differential diagnosis between benign and malignant FLLs is still investigational according to the guidelines of the World Federation for Ultrasound in Medicine and Biology for liver UE[9]. Previous studies of SWE for FLLs have usually used mean elasticity (Emean) as the parameter to reflect the stiffness of FLLs[10-12]. However, as tumors (especially malignant tumors) usually have inhomogeneous stiffness, maximal elasticity (Emax) has been confirmed as the best performing SWE feature for breast cancers[13]. The diagnostic value of Emax for FLLs has not yet been confirmed.
Virtual touch tissue quantification (VTQ) imaging is one kind of point SWE (pSWE) that can determine the stiffness of the tissue in a small region of interest (ROI) and be shown on screen as a VTQ value (m/s). In this study, we used VTQ imaging with Emax as the parameter to measure the stiffness of FLLs and to explore the value of SWE with Emax in the differential diagnosis of FLLs.
MATERIALS AND METHODS
Study design
This study was designed prospectively and approved by the Ethics Committee of Shanghai First People’s Hospital. Written informed consent was obtained from every patient before US examination.
Patients
Between July and December 2017, patients in the Department of General Surgery at the hospital were included if they met the following criteria: (1) Presence of one or more solid FLLs with a minimum diameter > 1 cm and a maximum depth < 8 cm shown on conventional US; (2) Patients could follow the instructions of the operator and control their breath well; and (3) VTQ imaging done successfully with 10 VTQ values after 10 consecutive measurements. The exclusion criteria were: (1) Known history of any liver surgery; (2) Known history of chemotherapy, radiotherapy, or other treatment of liver tumor; and (3) Without definite diagnosis proven pathologically or by at least two imaging methods (CEUS together with contrastenhanced CT and/or MRI in 1 wk before or after VTQ imaging). We included 104 solid FLLs in 95 patients (57 men and 38 women; aged 22-79 years; mean age 50.9 years). Fifty normal volunteers (aged 18-65 years; mean age 47.2 years) who had normal hepatic function, normal a-fetoprotein, no previous medical history of any systemic diseases, and no intrahepatic lesions examined by conventional US were included in this study as a control.
Conventional US
All the conventional US examinations were performed by a radiologist with 16 years’ experience in conventional US. An Acuson S2000 diagnostic US system (Siemens Medical Solutions, Mountain View, CA, United States) with a transabdominal convex 6C1 probe was used. The subjects were all instructed to fast for at least 8 h before the US examinations.
For the volunteers, a thorough hepatic US scan was used for the exclusion of any liver lesions, including FLLs and diffuse hepatic diseases.
For the patients, conventional US was used for the detection of solid FLLs. The location, size, shape, boundary, and echogenicity of the lesion were observed. A diagnosis as benign or malignant was made and recorded. The diagnostic values of conventional US were assessed.
VTQ imaging
The same US equipment was used for VTQ imaging after conventional US examination by another radiologist with 16 years’ experience in conventional US and 5 years’ experience in UE.
The volunteers were asked to assume a supine or left-lateral position. The probe was positioned on the skin gently with no pressure, and the volunteers were asked to hold their breath to avoid the effect of breath movement. The ROI (with fixed size as 10 mm × 5 mm) was placed at a depth of 4-6 cm, and tubular structures, such as portal veins, hepatic veins, and intra hepatic bile ducts, were carefully avoided (Figure 1A). After 10 consecutive measurements, 10 VTQ values were acquired. The largest VTQ value was recorded as Emax; the coefficient of variation (CV = mean/standard deviation) of the VTQ values was calculated and recorded.
The patients were also asked to hold their breath to avoid the effect of breath movement. The probe was positioned on the skin gently, and the ROI was placed inside the targeted FLL (Figure 1B). After 10 consecutive measurements, the largest value was recorded as Emax. The cut-off point of Emax was calculated. The diagnostic values of Emax were assessed and compared with those of conventional US.
Combined diagnosis of conventional US and Emax
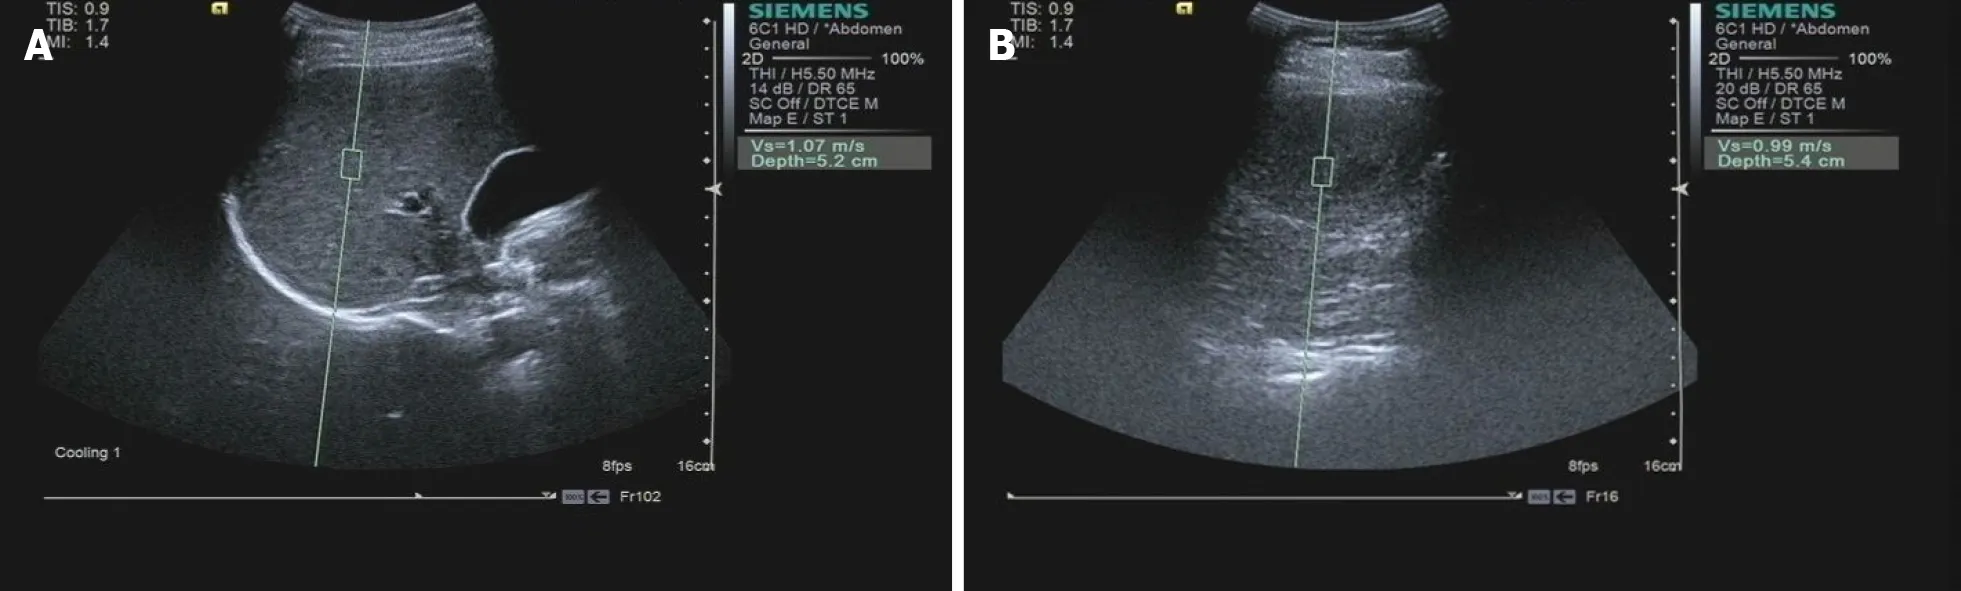
Figure 1 Region of interest in the liver in volunteers and in patients with focal liver lesions using virtual touch tissue quantification. A: Region of interest (with fixed size 10 mm × 5 mm) for the liver in volunteers was placed at a depth of 4-6 cm, and tubular structures, such as portal veins, hepatic veins and intrahepatic bile ducts were carefully avoided; B: Region of interest for patients was placed inside the targeted focal liver lesion (a hemangioma shown here).
Parallel combined diagnosis of conventional US and Emax was used to improve diagnostic sensitivity. If a lesion was diagnosed as malignant by either conventional US or Emax, the result of combined diagnosis was malignant, and the result of combined diagnosis was benign when a lesion was diagnosed as benign by both conventional US and Emax.
Statistical analysis
SPSS version13.0 software (IBM Corporation, Chicago, IL, United States) was used for statistical analysis.P< 0.05 was considered statistically significant. The data of Emax were presented as mean ± standard deviation and compared using analysis of variance and least-significant difference method. The cut-off point of Emax was calculated by a receiver operating characteristic curve. The diagnostic values of conventional US, Emax, and combined diagnosis were assessed in terms of sensitivity, specificity, positive predictive value, negative predictive value, and accuracy. The sensitivity and the specificity of Emax were compared with those of conventional US using McNemar’sχ2test.
RESULTS
Final diagnosis
There were 56 malignant and 48 benign solid FLLs. Among the malignant FLLs, 25 were hepatocellular carcinoma (HCC) and 31 were metastatic hepatic carcinoma (MHC). Among the benign solid FLLs, 35 were hemangioma, 10 were focal nodular hyperplasia (FNH), and three were regenerative nodules (RNs).
Diagnostic efficiency of conventional US
Eleven malignant FLLs were misdiagnosed as benign, and nine benign FLLs were misdiagnosed as malignant using conventional US (Table 1). The sensitivity, specificity, positive predictive value, negative predictive value, and accuracy were 80.4%, 81.3%, 83.3%, 78.0%, and 80.8%, respectively (Table 2).
Comparison of Emax among normal livers, benign FLLs, and malignant FLLs
The comparison of Emax among normal livers, benign FLLs, and malignant FLLs is shown in Figure 2. Emax values of the normal livers in volunteers were 1.15 ± 0.17 m/s and ranged from 0.79 to 1.43 m/s. CV values of the VTQ values in each volunteer ranged from 4.5% to 14.6%. Emax values of the benign FLLs were 1.30 ± 0.46 m/s. Emax values of the malignant FLLs were 3.29 ± 0.88 m/s. There were significant differences among Emax of normal livers, benign FLLs, and malignant FLLs (F= 216.304,P< 0.01). Further multiple comparisons showed significant differences between Emax values of the malignant and benign FLLs (P< 0.01) and between Emax values of the malignant FLLs and normal livers (P< 0.01). There was no significant difference between Emax values of the benign FLLs and normal liver.
Diagnostic efficiency of Emax and comparison with that of conventional US
The cut-off point of Emax was 1.945, and area under the curve (AUC) was 0.978(Figure 3). Using Emax > 1.945 for diagnosis as malignant, four malignant FLLs (one HCC and three MHCs) were misdiagnosed as benign and four benign FLLs (two hemangiomas, one FNH, and one RN) were misdiagnosed as malignant (Table 1), with sensitivity, specificity, positive predictive value, negative predictive value, and accuracy of 92.9%, 91.7%, 92.9%, 91.7%, and 92.3%, respectively (Table 2). Although the sensitivity and specificity of Emax were higher than those of conventional US (92.9%vs80.4% and 91.7%vs81.3%), the differences were not statistically significant.
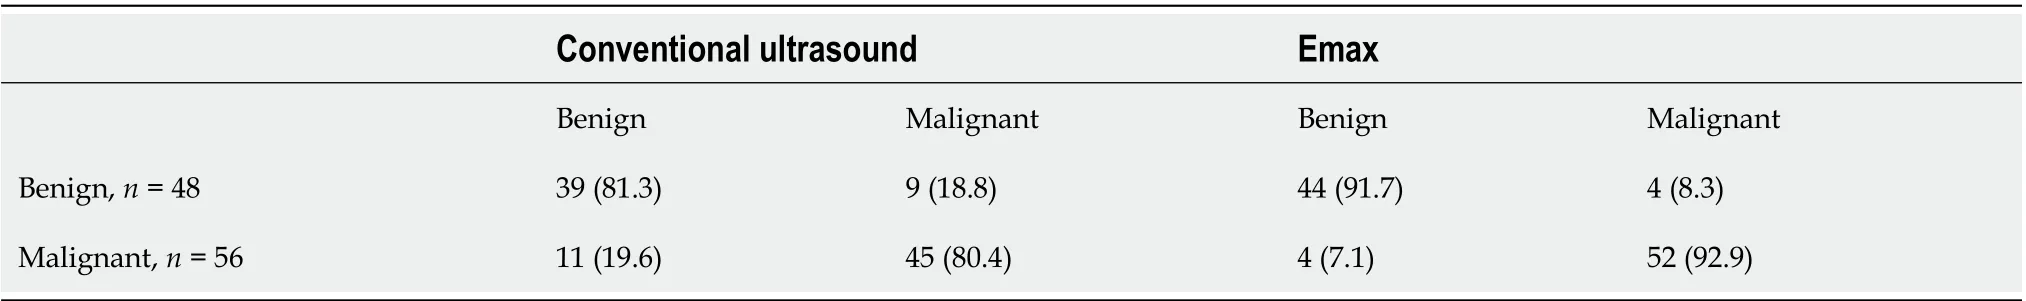
Table 1 Diagnostic results of conventional ultrasound and maximum elasticity, n (%)
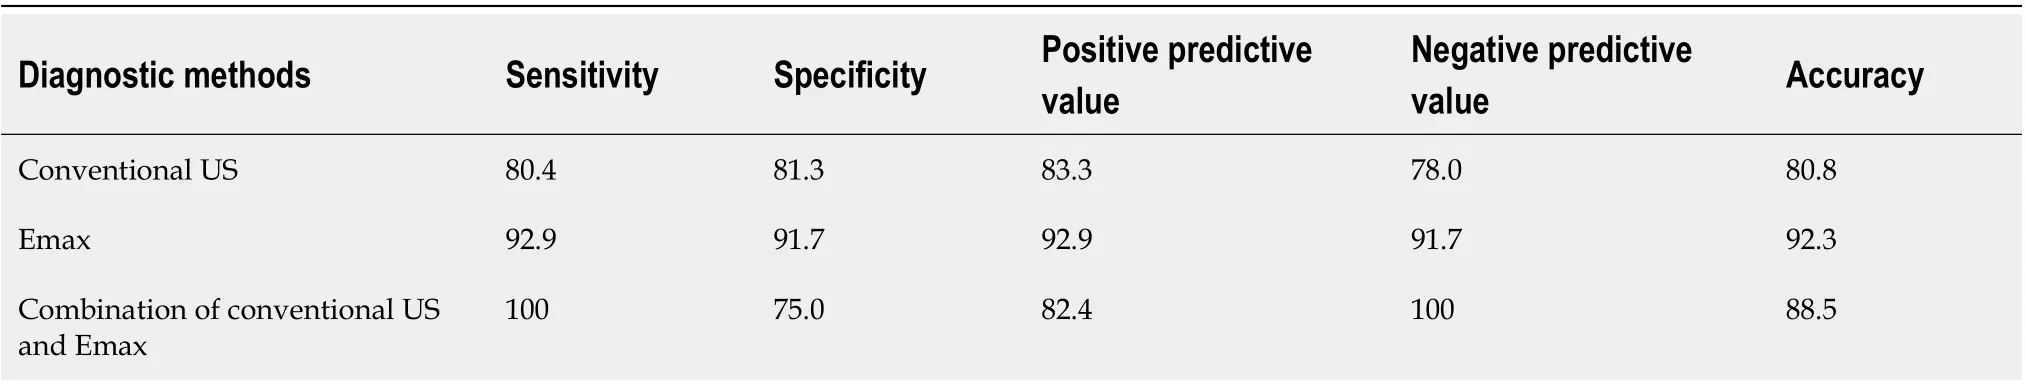
Table 2 Diagnostic efficiency of conventional ultrasound, maximum elasticity, and the combination of conventional ultrasound and maximum elasticity in differentiating benign and focal live lesions

Figure 2 Comparison of maximum elasticity among normal livers, benign focal liver lesions, and malignant focal liver lesions. bP < 0.01 compared with maximum elasticity (Emax) of benign focal liver lesions (FLLs) or normal livers. Emax of malignant FLLs were statistically significantly higher compared with Emax of benign FLLs and normal livers. There was no statistically significant difference between Emax values of the benign FLLs and normal livers.
Combined diagnosis of conventional US and Emax
The sensitivity, specificity, positive predictive value, negative predictive value, and accuracy of combined diagnosis of conventional US and Emax using parallel test were 100%, 75%, 82.4%, 100%, and 88.5%, respectively (Table 2).
去年7月24日,中央纪委通报:陈传书担任民政部下属单位主要负责人期间,工作严重失职失责,监督管理不力,对有关问题的发生负有主要领导责任,受到留党察看一年、行政撤职处分,降为正局级非领导职务。
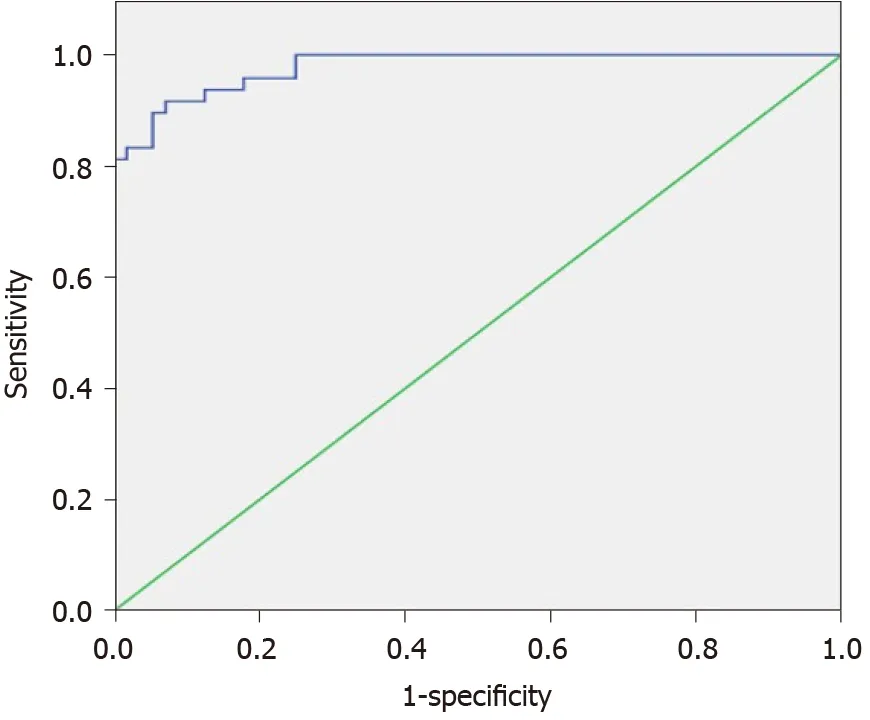
Figure 3 Receiver operating characteristic curves of maximum elasticity for malignant and benign focal liver lesions.
DISCUSSION
We explored the value of SWE with Emax as a parameter in the differential diagnosis of solid FLLs. Our results show that SWE is a convenient and easy method that can provide accurate stiffness information of solid FLLs, and Emax is useful for the differential diagnosis of FLLs.
SWE, including VTQ imaging as pSWE, has been proven to be a useful and accurate method for the assessment of liver stiffness[14-16]. In this study, 50 volunteers with normal hepatic function and without any intrahepatic lesion were included as controls. Our results showed that CVs of the VTQ values in each volunteer were between 4.5% and 14.6%, which proved that VTQ imaging could provide reliable and reproducible quantitative information.
Although the value of SWE for solid FLLs has not yet been determined definitively, some studies have used VTQ imaging to differentiate between benign and malignant FLLs[10,11]. Akdoğanet al[10]reported that there were significant differences in VTQ values between malignant and benign FLLs. A VTQ value of 2.32 m/s was used as a cut-off value to differentiate malignant liver masses from benign ones, and the sensitivity, specificity, and AUC were 0.93, 0.60, and 0.826, respectively. Sunet al[11]also showed that VTQ values of malignant tumors were significantly higher than those of benign tumors, with a cut-off of 1.60 m/s and AUC of 0.851. This diagnostic efficiency was not good enough to meet clinical requirements. In these two studies, Emean, the performance of which was not as good as Emax for breast cancer, was used as the parameter to assess the stiffness of each FLL. In our study, we used Emax as the parameter, and a promising result was achieved (sensitivity 92.9%, specificity 91.7%, and AUC 0.978).
Although shear stiffness is an important feature of malignant tumors[17-19], there were still four malignant FLLs among the 56 that were misdiagnosed as benign in our study. One confusing result in our study was that for a patient with multiple liver metastases from breast cancer, the Emax values of three targeted metastases were not similar (4.01, 4.31, and 1.73, respectively). One probable reason was that tumor size may have affected its stiffness. There may be other reasons for the inconsistency and misdiagnosis and further studies are needed.
Conventional US is the prerequisite and foundation of SWE. The sensitivity and specificity of conventional US were 80.4% and 81.3%, respectively, in our study. When combined with Emax, the sensitivity was improved to 100% with no false-negative results. This reduced significantly the rate of missed diagnosis and avoided delay of further diagnosis and treatment for malignant FLLs. Compared with CEUS, VTQ imaging is easier to operate and interpret, and cheaper, with no risk of allergy caused by contrast agents. With all these advantages and excellent diagnostic efficiency, it makes VTQ imaging a good choice for the differential diagnosis of FLLs.
There were some limitations to our study. First, the sample number was not large enough for the comparison of Emax among different pathological types of FLLs. Second, because of the technical limitation of VTQ imaging, only FLLs with a minimum diameter > 1 cm and a maximum depth < 8 cm could be assessed. The ROI could not be placed directly in the area with highest stiffness of a tumor. Further studies with a larger sample number and improved techniques are needed to confirm our results.
CONCLUSION
In conclusion, SWE is a convenient and easy method that can provide accurate stiffness information of solid FLLs. Emax is useful for the differential diagnosis of FLLs, and combined with conventional US, the diagnostic efficiency is improved.
ARTICLE HIGHLIGHTS


猜你喜欢
杂志排行

World Journal of Gastroenterology的其它文章
- Evolving role of artificial intelligence in gastrointestinal endoscopy
- Contrast-enhanced ultrasound in association with serum biomarkers for differentiating combined hepatocellular-cholangiocarcinoma from hepatocellular carcinoma and intrahepatic cholangiocarcinoma
- Colonic vitamin D receptor expression is inversely associated with disease activity and jumonji domaincontaining 3 in active ulcerative colitis
- Prevalence and risk factors of nonalcoholic fatty liver disease in patients with inflammatory bowel diseases: A cross-sectional and longitudinal analysis
- Prognostic value of the preoperative fibrinogen-to-albumin ratio in pancreatic ductal adenocarcinoma patients undergoing R0 resection
- Infliximab is effective in the treatment of ulcerative colitis with dermatomyositis: A case report