Prognostic value of changes in serum carcinoembryonic antigen levels for preoperative chemoradiotherapy response in locally advanced rectal cancer
2021-01-13ChinockCheongJunSangShinKwangWookSuh
Chinock Cheong, Jun Sang Shin, Kwang Wook Suh
Abstract
Key Words: Rectal cancer; Neoadjuvant chemoradiation therapy; Carcinoembryonic antigen levels; Prognostic factor; Change in serum carcinoembryonic antigen; Response of chemoradiotherapy
INTRODUCTION
Preoperative chemoradiotherapy (CRT) is a standard treatment modality for locally advanced rectal cancer (LARC) based on findings from randomized controlled trials[1-3]. Advances in CRT and surgical modalities have resulted in better oncologic outcomes for rectal cancer, including a local recurrence rate of < 10%. However, CRT alone cannot improve overall survival[1]and treatment response to CRT can vary from pathologic complete response (pCR) to disease progression[4]Tumor sensitivity to CRT causes tumor regression after delayed surgery; approximately 40% of patients with CRT-sensitive tumors achieve partial response, and 8%–20% achieve pCR[4-6]. However, approximately 20% of patients with CRT-resistant tumors show disease progression[4]. Therefore, predictive factors for treatment response are needed to identify patients who will benefit from CRT.
Serum carcinoembryonic antigen (CEA) is an established biomarker for predicting prognosis and monitoring progression of colorectal cancer. Several studies have shown that the pretreatment serum level of CEA is associated with post-CRT pCR, down-staging, and survival (Table 1)[7-12]. However, previous studies focused on the fact that patients with higher pretreatment CEA (> 5 ng/mL) have poor prognosis and did not concentrate with the change of CEA levels.
We theorized that variations in prognosis may be observed if patients are classified by pre- to post-CRT changes in CEA levels. Early identification of poor responders or patients with tumor resistance to CRT will allow clinicians to provide more aggressive treatment, such as intensified chemotherapy.
Therefore, in this study, we evaluated whether CEA levels change from before to after CRT and analyzed the relationship between serum CEA and treatment response to CRT. We investigated the effect of preoperative CEA level before and after CRT on treatment response to CRT in patients with LARC.
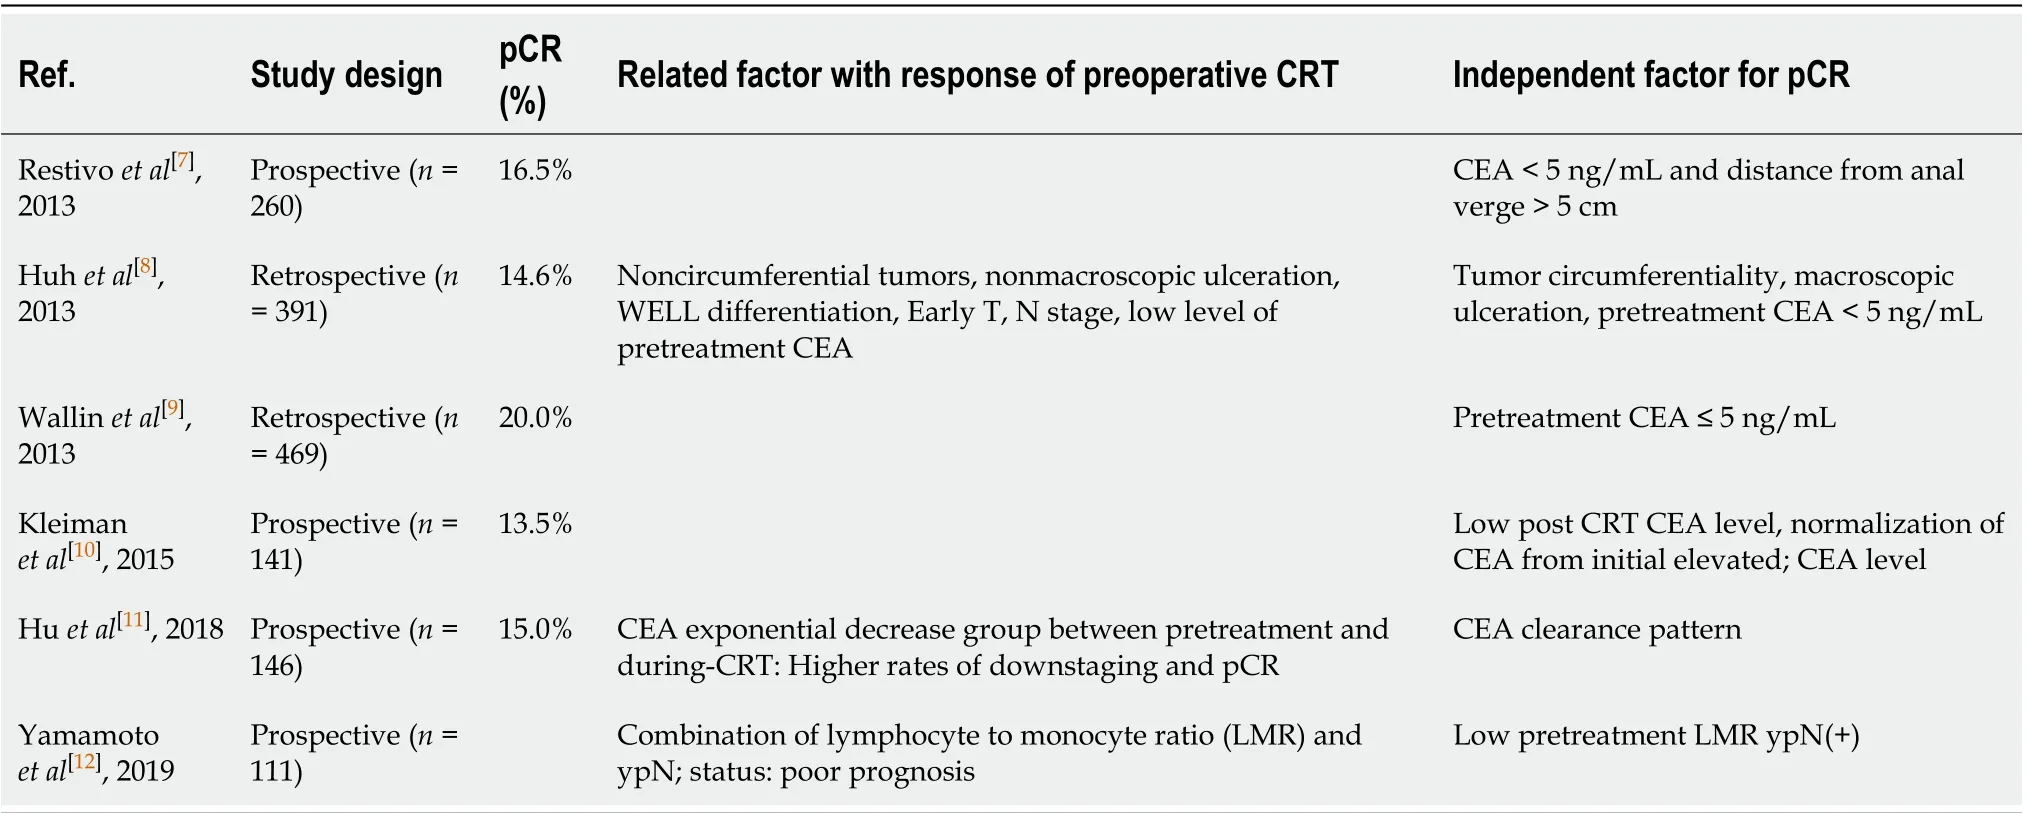
Table 1 Predictive factor for response of preoperative chemoradiation therapy for rectal cancer in the literature
MATERIALS AND METHODS
Patients and ethical considerations
We retrospectively evaluated the medical data of 145 patients who were diagnosed with rectal adenocarcinoma and underwent preoperative CRT and curative resection at Ajou Hospital between January 2011 and December 2017. Based on the clinical stage, such as in the case of clinical T3 or T4 tumors, node-positive disease, and suspected diagnosis of invasion into the mesorectal fascia on preoperative imaging, some patients with advanced rectal cancer were offered concomitant CRT. We excluded patients with synchronous distant metastasis, clinical stage T2 disease, or without post-treatment magnetic resonance imaging (MRI). We included 135 patients in the final study sample. Long-course preoperative CRT was carried out with a total radiation dose of 5040 cGy delivered in 25 fractions over 5 wk; neoadjuvant chemotherapy with 5-fluorouracil and leucovorin was administered during the first and fifth weeks of radiotherapy. Patients were divided into three groups according to pre- and post-CRT serum CEA levels above/below 5 ng/mL. Groups A, B, and C comprised patients with pre- and post-CRT CEA levels > 5; > 5 and ≤ 5, and ≤ 5 ng/mL, respectively. This study was approved by the Institutional Review Board of Ajou Hospital (approval number: MED-MDB-18-329), and the need for informed consent was waived in view of the retrospective study design.
Evaluation of tumor and treatment response
All patients were preoperatively evaluated by physical examination, colonoscopy, abdominopelvic computed tomography (APCT), chest CT, pelvic MRI, and routine laboratory tests, including serum CEA measurements. The tumor location was defined as the distance from the anal verge (AV) to the lowest margin of the tumor on MRI or sigmoidoscopy. Treatment response to CRT was assessed using APCT, pelvic MRI, sigmoidoscopy, and routine laboratory tests at 4–5 wk after CRT. Surgery was performed 6–8 wk after CRT and included low anterior resection with colorectal or coloanal anastomosis, abdominoperineal resection, Hartmann’s operation, and total proctocolectomy. Pathologic results were reported according to the Seventh American Joint Committee on Cancer TNM staging system. Treatment response to CRT and tumor regression grade (TRG) were evaluated by experienced pathologists at the study center in accordance with the American Joint Committee on Cancer TRG system[13,14].
Statistical analysis
Continuous variables were analyzed using the Student’st-test and analysis of variance, and data are presented as mean ± SD or medians with ranges. Categorical variables were analyzed using the chi-square or Fisher’s exact test. The optimal cutoff values for neutrophil–lymphocyte ratio (NLR) and platelet–lymphocyte ratio (PLR) were calculated using receiver operating characteristic (ROC) analysis. The cutoff value was determined by the point on the ROC curve with the minimum distance from the 0% false-positive rate and 100% true-positive rate. Multivariate analyses for pCR or good response were undertaken using multiple logistic regression. The Kaplan–Meier method and log-rank test were used to analyze disease-free survival (DFS) and overall survival. All analyses were conducted in R packagevs3.6.2 (R Foundation for Statistical Computing, Vienna, Austria). APvalue < 0.05 was considered statistically significant.
RESULTS
Patient characteristics
Data from 135 patients [men,n= 99 (73.3%); age, 60.1 ± 10.9 (mean ± SD) years] were included in the final analysis; 34.1% (n= 46) of the patients were smokers. The mean (SD) pre-CRT tumor size was 4.6 (± 1.4) cm on MRI images, and tumor distance from AV was 6.4 (± 3.0) cm. The mean serum CEA level was significantly reduced from 18.1 to 4.8 ng/mL after CRT (Table 2).
Intergroup comparisons
Groups A, B, and C comprised 27, 43, and 65 patients, respectively. Intergroup comparisons of baseline parameters, such as age, sex, pre-CRT size of tumor, and clinical T stage, based on change in the CEA level from before to after CRT showed no significant differences. However, the analysis showed large intergroup differences in the pre-CRT CEA level [mean (range): Group A, 25.8 (10.6–70.7)vsGroup B, 11.3 (6.8–21.3)vsGroup C, 2.4 (1.8–3.3);P< 0.001]. Post-CRT CEA levels dramatically decreased in each group but was significantly different for Group A [A, 8.4 (6.0–13.7)vsB, 2.9 (2.0–4.0)vsC, 1.8 (1.2–2.9);P< 0.001]. The cutoff values of NLR and PLR for pCR were determined as 2.8 and 138.2, respectively, and there were no intergroup differences (P= 0.983,P= 0.132). Moreover, the ratio of post-CRT down-staging was lower in Group A than in groups B and C (A, 22.2%vsB, 41.9%vsC, 55.4%;P= 0.013; Table 3).
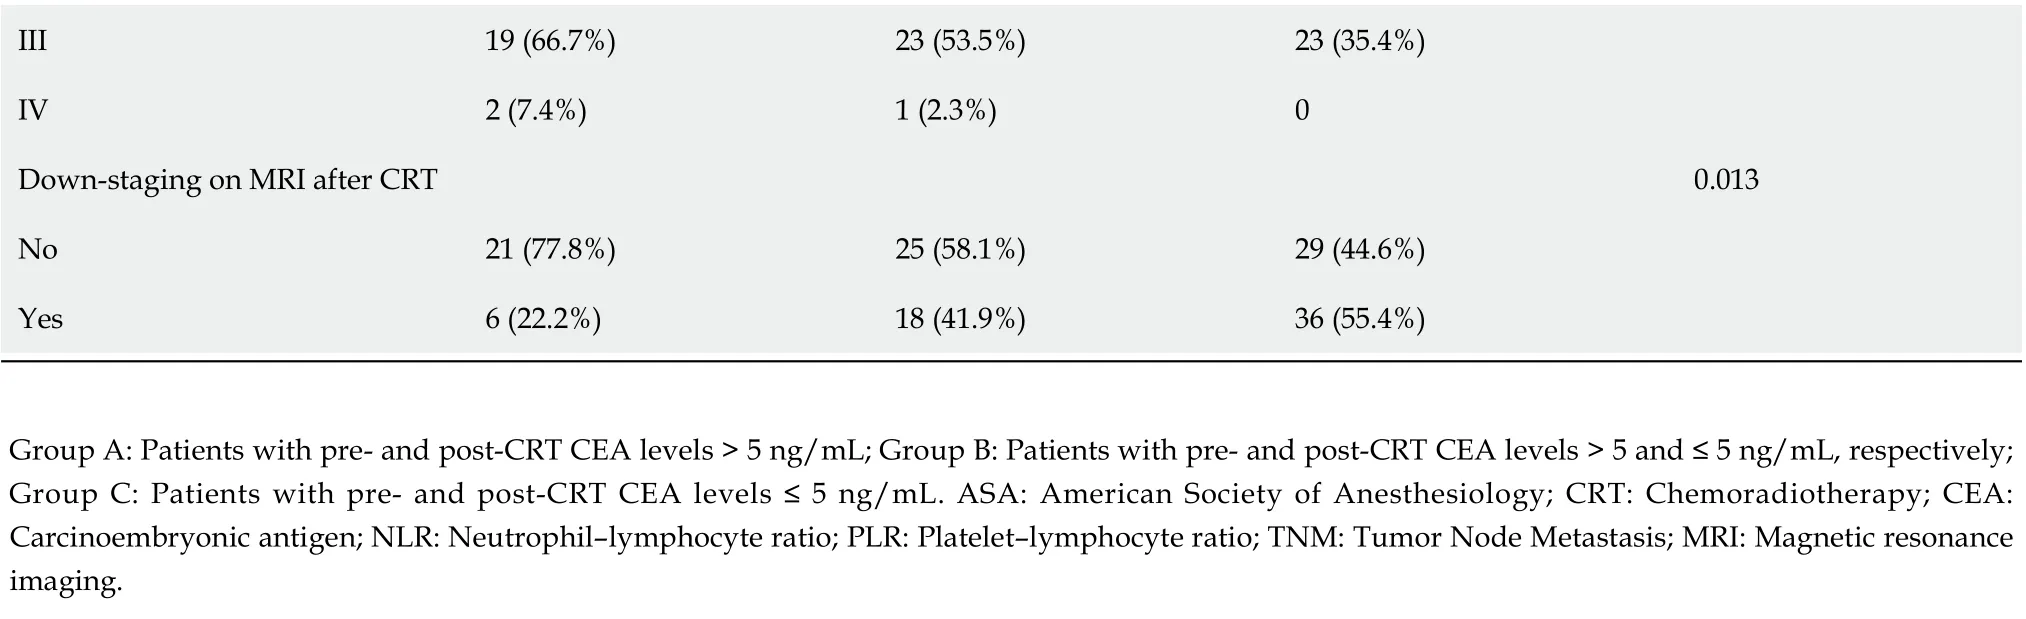
After preoperative CRT, three patients were clinically suspected to have distant metastasis on evaluation with APCT or chest CT (Table 3). One patient in Group B was confirmed to have no distant metastasis after curative resection. Intraoperatively, one patient in Group A was found to have liver metastasis, which was not detected on preoperative imaging (Table 4). TRG showed that the response of CRT was superior in groups B and C than in Group A [TRG, 0, 1: A, 8 (29.6%)vsB, 26 (60.5%)vsC, 44 (67.7%);P= 0.003]. Moreover, the ratio of pCR was significantly higher in Group C (A, 0%vsB, 4.7%vsC, 38.5%;P< 0.001; Table 4).
Comparisons between the non-pCR and pCR groups showed a lower ratio of pre-CRT CEA > 5 ng/mL in the pCR group than in the non-pCR group (P<0.001). All patients with pCR did not show post-CRT CEA levels > 5 ng/mL (non-pCR: 25.7%vspCR: 0%;P=0.008).The pCR group had a higher ratio of down-staging after CRT, but the finding was not significant (P= 0.051). There were no patients with lymphovascular or perineural invasion in the pCR group, and the distribution of differentiation after operation was similar between the study groups (Table 5).
Prognostic markers
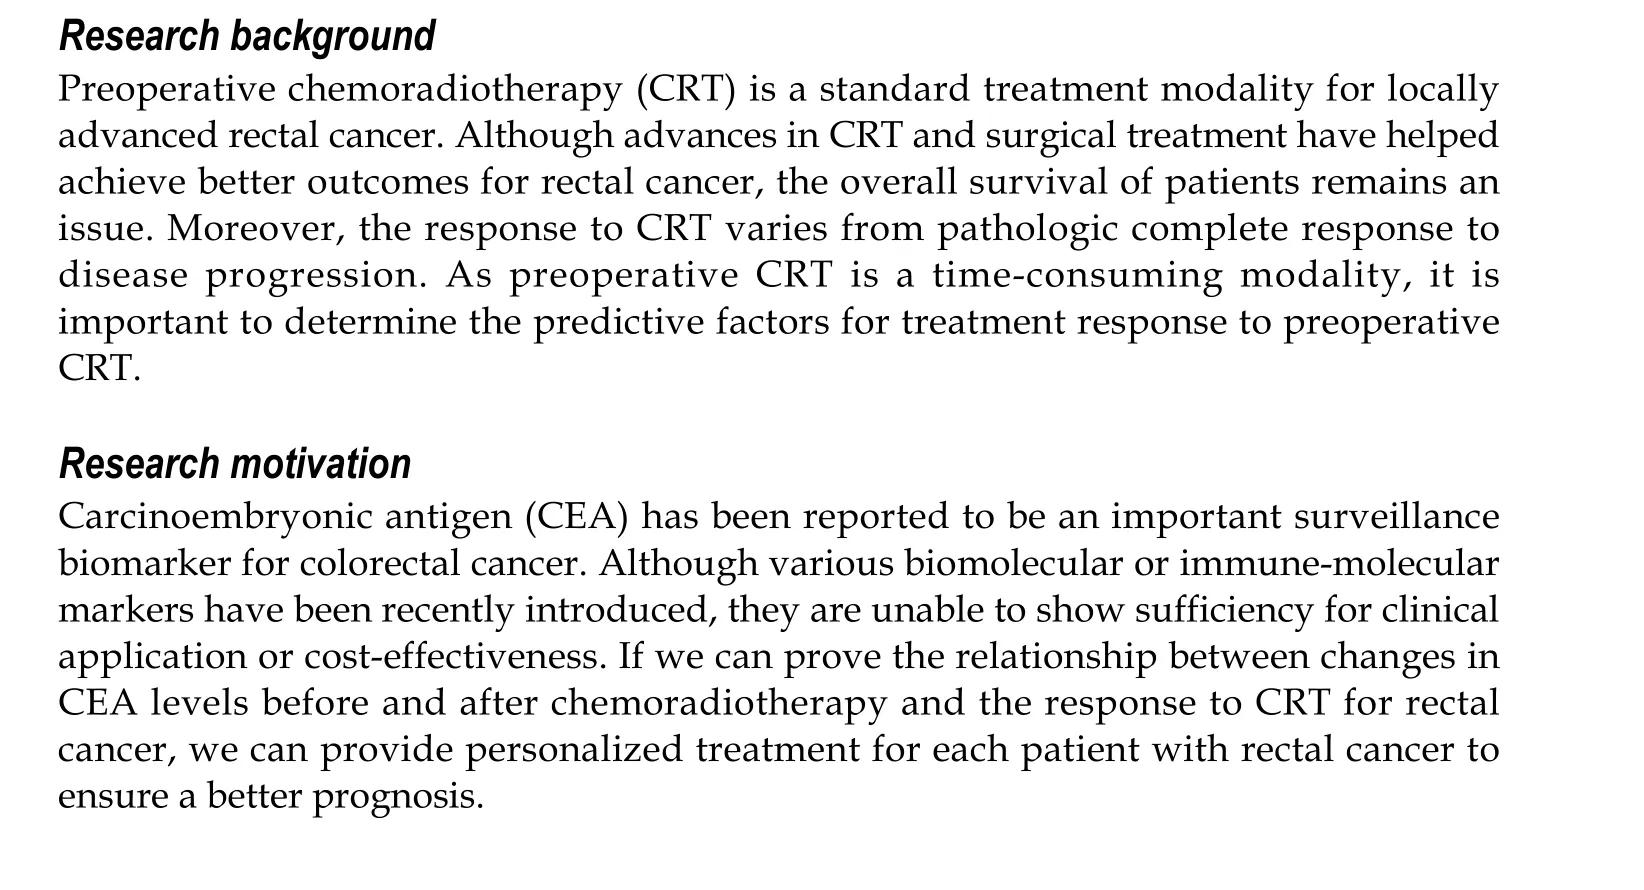
Multivariate analysis showed that sex (OR: 0.26, 95%CI: 0.08–0.80;P= 0.022), pre-CRT CEA levels ≤ 5 ng/mL (OR: 18.71, 95%CI: 4.62–129.51;P< 0.001), pre-CRT NLR < 2.8 (OR: 5.27, 95%CI: 1.55–22.55;P= 0.013), and post-CRT T stage < 3 (OR: 3.25, 95%CI: 1.09–9.97;P= 0.036) were prognostic markers for pCR. Meanwhile, post-CRT CEA levels ≤ 5 ng/mL (OR: 5.07, 95%CI: 1.92–14.83;P= 0.002) and well or moderate differentiation (OR: 3.41, 95%CI: 1.35–9.48;P= 0.013) were associated with good response. Pre-CRT NLR < 2.8 and post-CRT T stage < 3 were common prognostic factors in pCR and good response (Table 6). Despite no differences in the 5-year DFS between groups A, B, and C, we found that Group A showed a tendency of worse survival than the other study groups (Figure 1A;P= 0.145). Furthermore, the 5-year overall survival was significantly lower in Group A (Figure 1B;P= 0.005).
DISCUSSION
This study aimed to identify the clinical factors associated with treatment response toCRT for rectal cancer. Our findings showed that pre-CRT CEA was a prognostic factor for pCR. Patients with preoperative serum CEA levels ≤ 5 ng/mL showed a good treatment response, with 20.0% of patients achieving pCR. Moreover, pre- and post-CRT CEA levels ≥ 5 ng/mL were independently associated with a good response. Patients without changes in CEA levels (pre- and post-CRT CEA > 5 ng/mL) after CRT showed a lower ratio of down-staging and poor results in terms of TRG.

Table 2 Patient characteristics
Serum CEA is a well-known prognostic factor and has been used as a surveillance marker for colorectal cancer[15-17]. Several studies have shown that patients with rectal cancer with positive preoperative CEA levels (> 5 ng/mL) have poor outcomes, thereby indicating the prognostic significance of serum CEA for colorectal cancer[18-20]. Moreover, other studies have reported that the post-CRT serum CEA is related to andis a predictive factor for treatment response[17-19]. Preoperative CRT has been established as a standard treatment for LARC. However, treatment response to CRT varies from clinical complete response to resistance or progression. An individualized treatment strategy based on treatment response to CRT may be helpful to optimize outcomes for patients with LARC. Thus, prognostic factors to predict treatment response are needed.
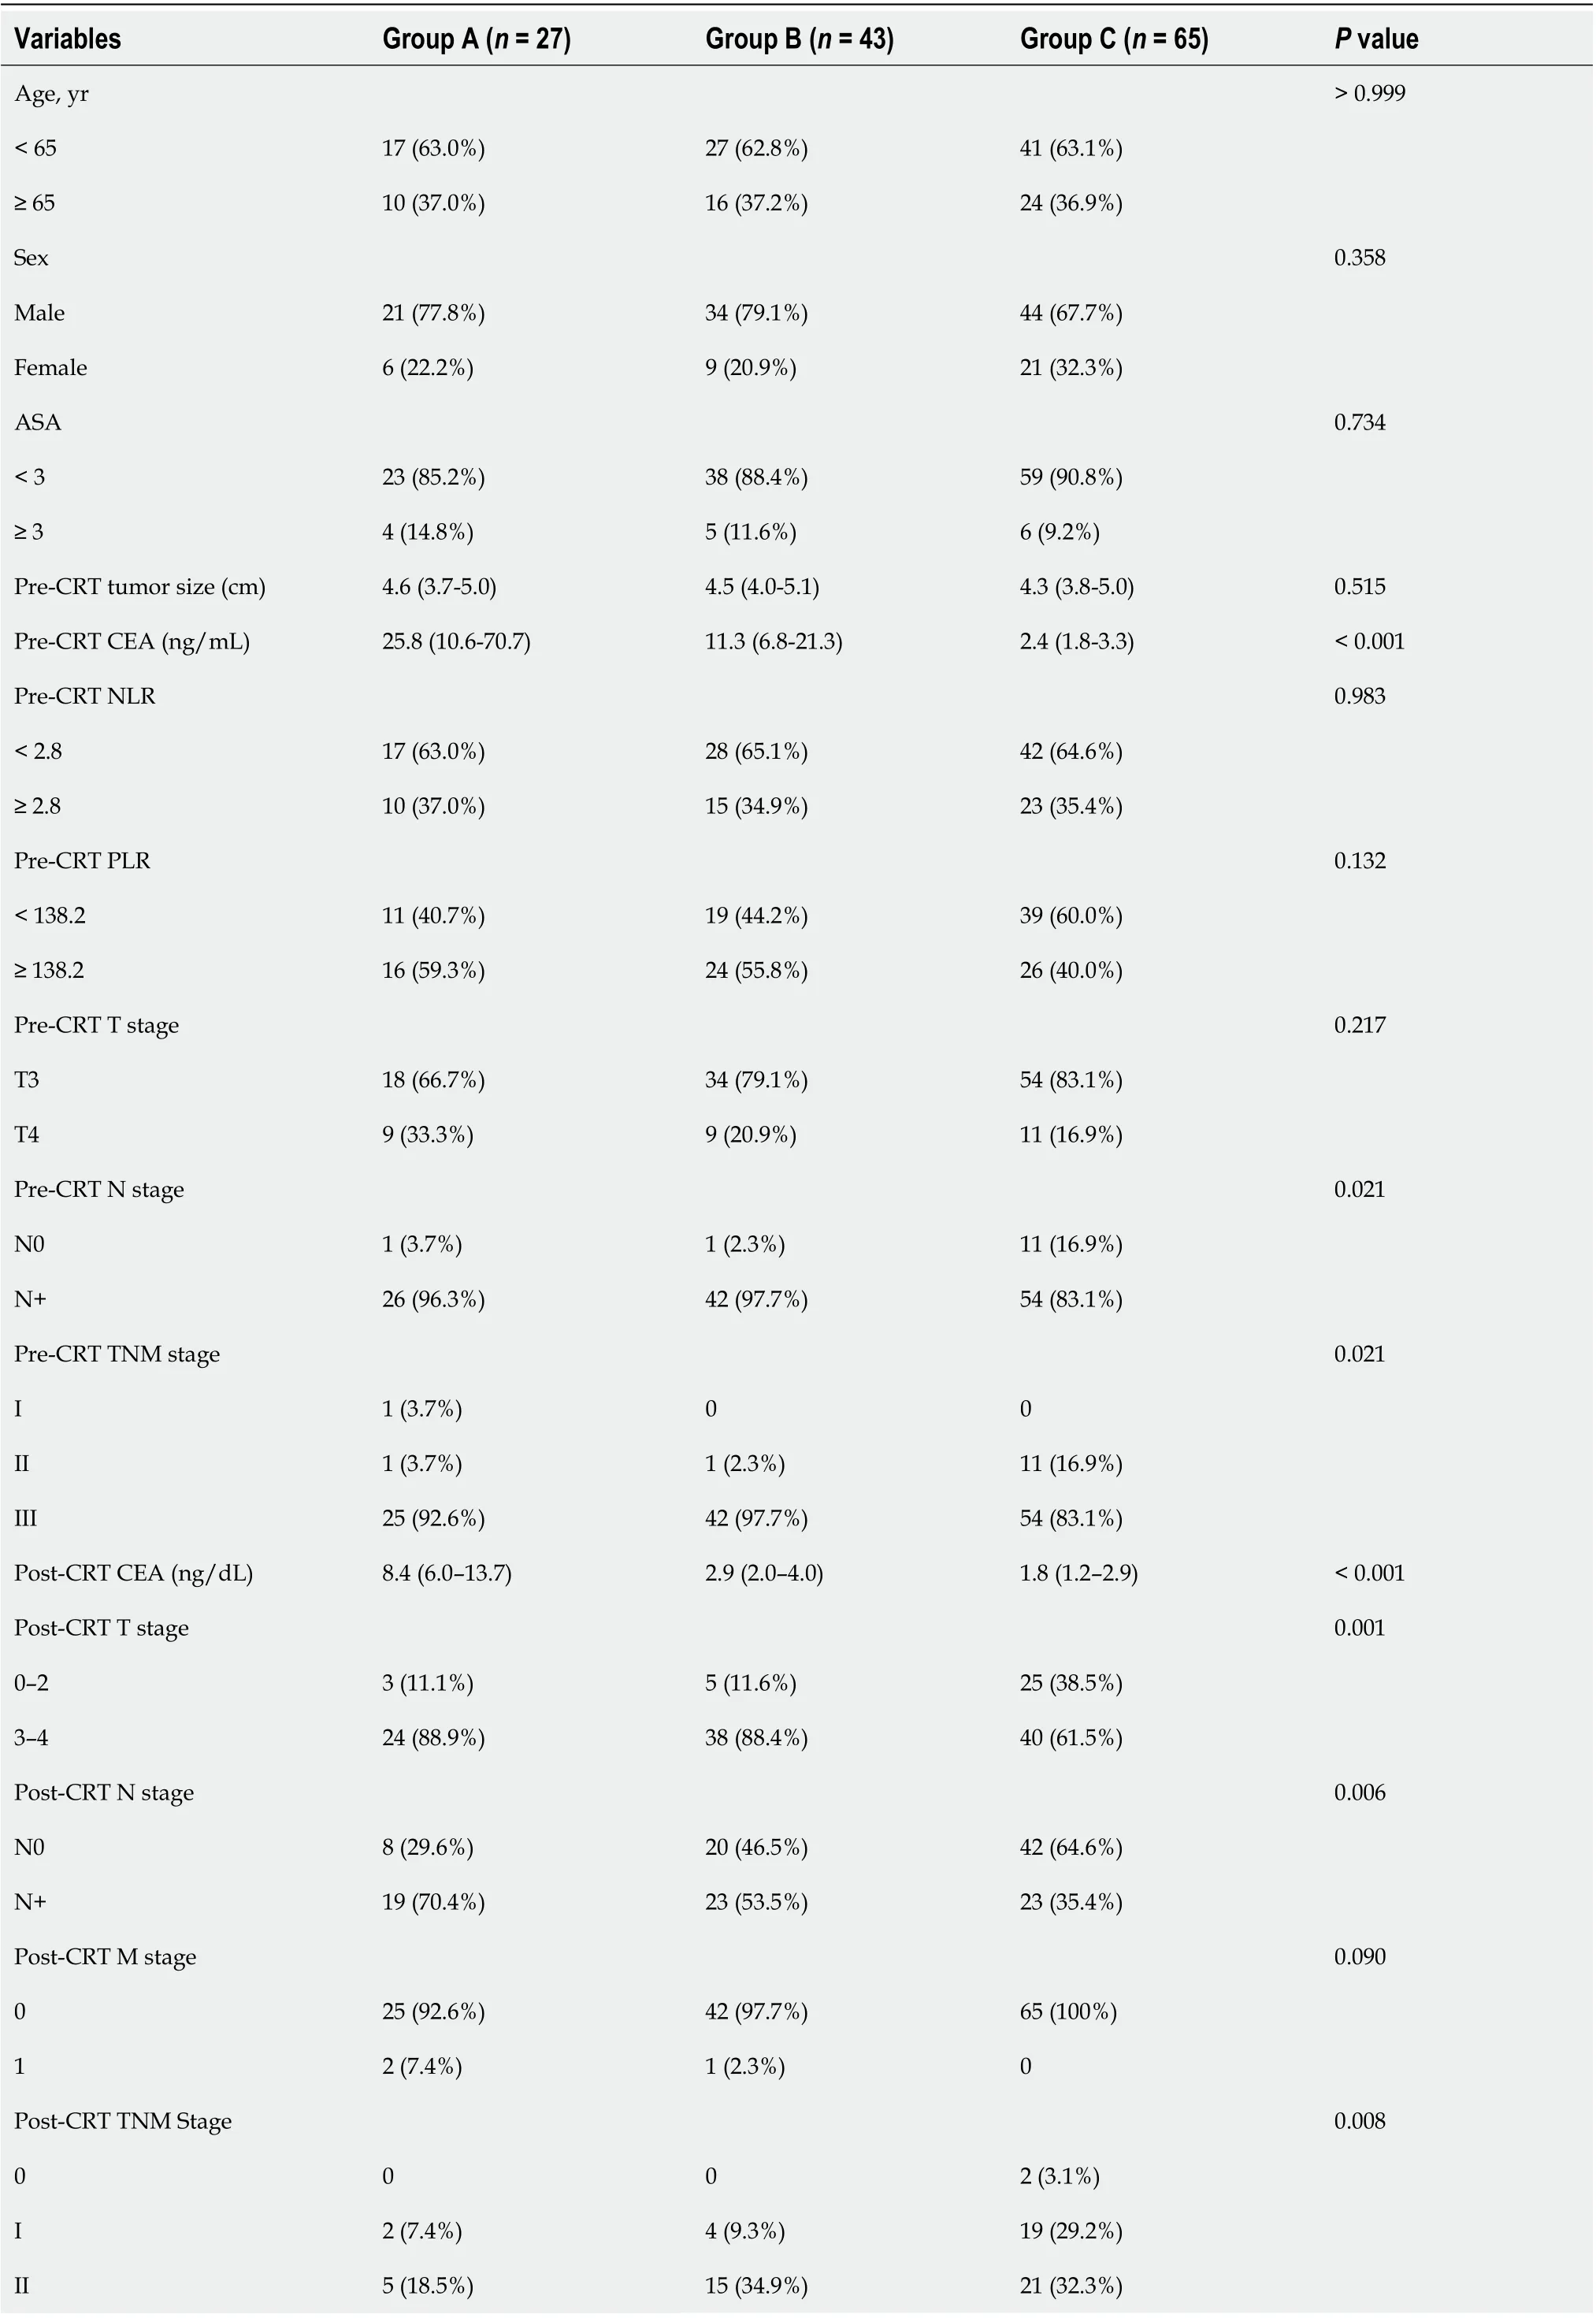
Table 3 Comparison of the changes in the carcinoembryonic antigen level before and after chemoradiotherapy
III 19 (66.7%)23 (53.5%)23 (35.4%)IV 2 (7.4%)1 (2.3%)0 Down-staging on MRI after CRT 0.013 No 21 (77.8%)25 (58.1%)29 (44.6%)Yes 6 (22.2%)18 (41.9%)36 (55.4%)Group A: Patients with pre- and post-CRT CEA levels > 5 ng/mL; Group B: Patients with pre- and post-CRT CEA levels > 5 and ≤ 5 ng/mL, respectively; Group C: Patients with pre- and post-CRT CEA levels ≤ 5 ng/mL. ASA: American Society of Anesthesiology; CRT: Chemoradiotherapy; CEA: Carcinoembryonic antigen; NLR: Neutrophil–lymphocyte ratio; PLR: Platelet–lymphocyte ratio; TNM: Tumor Node Metastasis; MRI: Magnetic resonance imaging.
Several studies have reported predictors of treatment response to preoperative CRT for LARC. Restivoet al[7]suggested that pretreatment CEA levels and tumor distance from the AV were predictors of treatment response to CRT for rectal cancer. Huhet al[8]reported that pretreatment CEA levels, tumor circumferentiality, and macroscopic ulceration on rigid sigmoidoscopy were clinical parameters for pCR, and they proposed a prediction model that used these three risk factors. However, evaluating the treatment response to CRT using sigmoidoscopy would be difficult and may yield inaccurate results, particularly with regard to post-radiation effects, because of the fibrosis and edema that develop after CRT. Habr-Gamma advocated a “watch and wait” policy for complete clinical response after CRT, but she also reported that follow-up for evaluating treatment for response is difficult[21]. Others showed the relationship between pretreatment systemic inflammation and pathologic response after CRT for rectal cancer[12,22]. Heoet al[23]reported that blood lymphocyte count was a useful predictive marker for pCR in LARC.
Our study identified clinical factors that were associated with pCR and good response after preoperative CRT for rectal cancer. Pre-CRT CEA levels were an apparent predictive marker for pCR, and this result is consistent with previous research that identified preoperative CEA as a prognostic factor associated with treatment response to CRT for rectal cancer[9,10,24]. In the multivariate analysis, the pretreatment CEA level was an important factor for pCR, and the post-treatment CEA level was a significant factor for good response. We focused on the difference in the pre- and post-CRT serum CEA levels, because a post-treatment CEA level ≤ 5 ng/mL could indicate good response among patients with a pretreatment CEA level > 5 ng/mL. Thus, we compared treatment response to CRT between those with pre- and post-treatment CEA > 5 ng/mL (Group A); pre- and post-treatment CEA > 5 and ≤ 5 ng/mL, respectively (Group B), and pre- and post-treatment CEA ≤ 5 ng/mL (Group C). Groups B and C showed good response. Although patients with pretreatment CEA > 5 ng/mL did not achieve pCR regardless of the post-CRT changes in CEA, our results showed that post-CRT CEA was associated with good response on multivariate analysis.
Furthermore, we identified other clinical factors, such as pretreatment tumor size, down-staging on MRI, and pre- and post-treatment NLR and PLR, that were associated with treatment response. The tumor distance from the AV did not show any correlation to treatment response. Only pretreatment NLR correlated with complete or good response to CRT on multivariate analysis.
As previously described, treatment response to CRT for LARC varies, with ≥ 40% of patients achieving partial response, 8%–20% of patients achieving pCR after surgery, and ≥ 20% of patients being resistant to treatment or developing progressive disease[5,6,25]. Achieving pCR is important because it is associated with DFS and distant metastasis[26]. Thus, several recent studies attempted to identify markers, including clinical factors, pathological features, imaging findings, and molecular biomarkers, associated with treatment response to CRT for rectal cancer. Moreover, gene expression profiles[27-29], proteins, microRNAs, and other biomarkers, such as tumorinfiltrating lymphocytes and immune checkpoint molecules, have been investigated. Kundelet al[27]reported the expression of EGFR in pretreatment biopsies between TRGgroups (TRG 1vs3;P= 0.003, TRG 1vsTRG 4;P= 0.033) were significantly different. Kamranet al[28]demonstratedKRAS/TP53mutation was associated with non-response and Sendoyaet al[29]also found similar result which RAS/TP53 were associated with poor outcome in prospective study. Akiyoshiet al[30]showed pretreatment neoantigenspecific CD8+ T cell is a key event in CRT response and immune check point can be useful target to enhance tumor regression. However, these studies were usually conducted in small cohorts and retrospective. Therefore, further investigation in alarge cohort study is needed for validation. Molecular biomarkers are expected to have sufficient sensitivity and specificity, but none have yet been applied in clinical settings. In addition, cost-effectiveness is an important consideration.
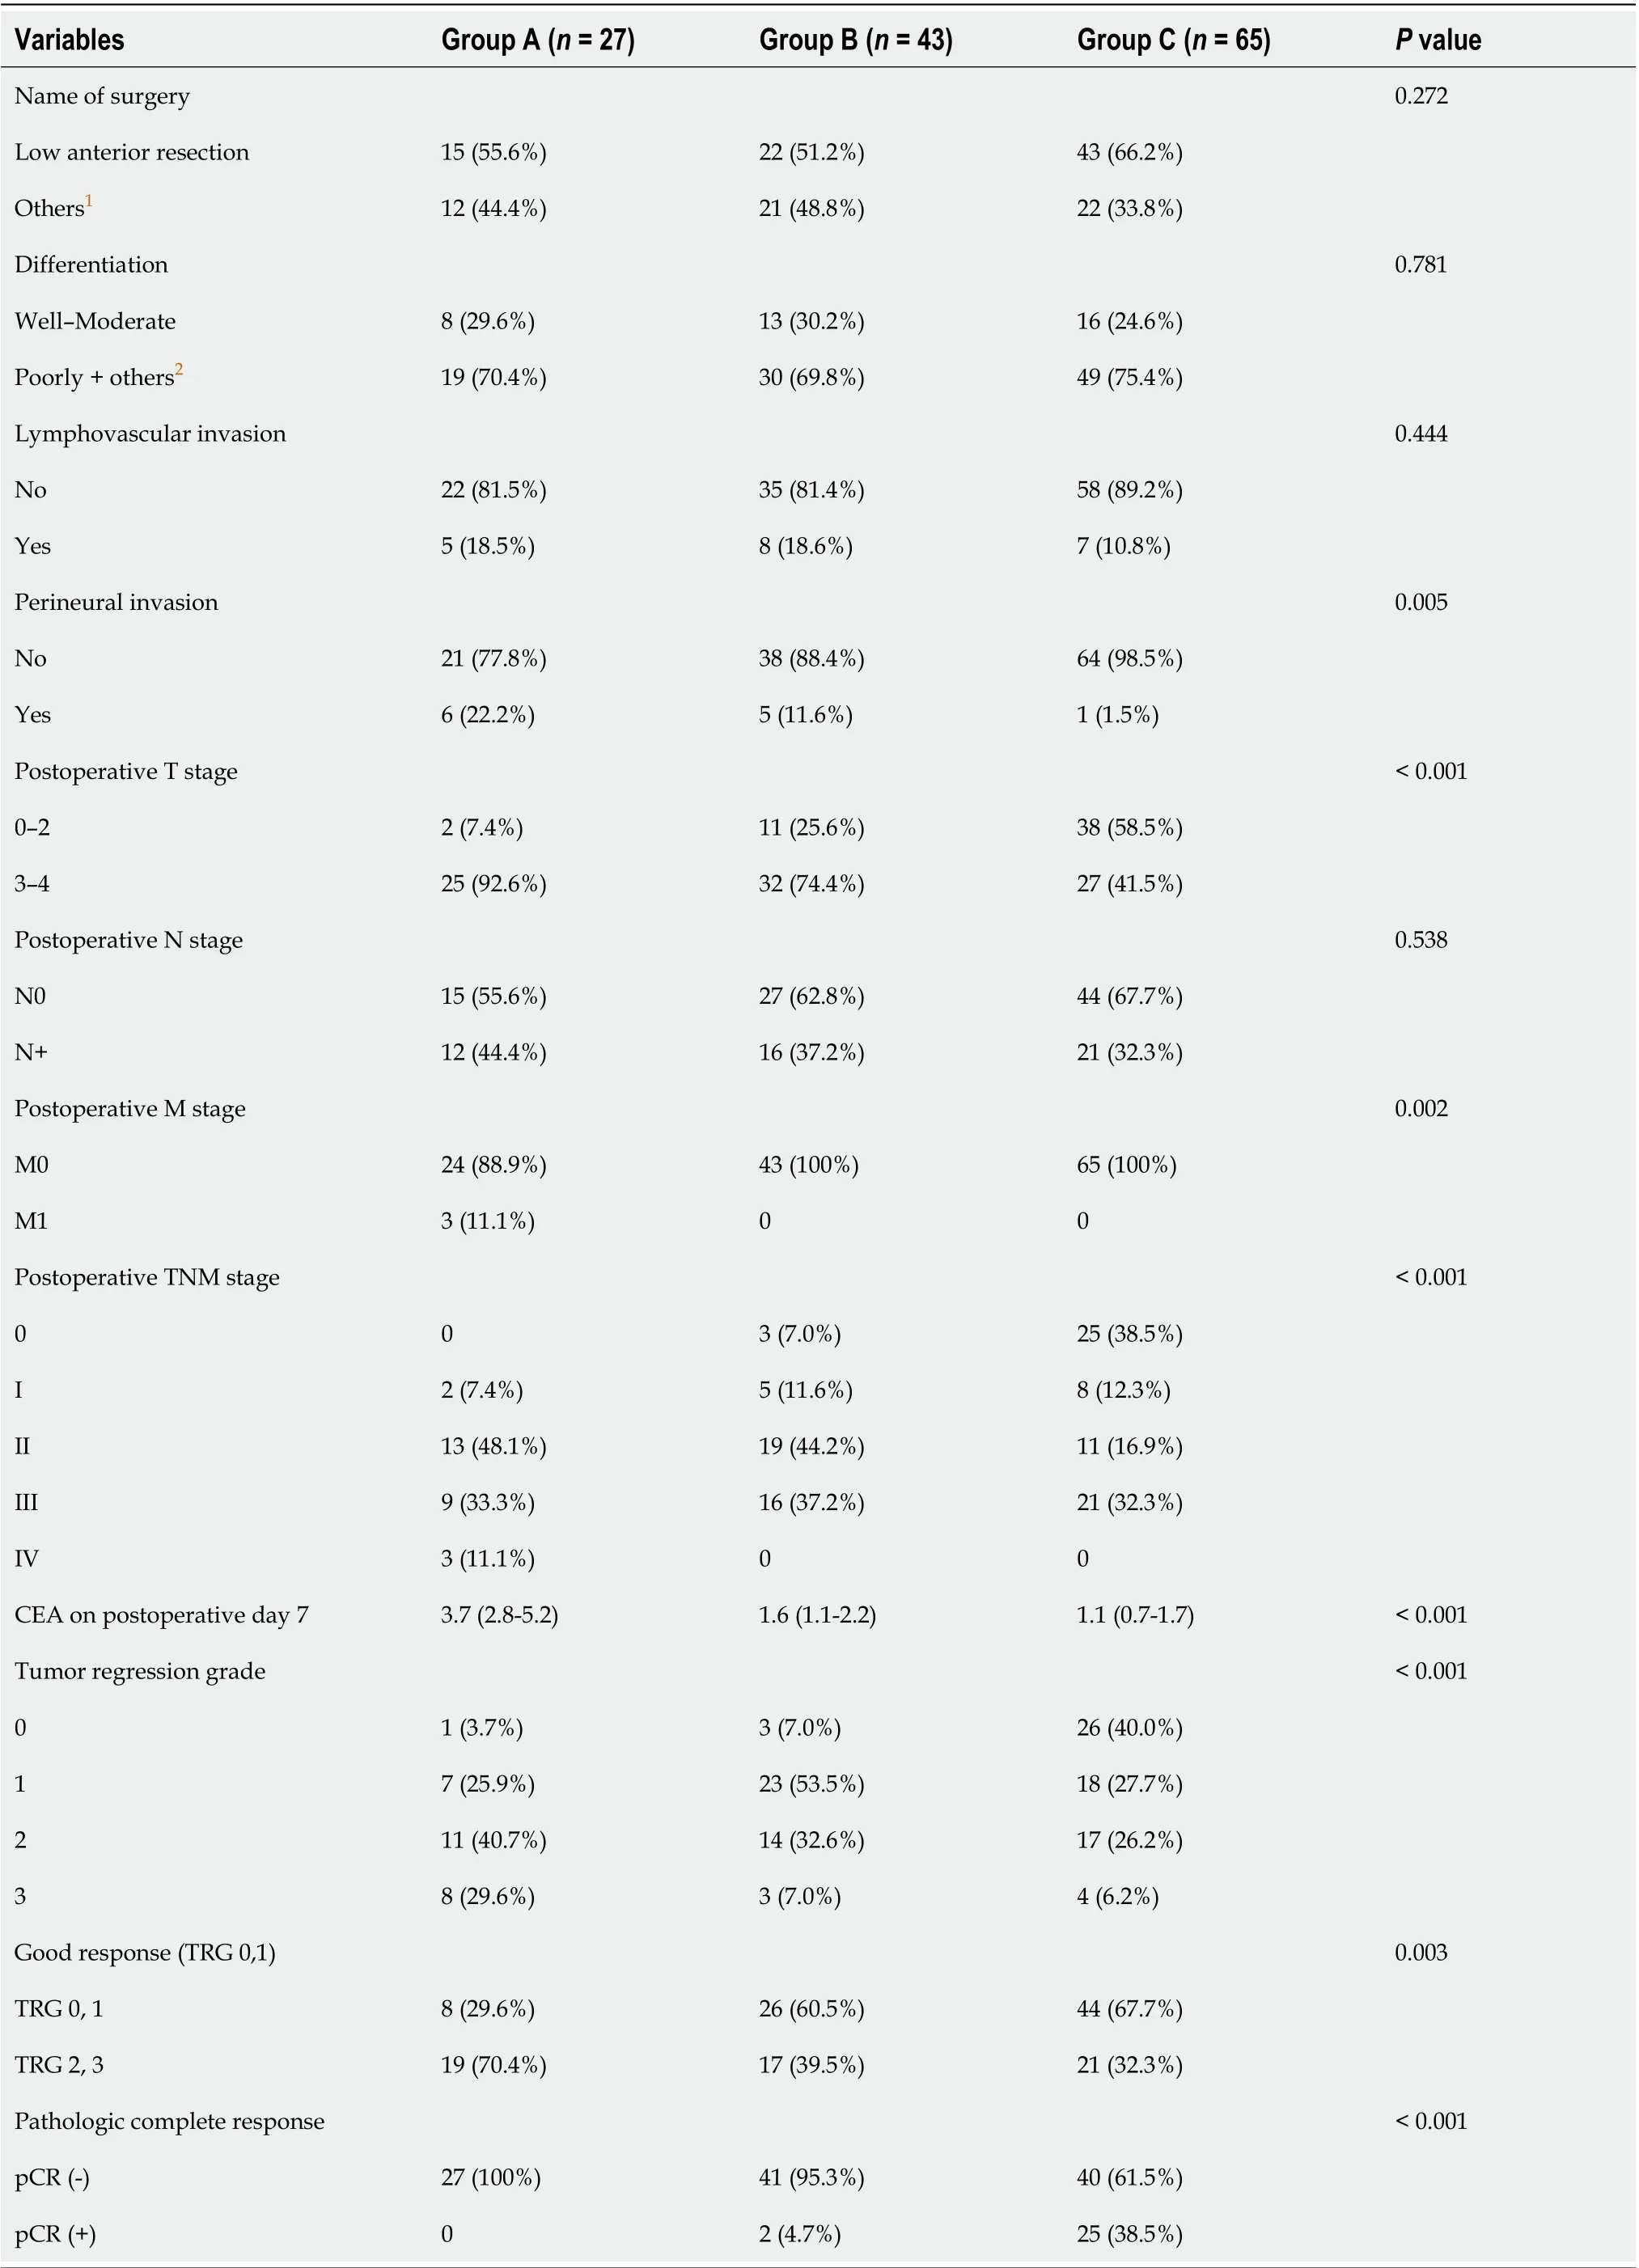
Table 4 Comparison of the changes in the carcinoembryonic antigen level after curative resection

Table 5 Comparison of the non- pathologic complete response and pathologic complete response groups after the chemoradiotherapy following surgical resection

Table 6 Multivariate analysis for prognostic markers to predict the response to the chemoradiotherapy
An individualized treatment strategy based on sensitivity or resistance to preoperative CRT for LARC is needed. Understanding the relationship between each marker and treatment response can help achieve better patient outcomes. Serum CEA levels can be easily measured before and after CRT as part of the routine evaluation. However, a single assessment for CEA is insufficient to predict treatment response to CRT. Variations in prognosis may be observed if patients are classified according to changes in serum CEA levels from before to after CRT. The early identification of poor responders or patients with tumor resistance to CRT will allow clinicians to provide more aggressive treatment, such as intensified chemotherapy.
Limitations of the study
This study has several limitations. Our results were based on 135 patients from a single institution and need to be validated in larger cohorts and multicenter studies. Another limitation was the appropriate timing of pre- and post-CRT measurement of serum CEA levels. The pretreatment serum CEA levels were first measured at the time of the first patient visit to the study center. However, the interval between the measurement of CEA levels and time to CRT commencement can vary because some patients postpone the CRT schedule because of personal reasons. In addition, posttreatment CEA levels can be followed up differently, from 4 to 5 wk after CRT, depending on the clinician’s preference. Therefore, a clear standard interval needs to be defined between the measurement of serum CEA levels and CRT administration.
CONCLUSION
Pretreatment clinical factors such as lymphocyte counts and pre- and post-treatment CEA levels, are important markers in the prediction of treatment response to CRT for LARC. The change in serum CEA levels from before to after CRT, in addition with the pre- and post-treatment CEA levels, can be used to the predict treatment response to CRT for LARC. These clinical factors may facilitate individualized treatment strategies for LARC.
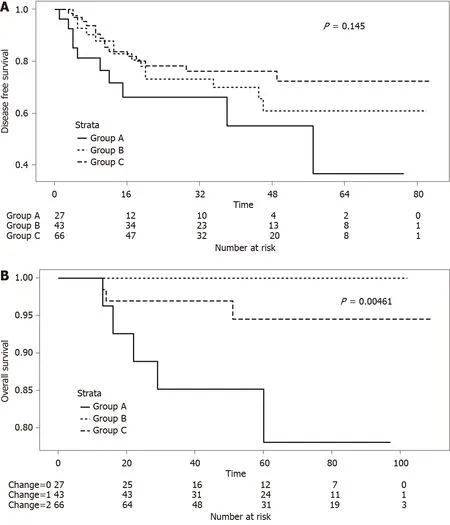
Figure 1 Survival in study groups according to pre- and post-chemoradiotherapy serum levels of carcinoembryonic antigen. A: Five-year disease-free survival in the groups according to pre- and post-chemoradiotherapy (CRT) serum carcinoembryonic antigen (CEA) levels (Group A vs Group B vs Group C; P = 0.145); and B: Five-year overall survival in the groups according to pre- and post-CRT serum CEA levels (Group A vs Group B vs Group C; P = 0.005). Group A: patients with pre- and post-CRT CEA levels > 5 ng/mL; Group B: Patients with pre- and post-CRT CEA levels > 5 and ≤ 5 ng/mL, respectively; and Group C: Patients with pre- and post-CRT CEA levels < 5 ng/mL.
ARTICLE HIGHLIGHTS
Research objectives
This study aimed to identify patients with locally advanced rectal cancer eligible for preoperative CRT according to changes in CEA levels before and after preoperative CRT.
Research methods
We included 145 patients with locally advanced rectal cancer who underwent preoperative CRT and curative resection. Patients were assigned to three groups according to pre- and post-CRT serum CEA levels: both > 5; pre > 5 and post ≤ 5; and both ≤ 5 ng/mL, respectively. We compared the response to CRT depending on changes in serum CEA levels between the groups. Multivariate logistic regression analysis was used to evaluate the prognostic factors for pathologic complete response/good response.
Research results
There were 27, 43, and 65 patients in groups A, B, and C, respectively, according to changes in serum CEA levels before and after CRT. Pre-CRT (P< 0.001) and post-CRT (P< 0.001) CEA levels and the ratio of down-staging (P= 0.013) were higher in Groups B and C than in Group A. The ratio of pathologic tumor regression grade 0/1 significantly differed among the groups (P=0.003). Group C had the highest number of patients showing pathologic complete response (pCR;P< 0.001). Most patients with pCR showed pre- and post-CRT CEA levels of < 5 ng/mL (P< 0.001,P= 0.008). Pre- and post-CRT CEA levels were important risk factors for pCR (odds ratio 18.71; 95% confidence interval 4.62–129.51,P< 0.001) and good response (odds ratio 5.07; 95% confidence interval 1.92–14.83,P= 0.002). Pre-CRT neutrophil-to-lymphocyte ratio and post-CRT T ≥ 3 stage were also prognostic factors for pCR or good response.
Research conclusions
Pre- and post-CRT CEA levels as well as changes in CEA levels were prognostic markers for the response to CRT and may facilitate treatment individualization for rectal cancer.
Research perspectives
Pretreatment clinical factors such as lymphocyte counts and pre- and post-treatment CEA levels are important markers that predict the response to CRT for locally advanced rectal cancer. These clinical factors may facilitate the development of individualized treatment strategies for advanced rectal cancer.
杂志排行

World Journal of Gastroenterology的其它文章
- Hepatocellular carcinoma with tumor thrombus in bile duct: A proposal of new classification according to resectability of primary lesion
- Development and validation of a three-long noncoding RNA signature for predicting prognosis of patients with gastric cancer
- Use of the alkaline phosphatase to prealbumin ratio as an independent predictive factor for the prognosis of gastric cancer
- Active tuberculosis in inflammatory bowel disease patients under treatment from an endemic area in Latin America
- Prevalence and predictors of nonalcoholic fatty liver disease in South Asian women with polycystic ovary syndrome
- Associations between serum uric acid and hepatobiliary-pancreatic cancer: A cohort study