New hypertension and diabetes diagnoses following the Affordable Care Act Medicaid expansion
2021-01-12HeatherAngierNathalieHuguetDavidEzekielHerreraMiguelMarinoTeresaSchmidtBeverlyGreenJenniferDeVoe
Heather Angier, Nathalie Huguet, David Ezekiel- Herrera, Miguel Marino,,2 Teresa Schmidt, Beverly B Green, Jennifer E DeVoe
ABSTRACT
Objective To assess the Affordable Care Act (ACA) Medicaid expansion’s impact on new hypertension and diabetes diagnoses in community health centres (CHCs).
Design Rates of new hypertension and diabetes diagnoses were computed using generalised estimating equation Poisson models and we tested the difference- in- difference (DID) pre- ACA versus post- ACA in states that expanded Medicaid compared with those that did not.
Setting We used electronic health record data (pre- ACA: 1 January 2012—31 December 2013—post- ACA: 1 January 2014—31 December 2016) from the Accelerating Data Value Across a National Community Health Center Network clinical data network. We included clinics with ≥50 patients contributing to person- time- at risk in each study year.
Participants Patients aged 19—64 with ≥1 ambulatory visit in the study period were included. We then excluded patients who were pregnant during the study period (N=127 530). For the hypertension outcome, we excluded individuals with a diagnosis of hypertension prior to the start of the study period, those who had a hypertension diagnosis on their first visit to a clinic or their first visit after 3 years without a visit, and those who had a diagnosis more than 3 years after their last visit (pre- ACA non- expansion N=130 973; expansion N=193 198; post- ACA non- expansion N=186 341; expansion N=251 015). For the diabetes analysis, we excluded patients with a diabetes diagnosis prior to study start, on their first visit or first visit after inactive patient status, and diagnosis while not an active patient (pre- ACA non- expansion N=145 435; expansion N=198 558; post- ACA non- expansion N=215 039; expansion N=264 644).
Results In non- expansion states, adjusted hypertension diagnosis rates saw a relative decrease of 6%, while in expansion states, the adjusted rates saw a relative increase of 7% (DID 1.14, 95% CI 1.11 to 1.18). For diabetes diagnosis, adjusted rates in non- expansion states experienced a significant relative increase of 28% and in expansion states the relative increase was 25%; yet these differences were not significant pre- ACA to post- ACA comparing expansion and non- expansion states (DID 0.98, 95% CI 0.91 to 1.05).
Conclusion There was a differential impact of Medicaid expansion for hypertension and diabetes diagnoses. Moderate increases were found in diabetes diagnosis rates among all patients served by CHCs post- ACA (both in expansion and non- expansion states). These increases suggest that ACA- related opportunities to gain health
INTRODUCTION
In the USA, the Patient Protection and Afford—able Care Act (ACA) included several provi—sions to increase health insurance coverage. For example, the ACA provided states the opportunity to expand Medicaid eligibility to citizens and legal residents earning ≤138% of the federal poverty level (FPL) and opened health insurance marketplaces; many states chose to expand Medicaid while others did not.1The ACA Medicaid expansion improved access to healthcare2and reduced disparities for some patients,3which may have increased opportunities to identify health conditions. Indeed, the ACA decreased the number of uninsured by nearly 20 million4and increased preven—tive screenings.56Despite these advances, to date, little is known about the effects of the ACA Medicaid expan—sion on the diagnosis of serious chronic health conditions such as hypertension and diabetes. Yet, both conditions are major causes of morbidity and mortality and dispro—portionately affect low— income populations in the USA.7Hypertension, the most prevalent cardiovascular risk factor, affects approximately 103 million people repre—senting 46% of US adults, using thresholds from the 2017 American College of Cardiology/American Heart Associ—ation blood pressure guideline.89Diabetes was diagnosed in over 30 million people in 2016 and is approaching a 10% prevalence rate in the US adult population.1011
Accurate and timely diagnosis is the first step in hyper—tension and diabetes care to ensure adequate treatment and symptom management, which can lead to reduction in morbidity and mortality associated with these condi—tions.9Yet, nearly 16% of adults with hypertension were unaware they had it.12While there have been improve—ments in diagnosing hypertension and diabetes in the US general population, recent data indicate declines in hypertension awareness and treatment.13For example, nearly 85% of US adults with hypertension were aware of the diagnosis in 2013—2014, whereas awareness declined to 77% in 2017—2018.14Nearly 30% of adults without health insurance were unaware of their hypertension in comparison to more than 14% of those with health insur—ance.12In addition, the HealthyPeople 2020 target for those with diabetes to receive a correct diagnosis (79.8%) has been met or is closely approaching the target in those with high educational attainment, while trailing for those with less than a high school degree (70.9%).15
Community health centres (CHCs) serve a large propor—tion of medically underserved adults in the USA and are an essential source of care for racial/ethnic minori—ties and those with low socioeconomic status.16They provide services to over 27 million Americans, regardless of health insurance, and care for more than one in six Medicaid beneficiaries.17Yet, lack of insurance remains a barrier for CHC patients to receive some services even though clinic visits are available.1819For example, a patient without insurance might be able to access a visit but cannot pay for medications or laboratory testing. After the ACA Medicaid expansion, CHCs saw a decrease in uninsured visits in both expansion and non— expansion states, and a significant increase in Medicaid— insured visits in expansion states.20Previous studies also showed an increase in preventive and primary care services at CHCs post— ACA.52021
These studied and established effects the ACA had on CHCs make them the ideal setting for studying the impact health insurance policy changes had on recognising and documenting the diagnosis of chronic conditions among underserved populations. Thus, the purpose of this study was to assess whether: (1) new hypertension and diabetes diagnoses increased from pre— ACA to post— ACA among a large cohort of CHC patients and (2) this change, if any, varied in states that chose to expand Medicaid eligi—bility vs the states that did not. We hypothesised that new diagnoses would increase pre— ACA to post— ACA and that the states which elected to expand Medicaid would see a greater increase in diagnosis rates compared with states that did not expand Medicaid due to increased access to healthcare services (especially diagnostic tests), and consequently, greater opportunities to identify previously undocumented health conditions.
METHODS
Data source
We used electronic health record (EHR) data from the Accelerating Data Value Across a National Community Health Center Network clinical data network (CDN) of CHCs. This CDN brings together outpatient clinical EHR data from more than one million patients from three health systems.22The study included 110 primary care CHCs ‘live’ on an EHR ≥12 months before the start of the study period and maintained on the EHR throughout the study period (1 January 2012—31 December 2016) in nine states (California, Hawaii, Maryland, New Mexico, Ohio, Oregon, Rhode Island, Washington, Wisconsin) that expanded Medicaid eligibility on 1 January 2014 and four states (Florida, Kansas, Missouri, North Carolina) that did not expand during the study time period. WI was included as an expansion state because they increased Medicaid eligibility to 100% FPL.
We included clinics with ≥50 patients contributing to person— time— at risk in each study year and patients aged 19—64 with ≥1 ambulatory visit in the study period (n=581 936) meaning patients had to have visited a CHC at least once (but could have visited several times) during the entire study period and that visit could have been either pre— ACA or post— ACA. We excluded patients who were pregnant during the study period (N=127 530).
For the hypertension outcome, we excluded individuals with a diagnosis of hypertension prior to the start of the study period (N=107 930), those who had a hyperten—sion diagnosis on their first visit to a clinic or their first visit after 3 years without a visit (N=76 079), and those who had a diagnosis >3 years after their last ambulatory visit and thus not an active patient in the health system (N=80 442). The resulting dataset used in the analyses for hypertension incidence included pre— ACA cohorts from non— expansion (N=130 973) and expansion states (N=193 198), and post— ACA cohorts from non— expansion (N=186 341) and expansion states (N=251 015).
For the diabetes outcome, we excluded patients with a diabetes diagnosis prior to study start (N=3284), on their first visit or their first visit after inactive patient status (N=15 557), and those who had a diagnosis while not an active patient (N=27 572). The resulting dataset used in the analyses for diabetes incidence included pre— ACA cohorts from non— expansion (N=145 435) and expansion states (N=198 558) and post— ACA cohorts from non— expansion (N=215 039) and expansion states (N=264 644).
Measures
Hypertension diagnoses were assessed using Interna—tional Classification of Diseases (ICD)—9: 401.00—401.99, 402.00—405.99 or ICD—10: I10—I15. Diabetes diagnoses were assessed using ICD—9: 250.00 or ICD—10— CM E11.9.
Analysis
Hypertension and diabetes diagnoses were defined as incidence rates by estimating the number of diagnoses at a clinic over person— time at risk (visit date plus a 1 year buffer).23In other words, each patient seen in the clinic was included in the person— time at risk (denominator) at each visit they had plus 1 year of time after that visit within the study time period. If they had another visit within the year, the year buffer started again. Since this is a clinic— level analysis, the incidence rate is the sum of diagnoses over the person— time at risk for a given clinic. Using person— time at risk allows for accurate rates regardless of the time frame included. We used generalised estimating equation (GEE) Poisson models with an interaction term that tested a difference in difference (DID) of diag—nosis incidence rates pre— ACA versus post— ACA Medicaid expansion between expansion and non— expansion states. These GEE models produced incidence rate ratios (IRRs) comparing post— ACA versus pre— ACA periods within and between expansion groups. All models were adjusted for study year and primary CHC patient population demo—graphics in the preperiod (ie, clinic— level distributions of race/ethnicity, sex, age, most frequent insurance coverage and % FPL). Data processing was managed in R V.3.6.0; analyses were conducted using STATA V.15.
RESULTS
Overall, sex and age distributions were similar (table 1 and online supplemental appendix table 1). However, non— expansion and expansion states differed in race/ethnicity distributions and FPL. Specifically, large differences were noted in percentage of non— Hispanicblacks and percentage of non— Hispanic whites, and the percentage of patients with ≤138% FPL. As expected, there were notable differences in insurance status between expansion and non— expansion states and pre— ACA versus post— ACA. Pre— ACA to post— ACA Medicaid expansion there was a decrease in patients without insurance, with a smaller decrease in non— expansion states than in expan—sion states. Due to these differences in group characteris—tics, we adjusted models as specified above.
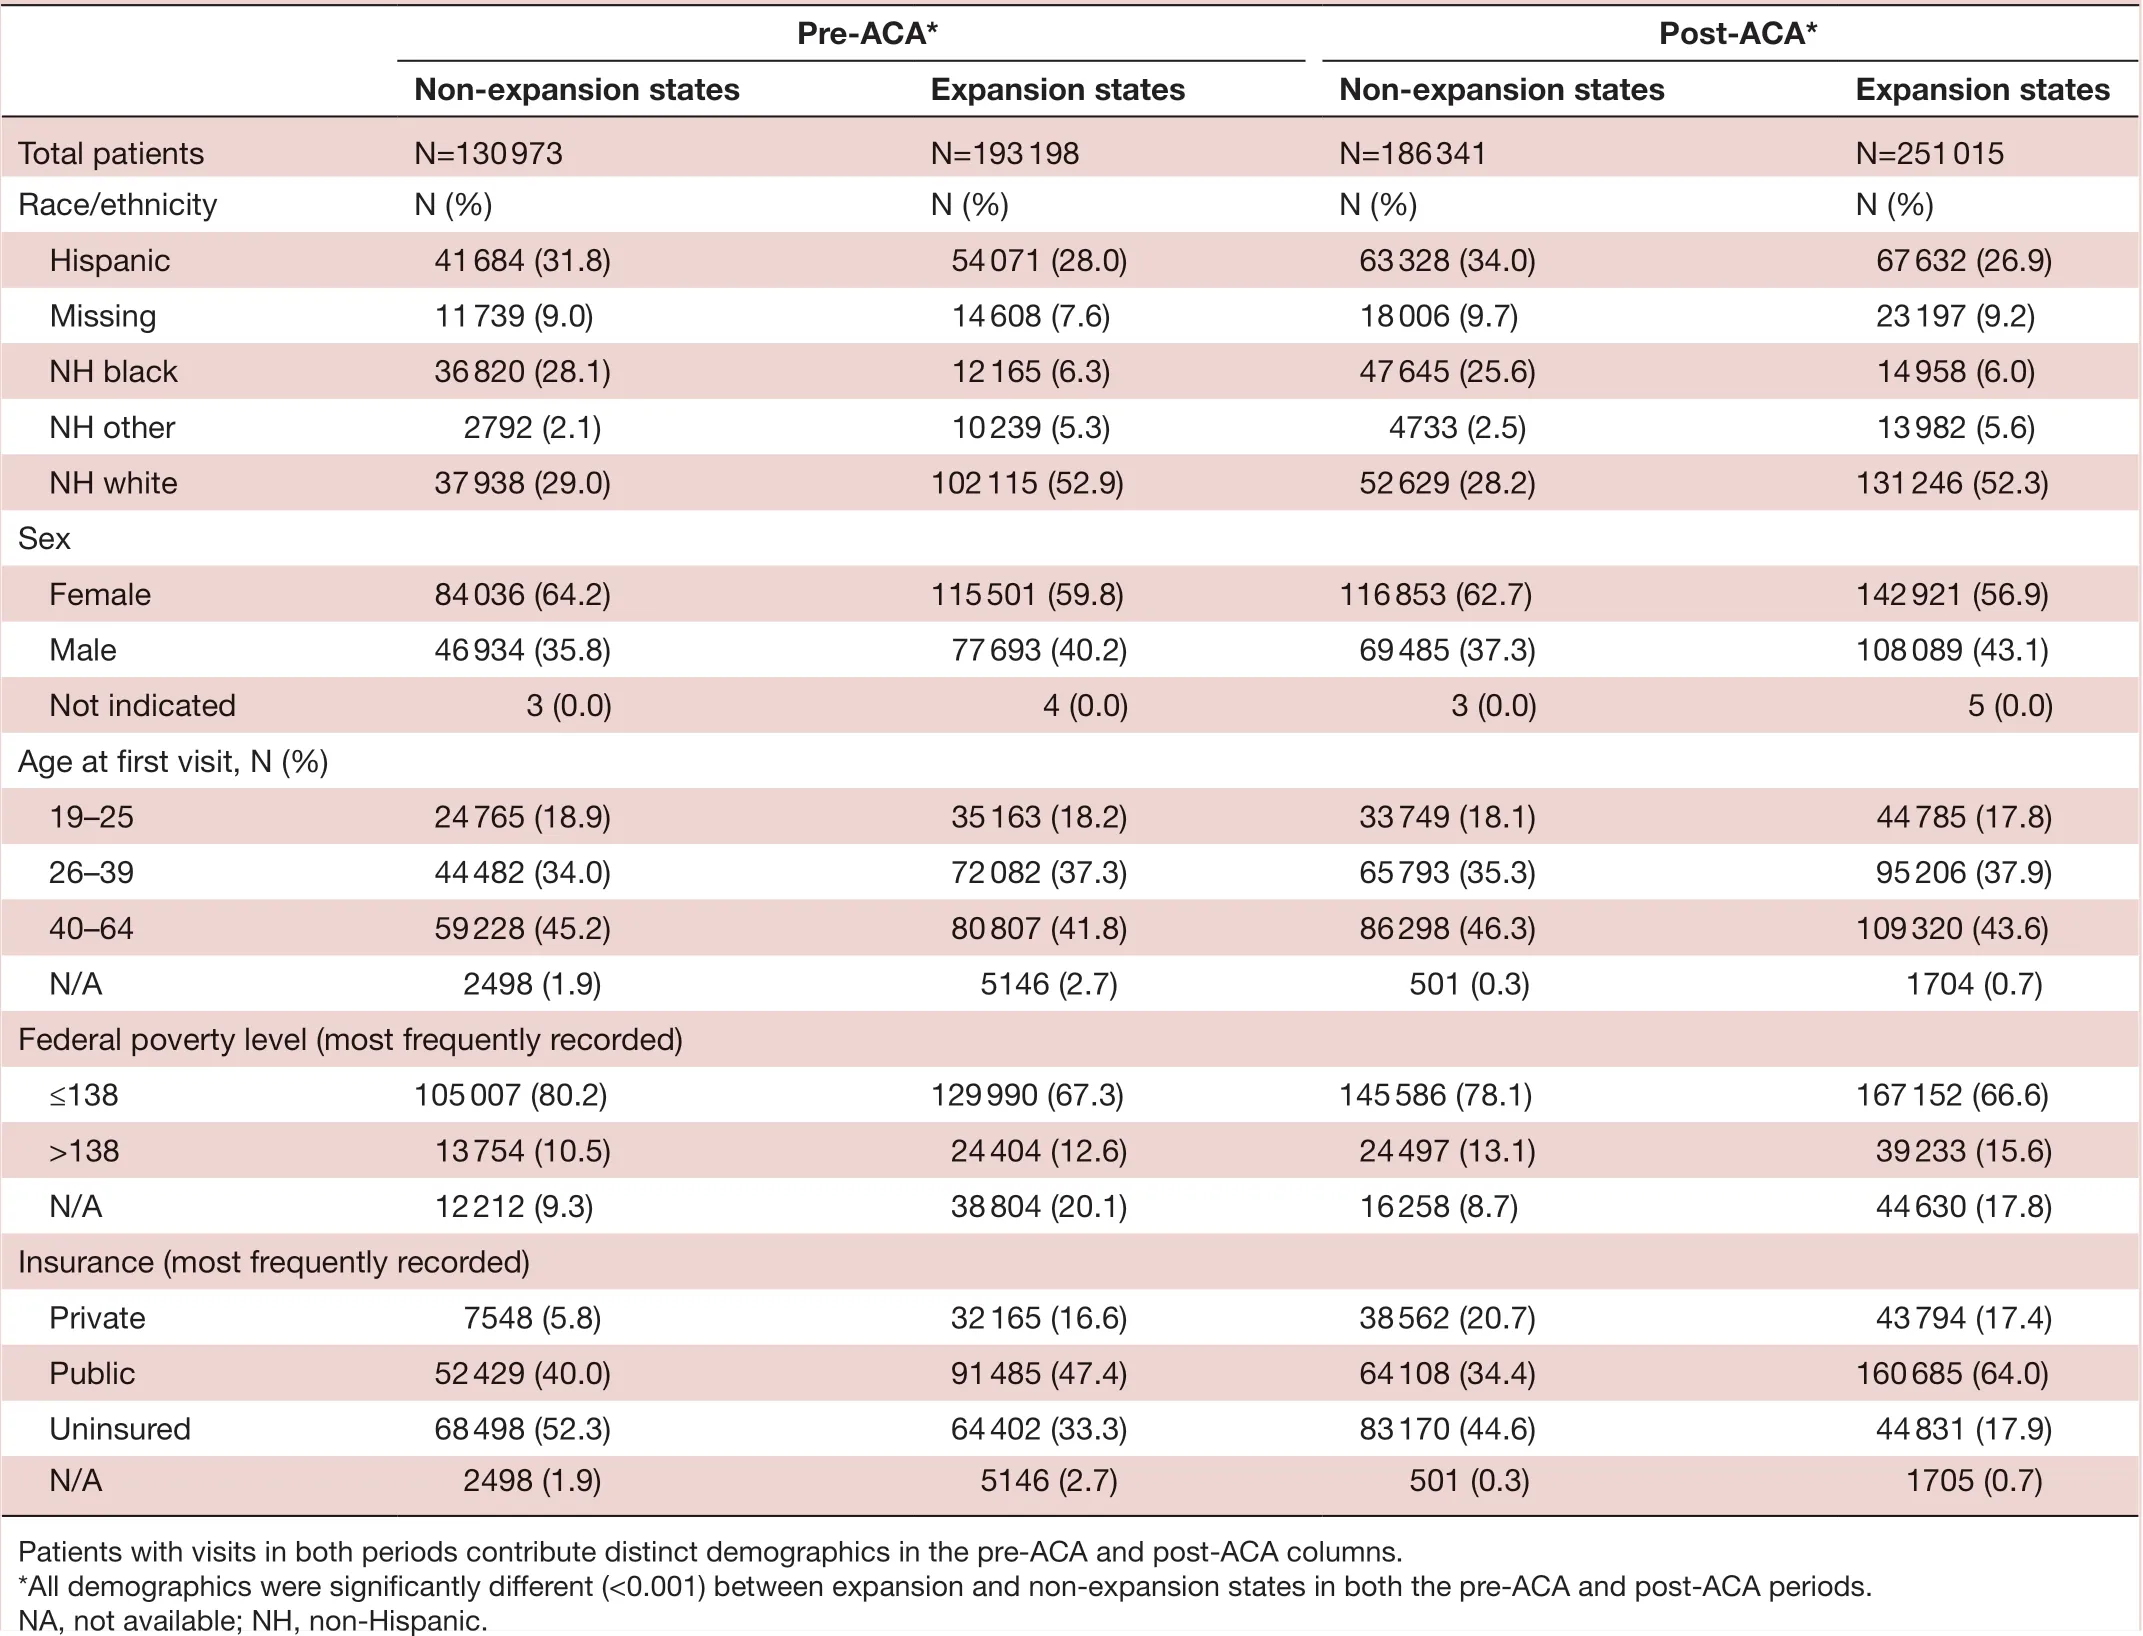
Table 1 Demographics of patients pre- Affordable Care Act (ACA) and post- ACA by Medicaid expansions status
Hypertension diagnosis analysis
The incidence rate of hypertension diagnosis showed a small change in CHCs in both expansion and non— expansion states (table 2). In non— expansion states, adjusted hypertension diagnosis rates saw a relative decrease of 6% (IRR 0.94, 95% CI 0.91 to 0.97), while in expansion states, the adjusted rates had a relative increase of 7% (IRR 1.07, 95% CI 1.03 to 1.10). The DID of diag—nosis incidence rates pre— ACA versus post— ACA Medicaid expansion between expansion and non— expansion states was significant (DID 1.14; 95% CI 1.11 to 1.18) (p<0.05).
Diabetes diagnosis analysis
The adjusted diabetes diagnosis rates in non— expansion states saw a relative increase of 28% (IRR 1.28, 95% CI 1.18 to 1.34) in non— expansion states, while the rela—tive increase was 25% (IRR 1.25, 95% CI 1.16 to 1.34) in expansion states (table 2). The DID of diagnosis inci—dence rates pre— ACA versus post— ACA Medicaid expan—sion between expansion and non— expansion states was not significant (DID 0.98; 95% CI 0.91 to 1.05).
DISCUSSION
The ACA expanded access to health insurance coverage, which led to increased preventive service receipt for patients.2We assessed the change in new hypertension and diabetes diagnoses pre— ACA and post— ACA comparing CHCs in states that expanded Medicaid and those in states that did not. We hypothesised that following ACA Medicaid expansion there would be an increase in the rate of diagnoses. We found a differential impact of Medicaid expansion for hypertension and diabetes diag—noses. Moderate increases were found in diabetes diag—nosis rates among all patients served by CHCs post— ACA (both in expansion and non— expansion states). These increases suggest that ACA— related opportunities to gain health insurance (such as marketplaces and Medicaid expansion) may have facilitated access to diagnostic tests for this population. The study found small changes in hypertension diagnosis rates from pre— ACA to post— ACA. Thus, despite a significant difference between expansion and non— expansion states the small change in diagnosis of hypertension pre— ACA to post— ACA suggests it is likely documented for patients, regardless of health insurance availability.
Our findings pertaining to hypertension diagnosis incidence rates were in the range reported by the USPreventive Services Task Force.24They were not consis—tent with previous studies comparing health conditions pre— ACA to post— ACA, which did not find changes in diag—noses of hypertension, despite changes in diagnoses of diabetes and high cholesterol.2526Minimal or no change in hypertension diagnosis rates in multiple pre— ACA versus post— ACA studies may be explained by the common and systematic practice of taking a person’s blood pres—sure at every healthcare visit, which often results in a patient receiving a diagnosis regardless of health insur—ance coverage, especially in the CHC setting.
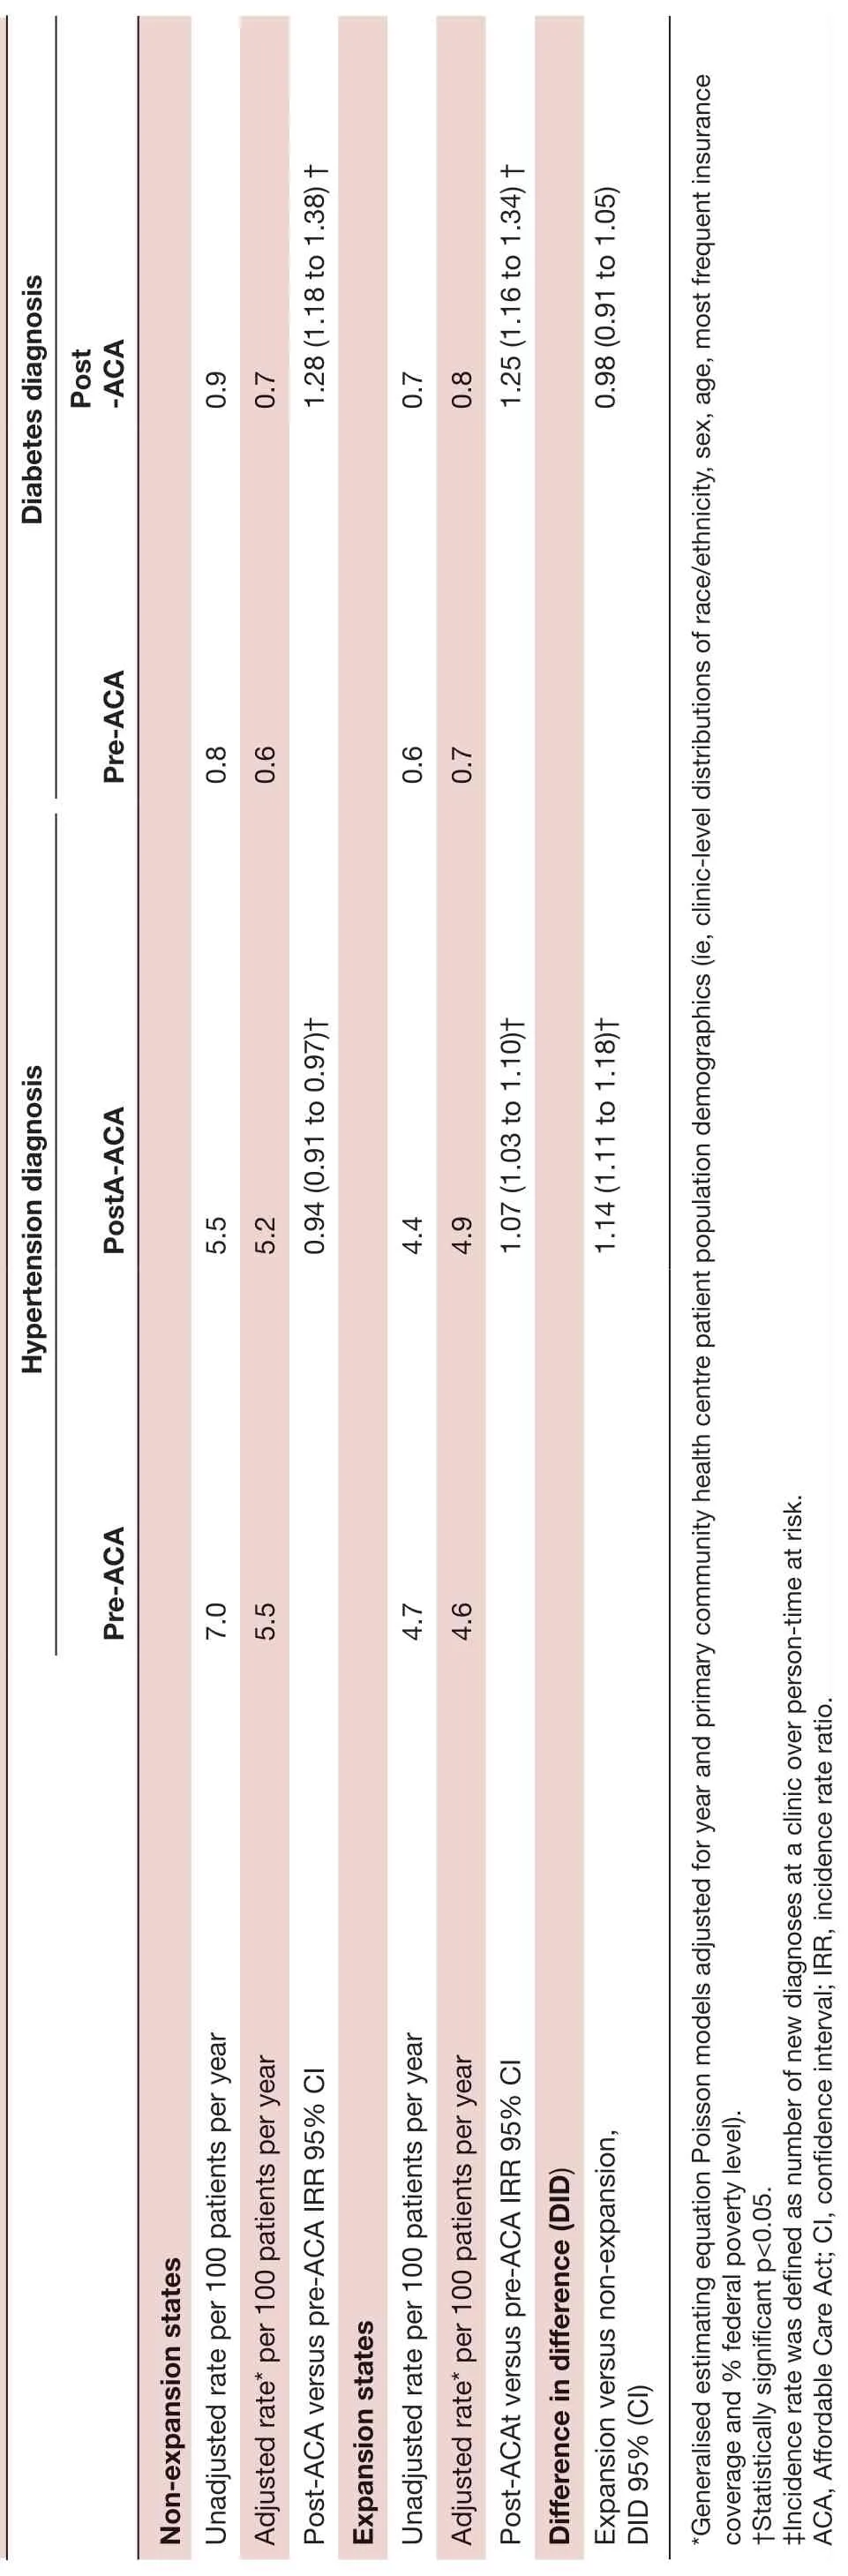
Table 2 Hypertension and diabetes diagnosis rates, IRRs and difference- in- difference post- ACA versus pre- ACA by Medicaid expansion status
Unlike a hypertension diagnosis that can be made on the basis of blood pressure screening results9requiring limited resources, a diagnosis of diabetes requires labo—ratory testing, which may not be accessible to a patient without health insurance coverage. Our findings showing a relative increase in incidence of diabetes diagnosis for CHC patients of 28% and 25% in non— expansion and expansion states post— ACA, respectively, may be due to an increase in the number of CHC patients able to access lab testing with newly acquired health insurance coverage from both Medicaid expansion and marketplaces. The increase in newly diagnosed diabetes in this population is in contrast with the Centers for Disease Control and Prevention’s report of a downward trend in age— adjusted incidence of diagnosed diabetes among the general adult population in the USA, which has been declining since 2008.27We found it puzzling to see no significant differ—ence in the incidence of diabetes diagnosis comparing pre— ACA to post— ACA in expansion versus non— expansion states, as we had hypothesised that states that had expanded Medicaid would see higher rates. However, findings are aligned with a previous study comparing diagnosis of pre— existing conditions among previously CHC patients without insurance who gained insurance following the ACA, which showed an absence of differ—ences in expansion compared with non— expansion states.26One explanation for a lack of difference between expan—sion and non— expansion states is that access to preventive care increased post— ACA regardless of expansion status; suggesting that gaining any type of health insurance was important for patients (options to gain coverage via marketplace were implemented in 2014 as well) and that CHCs gained additional resources post— ACA allowing them to provide more preventive care to those without individual coverage.28This finding is in contrast to previously reported differences in the post— ACA self— reported prevalence of diabetes among adults with family incomes below 138% FPL in expansion states versus non— expansion states25; however, the study used self— reported data from the National Health Interview Survey, and the postperiod was 1 year; whereas, we used EHR data from patients receiving care at CHCs with a 2— year post— ACA follow— up period.
The relatively small changes to hypertension diagnosis and modest changes to diabetes diagnosis observed in this study suggest that health insurance plays a minimal role in CHCs’ ability to diagnose chronic diseases for patients who are able to consistently receive care at a CHC. Indeed, previous research found patients with a regular source of care were more likely to know that they had hypertension compare to patients without a usual source of care.14Our analyses focused on diagnosis incidence rates as the study main outcomes; other outcomes such as time to obtaining diagnosis may be more sensitive to ACA— related changes in our population of interest. Finally, while we did not see large changes in the hypertension and diabetes diagnosis rates among this CHC population, patients without stable health insurance may not be able to seek regular care,29afford medications, or adjust medications as needed to control symptoms,30therefore, the presence of absence of stable health insurance may have a larger impact on these outcomes than on incidence of disease. Future investigations to understand the impact of the ACA insur—ance expansions on hypertension and diabetes treatment and control are warranted.
Limitations of this research include our inability to detect temporal changes, and potential ceiling effects, with high baseline hypertension diagnosis rates and little opportunity to observe improvement. We were only able to assess patients that came in for a visit, which may be a different population than patients who do not access primary care. Additionally, we included only some states and some CHCs, which may not be representative of all states or clinics. Our CHC population, however, is similar to the national CHC population.31Despite these limita—tions, this investigation adds important insights on the impact of the ACA Medicaid expansion on populations served by CHCs.
CONCLUSION
There was a differential impact of Medicaid expansion for hypertension and diabetes diagnoses. We found moderate increases in diabetes diagnosis rates among patients served by CHCs after the implementation of the ACA, suggesting that increased health insurance oppor—tunities with Medicaid expansion and marketplaces may have facilitated access to diagnostic tests for this popula—tion. Despite significant differences between expansion and non— expansion states, the study found a small change in hypertension diagnosis rates pre— ACA to post— ACA, suggesting that the diagnosis of hypertension is likely documented for patients regardless of health insurance availability. Additional research is needed to evaluate whether the ACA led to improvements in hypertension or diabetes treatment and/or control for patients from underserved populations.
ContributorsHA, NH, MM, BBG and JED designed the study. TS acquired and processed the data. DE- H, MM and TS contributed to different aspects of data analyses. HA wrote the manuscript. All authors contributed to data interpretation and critical revision of the manuscript. The final version of the manuscript was approved by all authors.
FundingThis research was funded by CDC/NIDDK grant #U18DP006116 and NHLBI grant #R01HL136575.
Competing interestsNone declared.
Patient consent for publicationNot required.
Ethics approvalThis study was approved by our academic health centre’s Institutional Review Board, which accepted responsibility for review from the organisation that houses the CDN. IRB approval #IRB00011858.
Provenance and peer reviewNot commissioned; externally peer reviewed.
Data availability statementData may be made available on reasonable request. The datasets analysed during the current study may be made available from the corresponding author on reasonable request.
Supplemental materialThis content has been supplied by the author(s). It has not been vetted by BMJ Publishing Group Limited (BMJ) and may not have been peer- reviewed. Any opinions or recommendations discussed are solely those of the author(s) and are not endorsed by BMJ. BMJ disclaims all liability and responsibility arising from any reliance placed on the content. Where the content includes any translated material, BMJ does not warrant the accuracy and reliability of the translations (including but not limited to local regulations, clinical guidelines, terminology, drug names and drug dosages), and is not responsible for any error and/or omissions arising from translation and adaptation or otherwise.
Open accessThis is an open access article distributed in accordance with the Creative Commons Attribution Non Commercial (CC BY- NC 4.0) license, which permits others to distribute, remix, adapt, build upon this work non- commercially, and license their derivative works on different terms, provided the original work is properly cited, appropriate credit is given, any changes made indicated, and the use is non- commercial. See: http:// creativecommons. org/ licenses/ by- nc/ 4. 0/.
杂志排行

Family Medicine and Community Health的其它文章
- Family medicine residency training in Ghana after 20 years: resident attitudes about their education
- Perceived barriers and primary care access experiences among immigrant Bangladeshi men in Canada
- Exploring the structure of social media application- based information- sharing clinical networks in a community in Japan using a social network analysis approach
- Bridging the mental health treatment gap: effects of a collaborative care intervention (matrix support) in the detection and treatment of mental disorders in a Brazilian city
- Cultural adaptation and content validity of a Chinese translation of the ‘Person- Centered Primary Care Measure’: findings from cognitive debriefing
- Depression, periodontitis, caries and missing teeth in the USA, NHANES 2009-2014