ExploringConsumers,BehavioralIntentioninUsingInformationTechnologyStudyinIoT
2020-12-28ZhangZhiming
ZhangZhiming

Abstract:As intelligent networking technology gradually comes to maturity and as its transmission speed increases, people are now heavily dependent on smartphones. Moreover, in combination with data collection, management, and analysis through wireless sensing equipment to obtain customer information regarding store activities, businesses can now extend e-commerce to personalized mobile commerce and can deploy effective mobile advertising and precise positioning marketing.
Key words: Internet of Things; Technology Acceptance Model
CLC number:G252;F323.6 Document identification code: A
In addition, IT behavior and intention research was used in this study to understand consumersacceptance and willingness in using store apps. In this study, technology acceptance model was used as a framework, and incentive theory viewpoints were used for some external variables. The model was able to shed light on whether consumers usage behavior was affected by various external stimuli through the indirect influence on perceived usefulness and perceived ease of use. In this study, SPSS version 22 and Smart PLS version 2.0 were used for data analysis. The results of the data analysis show that all facets of this study had good reliability levels, internal consistency, and construct validity. The model validation results show that external variables indirectly influence behavioral intention through perceived usefulness. However, among the external variables, only interactive incentives exerted significant influence on perceived ease of use, although it did not indirectly affect behavioral intention via perceived ease of use.
1 Introduction
Along with changes in network types, improvements in IT, innovation in network services, diversification in applications, and the continuous improvement in processing power and storage capacity of intelligent terminal equipment, people are gradually entering an era where they are always connected. Nowadays, the network has evolved from a human-oriented network pattern to an object-oriented Internet of Things (IoT) environment, forming a ubiquitous network environment [3]. Owing to an environment constructed by IoT, the combination of a wide range of wireless sensing networks, and various smart devices and network domains, network-linked objects have been extended to include objects in real life to form a gigantic network [7]. Consequently, the relevant information derived from the intelligent-object can be applied to commercial activities. IoT is not merely an expansion of the Internet or communication networks. Through the ability to link objects, more meaningful information can be collected. Hence, when IoT is combined with the precise positioning function of smart mobile devices, smart location-based personalized information can be obtained, which will eventually subvert traditional business operations.
The investigation of behavioral intention in this study is based on a technology acceptance model. Incentive theory viewpoints are added to the external variables in the model. Whether or not various external stimuli imposed upon consumers will indirectly affect user behavior through perceived usefulness and perceived ease of use can be observed. Through the model, consumer acceptance and willingness to use the store apps can be understood. This can help bring stores and their customers closer together and is helpful in improving store operation.
The objectives of this study are stated as follows:To use the technology acceptance model as a framework, with the addition of incentive theory viewpoints to discuss the effects of various external stimuli to consumers, and the acceptability and willingness to use store apps. The rest of this dissertation is organized as follows:An introduction that explains the background, and motivation, purpose of this study. Literature reference in this study that discusses IoT, incentive theory, and relevant theory of technology acceptance model. In the study method, data analysis method is employed to explore behavioral intention. The contents include research structures, objects, Study Hypothesis, Questionnaire Design and Distribution. The results and findings are also explained in this study. It includes descriptive statistics, reliability and validity analysis, and validation of the research models. Final conclusions of this study.
2 Literature Review
In this section, the relevant theories and technologies used in this study are explained. These include the Internet of Things and the technology acceptance model.
2.1 Internet of Things(IoT)
In the era of the Internet, people can interconnect and obtain information via the network. Through the combinational use of network and various wireless communication sensing networks, objects can now communicate with each other through the Internet environment [6].
The Internet of Things is not a new technology and is actually a very broad concept. "Things are made intelligent through the implantation of various micro-sensing chips in them. Wireless network is used to connect those intelligent things to the Internet. Hence, the information of things can be shared to implement dialogue between people and things, and communication between things. In this way, the things people interact with in their daily lives can automatically report their states. The things also automatically communicate with other things and people [1].
The operation of the Internet of Things is mainly divided into a three-layer structure. They are the perceived layer, network layer and application layer. These layers are described below. (1) The lowest layer is the perceived layer. It consists of sensing components, which mainly include data collection equipment. The main task of the perceived layer is to identify objects and to collect the information of various heterogeneous sensing data. (2) The middle layer is the network layer. communication networks and the Internet. Its main function is to perform tran It is built on the existing mobile smission and processing of information.(3) The top layer is the application layer. This layer combines the societal and real life usage requirements to further create an intelligent application system.
2.2 Technology Acceptance Model(TAM)
Based on TRA (Theory of Reasoned Action) with some modifications, Davis et al. [4] abandoned the ideas of subjective norm and normative beliefs and the motivation to comply, and instead proposed to add in two important facets: Perceived Usefulness (PU) and Perceived Ease of Use (PEU). Moreover, external variables were added to extend the acceptance of the system in question. The model is called the Technology Acceptance Mode (TAM), It is used to explain, predict, and diagnose the attitude and behavioral intention patterns of users facing new technologies. Since TAM is highly interpretive in the adoption of new technology, it is widely used in studies of consumer acceptance of new technology. It is used to understand the impact of external variables on users' internal beliefs, attitude, and intention, thereby affecting the use of new technology.
3 Study Method
This section explains in detail how the research was carried out, including explanation of the research framework, questionnaire design, and statistical methods used in the data analysis.
3.1 Research Structure
The framework is shown in Figure 1:
3.2 Study Objects, Questionnaire Design and Distribution
The study objects were set as the shops with iBeacon sensors installed and the users who had downloaded the app. The internet questionnaires were distributed, and the survey was conducted using Convenience Sampling. To reduce the number of invalid questionnaires, prior to filling the questionnaire, the consumers were asked whether they had downloaded the app and whether they had experience with the app. A total of 210 questionnaires were collected during the survey period. After lie checking, 21 invalid questionnaires were excluded, leaving 189 valid samples. The effective questionnaire rate was 90%. The questionnaires were measured using the 5-point Likert-Format Scale and the respondents were asked to select their opinions on the items (1 for strongly disagree, 5 for strongly agree). The higher the score, the higher the agreement.
3.3 Data Analysis Methods and Tools
In this study, SPSS version 22 and Smart PLS version 2.0 statistics software were used as data analysis tools. Smart PLS version 2.0 uses the PLS (Partial Least Squares) method to conduct mode analysis. [2]. At the same time, it provides a structural model for the verification of the relationship between structural concepts, and verification of the reliability and validity of a model.
4 Data Analysis
This section will explain the narrative statistical analysis, reliability and validity analysis, and verification of the research model of this study.
4.1 Narrative Statistical Analysis
In this study, basic data analysis was conducted on the valid questionnaire samples. There were more males (n=104, 55%) than females (n=85, 45%) among the respondents. The age distribution ranged from 18 to 39 years old and the majority were between 18 and 29 years old. The majoritys marital status was unmarried (n=101, 53.4%). The majoritys education level was university level (n=135, 71.4%). Their professions were mainly in the service sector (n=84, 44.4%) and in the military, police, government and education sector (n=33, 17.5%), followed by the information industry sector (n=21, 11.1%). The majority had monthly average incomes between $30,001 and $40,000 (n=78, 41.3%), followed by $40,001 and $50,000 (n=28, 14.8%). The majority had monthly average expenditure of between $5,001 and $10,000 (n=64, 33.9%), followed by $10,001 and $20,000 (n= 60, 31.7%).
4.2 Reliability and Validity Analysis
In this section, reliability analysis and factor analysis are described respectively.
4.2.1 Reliability Analysis
In questionnaire reliability testing, the reliability of the scale was tested by using Cronbach's α value proposed by Hair et al. [5] to measure the internal consistency of each facet. If α was larger than 0.7, the scale had high reliability. The reliability of the questionnaire was acceptable. The Cronbach's α values for all the study facets ranged from 0.713 to 0.953. They all attained Cronbach's α value criterion of 0.7. Hence, all facets of this study had good reliability level and each facet had high internal consistency.
4.2.2 Factor Analysis
In this study, we first performed a Bartlett's Sphericity Test. The test result was 5947.683 (Sig.= 0.000 <0.05) in Chi-square value, approaching 0.00, and it reached the significant level. This means that the items had a strong correlation between each other and the data were suitable for factor analysis. Furthermore, the result of Kaiser-Meyer-Olkin (KMO) test was 0.855. This means that each question had a high common variance, and the variations were very low in uniqueness.
The cross-loading scale for each facet shows that all factor loadings of all questions were greater than 0.5 and the other non-facet factor loadings were less than 0.5. Hence, the cross-loading analysis for each facet had reached the standard proposed by Chin [2]. The above analysis results prove that the study questionnaire had a good construct validity.
4.3 Research Model Validation
In the parameter estimation of SmartPLS, the bootstrapping method was used for analysis. Resampling of samples was used to estimate the distribution of statistical amounts. The settings for resampling was based on the suggestion of Chin [2]. To verify the significance of the estimated values of model structural paths, the resampling number was set to 500.
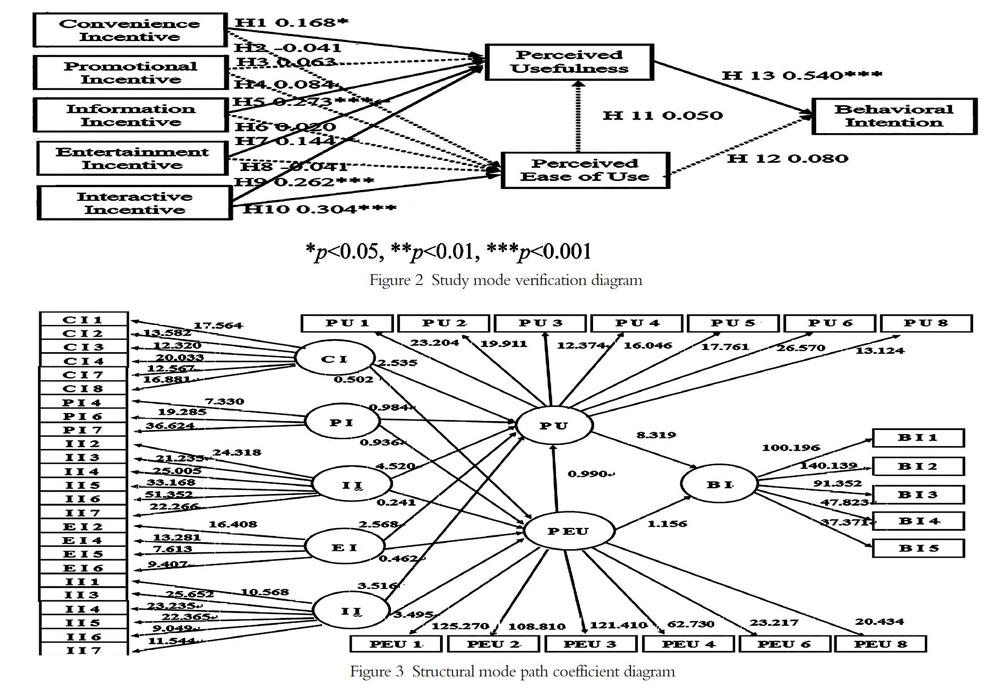
The research model verification results, except for the hypotheses H1, H5, H7, H9, H10, and H13, which received a significant level of verification support, the other hypotheses did not receive verification support. The model verification shows in Figure 2; the structural model path coefficient diagram shows in Figure 3:
4.4 Hypothesis Verification and Results
The results of model validation show that convenience, information, entertainment and interactive incentives all had a positive effect on perceived usefulness; and perceived usefulness had a positive effect on behavioral intention. As to the influence of convenience, promotion, information, entertainment, and interactive incentives on the perceived ease of use, only interactive incentive had significant effect. However, it did not indirectly affect behavioral intention via perceived ease of use.
5 Conclusions
The investigation of behavioral intention is to understand users acceptance and using willingness of the store app which can help narrow the gap between stores and consumers, and help improve operations. This study uses TAM as a framework and applies incentive theory to the external variables to determine whether consumers behavioral intention in using the app can be indirectly affected via perceived usefulness and perceived ease of use when the consumers are under various external stimuli and incentives.
The study results revealed that the external variables of convenience, information, entertainment and interactive incentives indirectly affect consumers behavioral intention through perceived usefulness. As to the influence of convenience, promotion, information, entertainment and interactive incentives on the perceived ease of use, only interactive incentive is significant, yet it does not indirectly affect behavioral intention through perceived ease of use.
Reference:
[1]張志勇,翁仲铭,石贵平,廖文华(2013),物联网概论,碁峰信息股份有限公司.
[2]Chin, W.W. (1998), “The Partial Least Squares Approach to Structural Equation Modeling,” In G. A. Marcoulides (Ed.), Modern Methods for Business Research. Mahwah, New Jersey: Lawrence Erlbaum Associates, pp. 295-336.
[3]Coetzee, L., & Eksteen, J. (2011), “The Internet of Things-promise for the Future an Introduction,” Proceedings of the IST- Africa Conference, pp. 1-9.
[4]Davis, F.D., Bagozzi, R.P., & Warshaw, P.R. (1989), “User Acceptance of Computer Technology: A Comparison of Two Theoretical Models,” Management Science, Vol. 35, No. 8, pp. 982-1003.
[5]Hair, J.F., Anderson, R.E., Tatham, R.L., & Black, W.C. (1998), Multivariate Data Analysis (5th ed.), New Jersey: Prentice-Hall, Inc.
[6]ITU Internet Reports(2005), The Internet of Things, International Telecommunication Union.
[7]Welbourne, E., Battle, L., Cole, G., Gould, K., Rector, K., Raymer, S., Balazinska, M., & Borriello, G. (2009), “Building the Internet of Things Using RFID: The RFID Ecosystem Experience,” Proceedings of the IEEE Internet Computing, Vol. 13, No. 3, pp. 48-55.