Preliminary Design of a Submerged Support Structure for Floating Wind Turbines
2020-11-30LEConghuanZHANGJianDINGHongyanZHANGPuyangandWANGGuilan
LE Conghuan, ZHANG Jian, DING Hongyan, 2), 3), ZHANG Puyang, 2), and WANG Guilan
Preliminary Design of a Submerged Support Structure for Floating Wind Turbines
LE Conghuan1), 2), *, ZHANG Jian1), DING Hongyan1), 2), 3), ZHANG Puyang1), 2), and WANG Guilan4)
1) State Key Laboratory of Hydraulic Engineering Simulation and Safety, Tianjin University, Tianjin 300350, China 2) School of Civil Engineering, Tianjin University, Tianjin 300350, China 3) Key Laboratory of Coast Civil Structure Safety (Tianjin University), Ministry of Education, Tianjin 300350, China 4) Fujian Provincial Investigation, Design and Research Institute of Water Conservancy and Hydropower, Fuzhou 350000, China
Cost-effective floating wind turbines with efficient installations are highly desired in deep waters (>50m). This paper presents a submerged floating offshore wind turbines (SFOWT) concept for intermediate water depths (50–200m). The performance of SFOWTs can be improved through a judicious choice of configuration, pretension, and mooring line layout. Four SFOWTs with different configurations and a similar mass, named Cyl-4, Cub-4, Cyl-3, and Hex-3, were designed and analyzed. The responses of the four SFOWTs were predicted under operational condition and extreme condition. The results show that the four SFOWTs exhibited good performance under both conditions. The effect of platform configurations on power output was negligible under the operational condition. Under the extreme condition, among the four SFOWTs, the mean bending moments at the tower base were very close, while the maximum values differed by up to 21.5%, due to the configurations. The effect of wind-wave misalignment under the extreme condition was further analyzed. In general, the motion performances of the four-pontoon SFOWTs, Cyl-4 and Cub-4, were superior to those of the three-pontoon SFOWTs, Cyl-3 and Hex-3. Optimization studies of the mooring system were carried out on Cub-4 with different mooring line pretensions and four mooring layouts. The optimized Cub-4 could reduce the maximum motion responses in the surge, heave, and yaw by 97.7%, 91.5%, and 98.7%, respectively.
floating offshore wind turbine; structure design; dynamic response; aero-hydro-servo-elastic coupled analysis
1 Introduction
The development of offshore wind energy has been rapidly progressing in recent years. The latest data and report published by the Global Wind Energy Council (GWEC) reveal that 4.5GW of offshore wind capacity was installed in 2018. By the end of 2018, the cumulative installed offshore wind capacity increased to 23.1GW, showing a growth of 9% from that at the end of 2017. China is among the fastest-growing offshore wind markets in the world. In 2018, China installed and connected 1.8GW of offshore wind capacity, which is 40% of the global new offshore installations (GWEC, 2019). By 2018, over 80% of the global offshore wind farms were located in shallow waters (water depths smaller than 50m), supported by bottom-fixed foundations. However, with increasingly stringent environmental and ecological constraints, the development space for offshore wind power in shallow waters has become limited. Thus, it has become necessary to move wind farms to deeper waters to exploit superior wind resources with fewer space limitations, reduced noise, and visual impact. Bottom-fixed foundations for offshore wind turbines are limited to water depths of up to 50m because of their unfavorable economic performance and increased installation difficulties (GoldschmidtandMuskulus,2015).Floatingoffshorewind turbines (FOWTs) seem to be a feasible solution (Arapo- gianni., 2013), as they have many advantages in cost, construction, installation, and decommission in deep waters (Oh., 2018).
Floating offshore wind turbines are still at an early development stage. Their responses are rather complex and reflect the wind turbine aerodynamics, tower elasticity, wind turbine controls, incident waves, floating platform dynamic properties, and the floater mooring dynamics (Koo., 2014). Most FOWT concepts evolved from offshore oil and gas platforms. Therefore, the technical feasibility of FOWTs is beyond doubt. However, some significant issues regarding FOWTs need to be addressed before they can be widely applied, such as coupled dynamics characteristics, economic viability, acceptable motions, and stability. In contrast to an offshore oil and gas platform, an FOWT has a raised center of gravity and a large overturning moment because of the large payload from the wind turbine and nacelle and the large aerodynamic loads high above the water surface; this raised center of gravity and large overturning moment will severely hamper its stability, especially in the context of offshore wind power production where minimal hull weight is needed to reduce costs (Roddier., 2010). In addition, offshore oil and gas platforms are designed and optimized for much deeper waters (typically 1000m or greater).
A proper concept of FOWTs is critical to increasing reliability and decreasing costs. A few FOWT concepts have been proposed for deeper waters in recent years (Butter- field, 2005; Roddier., 2010; Jonkman and Matha, 2011; Utsunomiya., 2013; Han., 2017). Floating offshore wind turbines can be classified into three main types based on the stabilization techniques: spars (ballast stabilized with a small water plane area), tension leg platforms (TLPs, mooring line stabilized), and semi-submersibles (buoyancy stabilized with a large water plane area) (Jonkman and Matha, 2011). Among the floating wind turbines, the semi-submersible concept relies on the water plane area, a fairly deep draft, and ballasting to maintain stability, which means the semi-submersible is more flexible in terms of seabed conditions and drafts and has great advantages in installation (Luan., 2016; Zhang., 2020); however, it has a relatively larger water plane area, which will cause larger amplitudes of wave-excitation load and dynamic responses (Matha, 2010; Luan, 2018). The Spar has the advantage of low cost of the mooring system, which is mainly used for station keeping rather than providing stability for the FOWT, compared with the TLP, which has a costly mooring system. However, it usually requires a deep draft, which means it is not suitable for relatively shallow water (Nematbakhsh., 2014). The TLP concept has been considered as a possible solution for intermediate water depths, since the taut mooring system may be better suited for relatively shallow water than a catenary mooring system. Meanwhile, compared with the other two floating concepts, the TLP features reduce platform motions, thus reducing the variation in the generator power (Jonkman and Matha, 2010; Bae and Kim, 2013; Han., 2017; Oh., 2018; Le., 2019).
Studies on the FOWT dynamic characteristics have been performed through numerical simulations and model tests (Coulling., 2013; Shin., 2013; Ramach- andran., 2014; Choi., 2015; Liu., 2016). Only few of the studies focused on optimizing the designs of support structures and mooring systems (Myhr., 2011; Goupee., 2014; Campanile., 2018). Bachynski and Moan (2012) designed and analyzed five different TLP wind turbines using Simo, Riflex, and AeroDyn tools in a coupled analysis to evaluate platform motions and loads on the turbine components and tendons. The effects of various design variables on structural response in four wind-wave conditions were investigated to optimize the TLP wind turbine design. Koo(2014) conducted 1:50-scale model tests for the global performance of three floating turbine models: a spar, semi-submersible, and TLP. Three typical offshore mooring types, taut mooring system, catenary mooring system, and tendon mooring system, were selected to establish the advantages and disadvantages among the three floating platform concepts. Campanile. (2018) designed and selected mooring systems for intermediate and deep waters by considering ultimate, accidental, and fatigue limit states design conditions and conducted a preliminary cost analysis. They presented some recommendations on mooringconfiguration choice as a function of water depth. Through a numerical parametric study, Benassai. (2014, 2015) investigated the optimal mooring design, with both catenary and vertical tensioned mooring line configurations, for FOWTs with tri-floater semi-submersible structures. Lefebvre and Collu (2012) investigated seven floating foundation concepts for the National Renewable Energy Laboratory (NREL)-5 MW wind turbine in the North Sea and compared them through technical-economic analysis.
To realize low cost FOWTs and efficient installation, previous researchers have proposed a submerged floating offshore wind turbine (SFOWT) to support a 5MW turbine at intermediate water depth (50–200m) (Han., 2017; Le., 2019). The SFOWT offers multiple advantages: It is self-stabilized in the transportation and installation phases because of its large water plane area. It can provide a sufficient restoring moment in ballasted conditions and can thus be wet-towed together with the wind turbine from the quayside to the offshore site, eliminating the need for expensive construction barges and marine crane. This also means that the prefabrication, assembly, and commissioning processes can be performed onshore or in a dockyard, thus significantly reducing offshore construction time and installation costs. The main structure of the SFOWT is submerged with a relatively small waterline area and little volume close to the free surface in the operation phase, which can reduce the wave force and mean drift force on the platform. An SFOWT is stabilized and positioned by the taut mooring lines. Limited platform motions are expected without a fairly deep draft and a large footprint for spread mooring systems (Le, 2019).
As a support structure, the SFOWT needs to have sufficient stability to prevent the platform from capsizing, good wave response to prevent the platform from compromising the wind turbine performance, and good station keeping performance to prevent the platform from inadmissible shifting (Benassai., 2015). Han(2017) analyzed the SFOWT stability both during the transportation phase and the operation phase and studied the dynamic responses of SFOWT during the operation phase. The results showed that the SFOWT has good stability for wet towing and good dynamic behavior during the operation phase. Le(2019) investigated the coupled dynamic responses of the SFOWT under different mooring conditions. The effects of mooring parameters such as tether length, pretension, and tether failure on the SFOWT performance were studied. The SFOWT configuration and design parameters will influence its dynamic behavior and eventually its safety and cost. How to improve the SFOWT stability and performance without a significant increase in costs by a judicious choice of floating platform configuration and mooring system is a topic that needs to be addressed.
In this study, the dynamic behaviors of four different SFOWTs, deployed in 100m water depth, with reference to both operational and extreme environmental conditions, were analyzed and compared to optimize the SFOWT design. The effects of various variables, such as misaligned wind-wave, pretension, and mooring lines layout, on SFO- WT responses were investigated based on hydro-aero-servo-elastic time-domain analyses using a coupled simulation tool, SESAM and FAST (Coulling., 2013; Det Norske Veritas, 2013; Jonkman, 2009b). The motion performances of two four-pontoon SFOWTs were compared with that of two three-pontoon SFOWTs. Furthermore, optimization studies of the mooring system were carried out on a four-pontoon SFOWT with different mooring line pretensions and four mooring layouts.
2 Configurations of the SFOWT and Environmental Conditions
The SFOWT considered in this study consisted of a wind turbine, tower, submerged platform, and mooring system. As shown in Fig.1, the submerged platform was composed of a center column for supporting the wind turbine, three or four side columns interconnected by hori-zontal pontoons, and three or four cross braces and diagonal braces. The center and side columns were interconnected by cross braces and diagonal braces. The SFO- WT buoyancy was mainly provided by the side columns, horizontal pontoons, and cross braces. Four different configurations of submerged platforms with similar mass, named Cyl-4, Cub-4, Cyl-3, and Hex-3, were selected for analysis and comparison, as shown in Fig.1. Table 1 summarizes the principal properties of the SFOWTs. The mooring system consisted of three or four sets of vertical mooring lines and suction anchors to maintain the SFO- WT position. For safety reasons, each set of mooring lines included two or three steel tethers to reduce tension on the mooring line. The coordinate system and layout of the vertical mooring lines are shown in Fig.2. The main parameters of the mooring system are presented in Table 2.
The design was based on the NREL 5MW reference wind turbine deployed in 100m water depth, and the main properties of the wind turbine are listed in Table 3 (Jonkman, 2009). Two design conditions, operational condition and extreme condition, were investigated and are presented in Table 4. The operational condition is relative to the rated power output.
3 Numerical Modeling
The motion equation of the SFOWT in the time-domain can be expressed as follows (Bae and Kim, 2013; Bae., 2017; Han., 2017):

Fig.1 Four configurations of submerged platform.
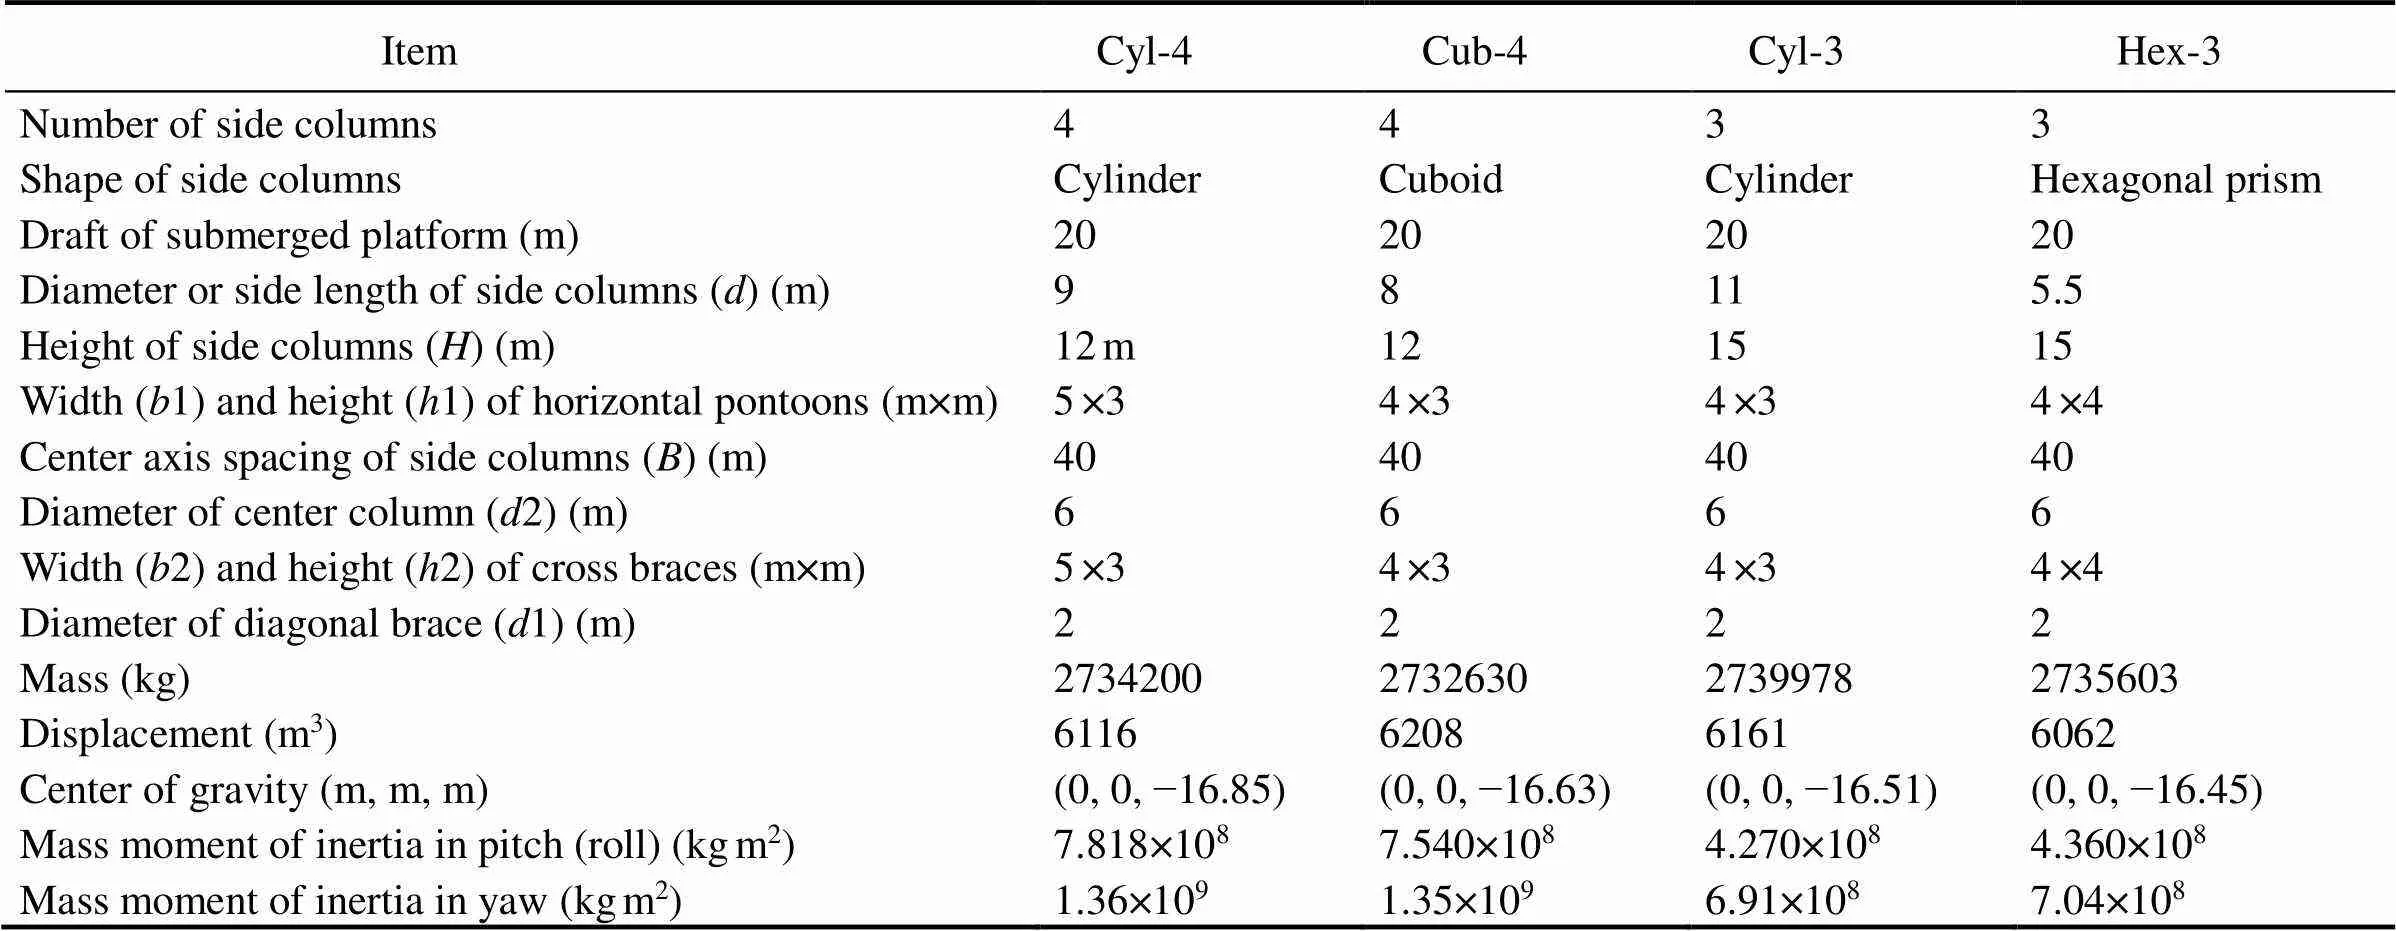
Table 1 Specification of the SFOWTs
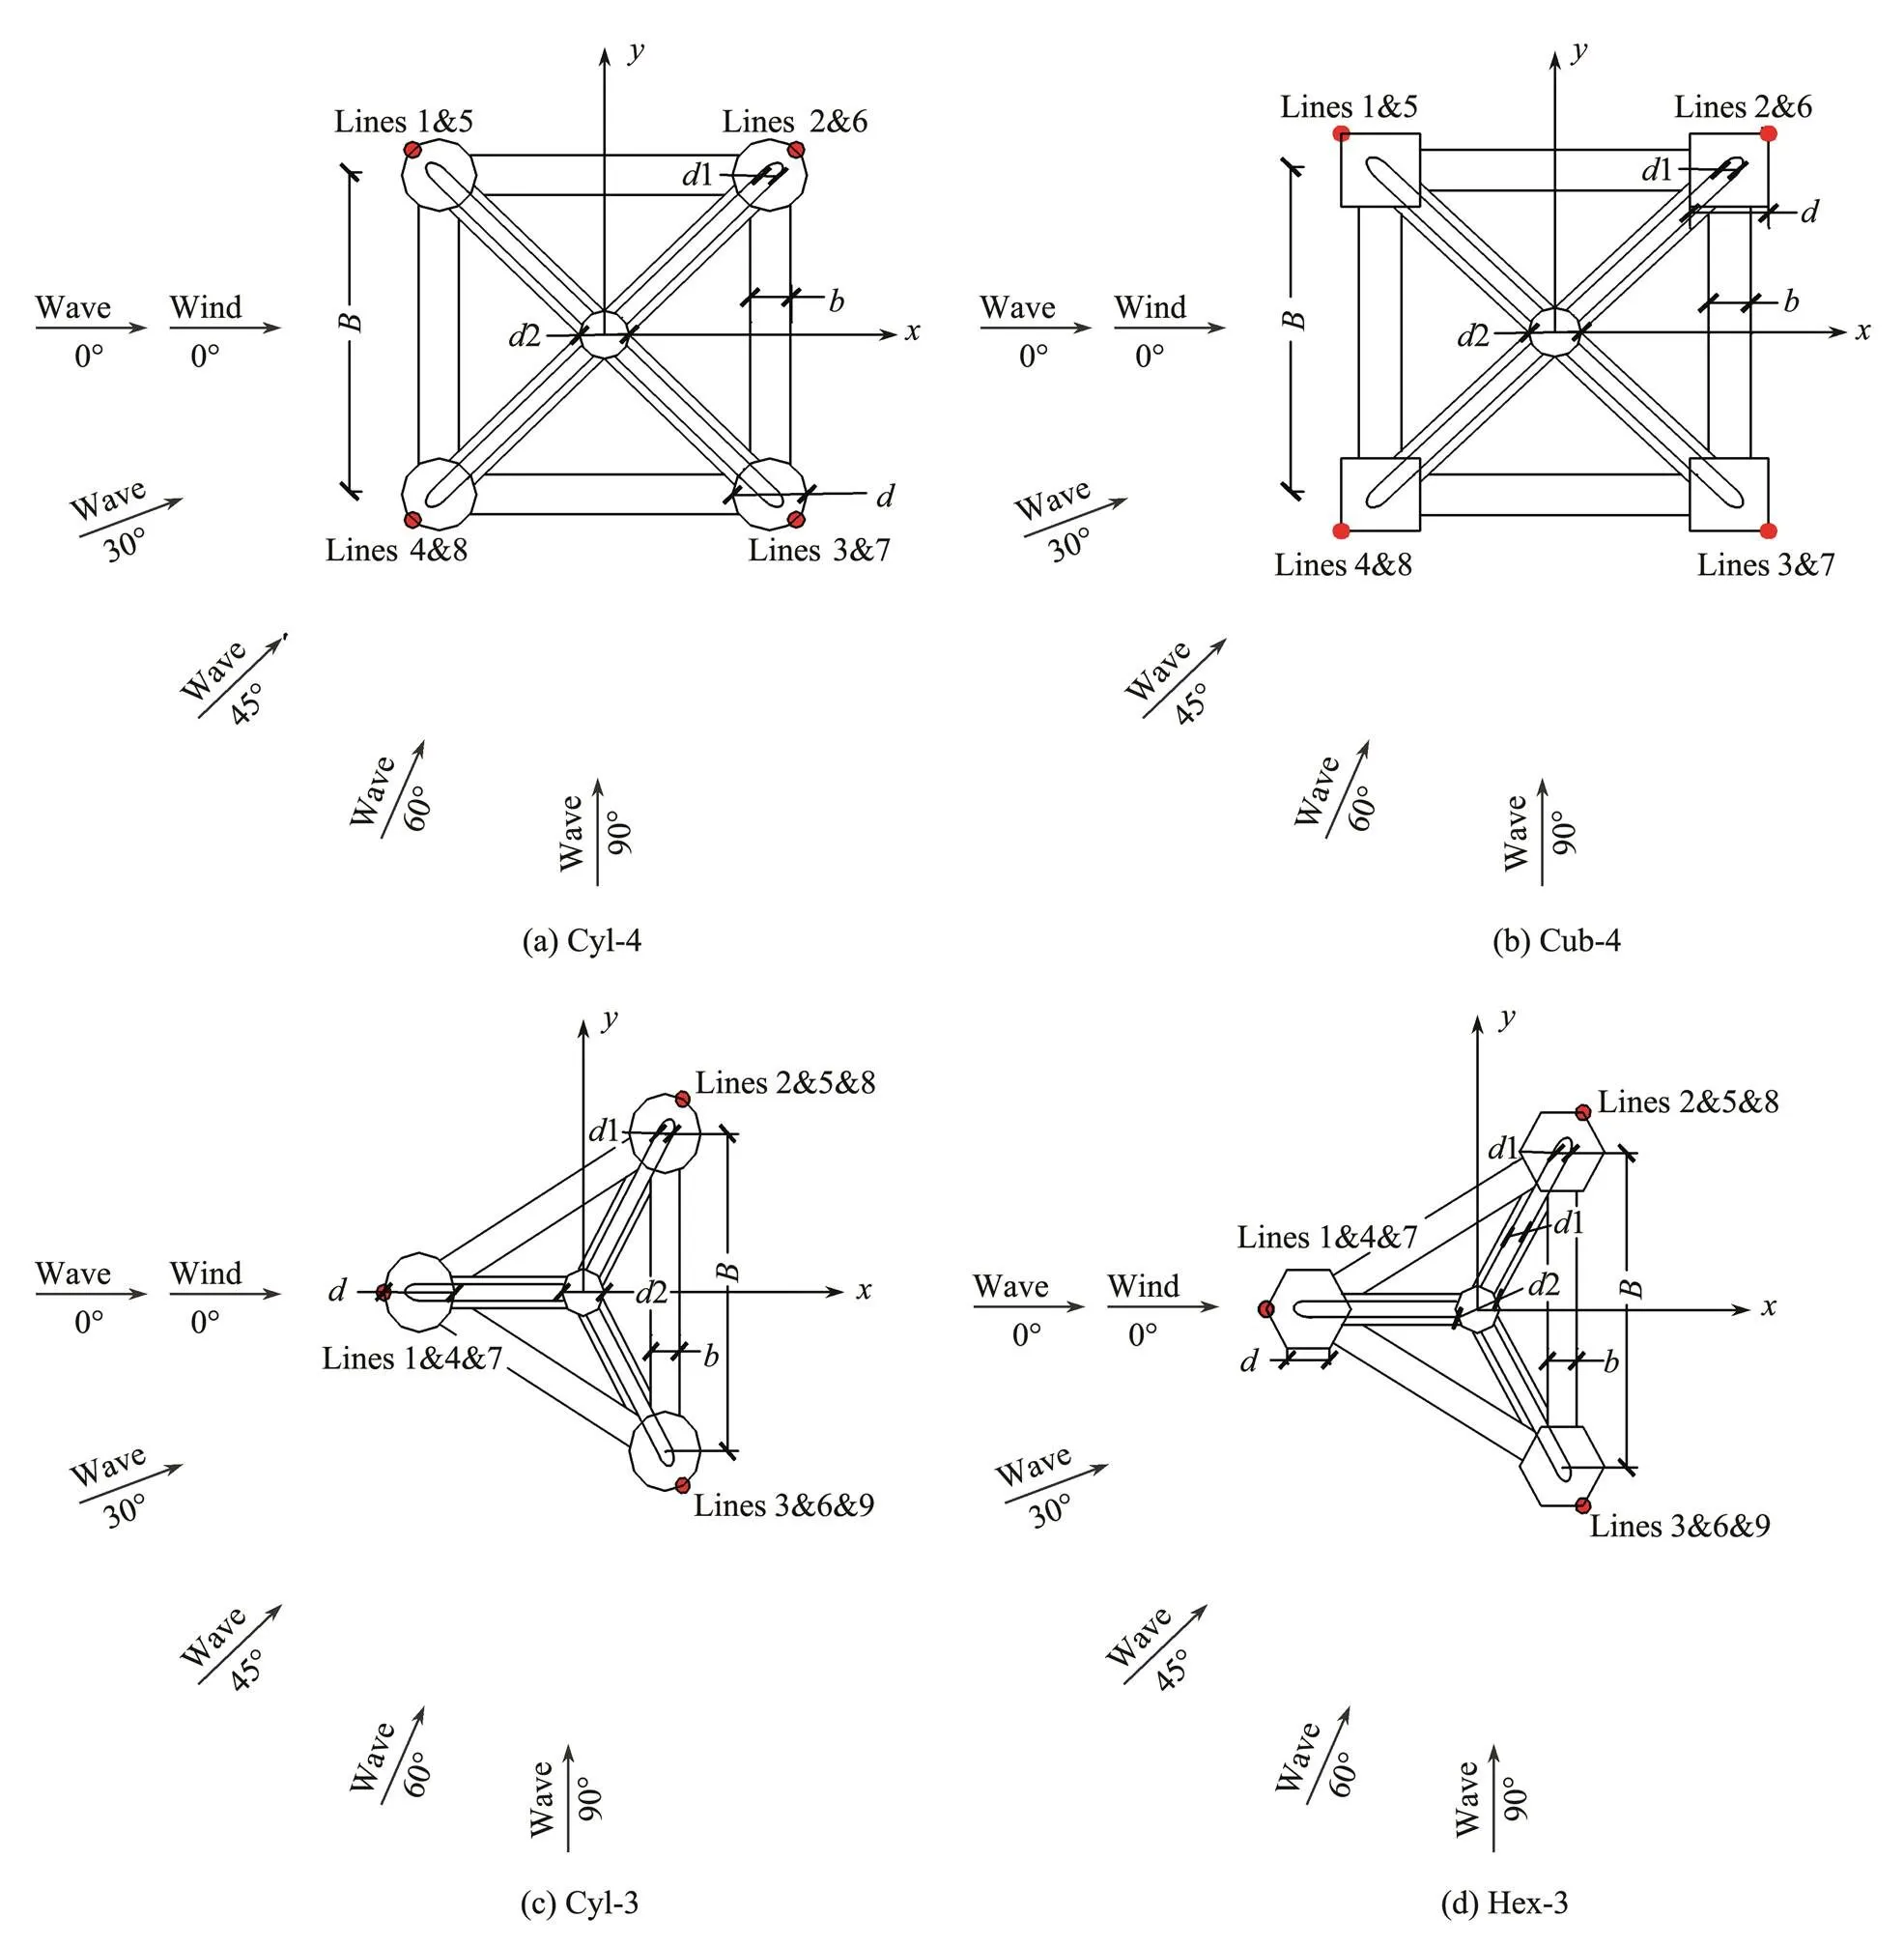
Fig.2 Coordinate system and mooring layout.

Table 2 Principal properties of the mooring systems

Table 3 Main properties of NREL 5 MW reference wind turbine

Table 4 Operational condition and extreme conditions


The JONSWAP spectrum was employed to generate ir-regular waves. A turbulent wind field was generated using TurbSim, which was developed by the NREL (Jonkman, 2009a). Turbulent winds with average speeds of 11.4ms−1(rated wind speed) and 46.9ms−1(extreme wind speed caused by a typical typhoon in an offshore wind farm at the South China Sea) were simulated according to the Kaimal wind velocity spectrum provided by IEC61400-3. Fig.3 gives the time series of wind speed and wave elevation. The wind direction was aligned with the positive direction of the-axis. The simulations were performed for 10000s. The data corresponding to 4000–5000s, which represent typical responses were selected for demonstration. The results were based on the 10000s simulation, in which the first 1000s was removed to eliminate the startup transient effect. The damping ratio of the tower was set to 0.01.

Fig.3 Time series of wind speed and wave elevation. (a), Wind speed; (b), Wave elevation.
Numerical simulations in the time-domain were carried out using a fully coupled nonlinear aero-hydro-servo-elastic code FAST, developed by NREL. FAST, one of the most prevalent FOWT analysis codes, has been used and validated in numerous floating wind turbine studies (Jonkman,2009b;Stewart.,2012;Coulling.,2013; Browning., 2014). It mainly couples five modules, namely AeroDyn, HydroDyn, ServoDyn, ElastoDyn, and MAP++, for FOWT simulation, as illustrated in Fig.4. The AeroDyn is a time-domain wind aerodynamics module that can enable the aero-elastic simulation of a horizontal-axis wind turbine to compute aerodynamic loads. The wake effect was considered via induction factors based on the quasi-steady blade element momentum theory, and the effect of skewed wake was considered using the Pitt and Peters model. The tower shadow effect was considered based on the potential flow theory. The HydroDyn module was used to compute the hydrodynamic loads. The hydrodynamic coefficients, such as the added mass, potential damping, hydrostatic restoring stiffness, and first-order wave-excitation force transfer function, were calculated by the 3D diffraction/radiation code HydroD/Wadam in the frequency domain, and these hydrodynamic coefficients were fed to the HydroDyn module in FAST. The ServoDyn module is a control and electrical-drive model for blade pitch, generator torque, nacelle yaw, high-speed shaft brake, and blade-tip brakes. The platform hull was simulated as a rigid body, while the blades and tower were simulated as flexible finite elements in the ElastoDyn module. MAP++ was used to simulate the mooring dynamics. It is a library designed to model the steady-state forces on a multi-segmented, quasi-static mooring line. More details can be found in Masciola(2013).

Fig.4 An overview of codes for the fully coupled analysis (Han et al., 2017).
4 Results
4.1 Natural Frequencies
The natural frequencies of SFOWTs are determined from free decay tests in FAST. In the free decay tests, the SFOWTs are released from a certain offset for each DOF in calm waters, with the wind turbine parked and all blades feathered. The six-DOF natural frequencies of the four SFOWTs are compared in Fig.5. As expected, the four SFOWTs had similar natural frequencies in six DOFs. The natural frequencies in vertical plane motions (heave, pitch, and roll) were significantly higher than those in horizontal plane motions (surge, sway, and yaw), which also indicates that the SFOWTs in the vertical plane had greater stiffness than the SFOWTs in the horizontal plane. All the natural frequencies in six DOFs were outside the first-order wave-excitation frequency range.
4.2 Operational Condition
Figs.6 and 7 illustrate the motion time series and corresponding statistics of the four SFOWTS under operational condition, respectively, when the wind and wave propagate along the positive surge direction. All four SFO- WTs had good performance under the operational condition. As expected, the motion responses in surge and yaw were far larger than those in heave and pitch. There was a certain difference in the motion response of the four SFO- WTs. The mean surges of Cyl-4, Cub-4, Cyl-3, and Hex-3 were 1.79, 1.07, 1.74, and 1.73m, respectively, far below the maximum admissible offset of 5m, corresponding to 5% of water depth (Bachynski and Moan, 2012). The responses in pitch and yaw of the four SFOWTs were very smallundertheoperationalcondition.Theyawsandpitches of Cyl-3 and Hex-3 were significantly larger than those of Cyl-4 and Cub-4. This is likely because the SFOWTs with four pontoons had a larger mass moment of inertia in pitch and yaw compared with the SFOWTs with three pontoons.
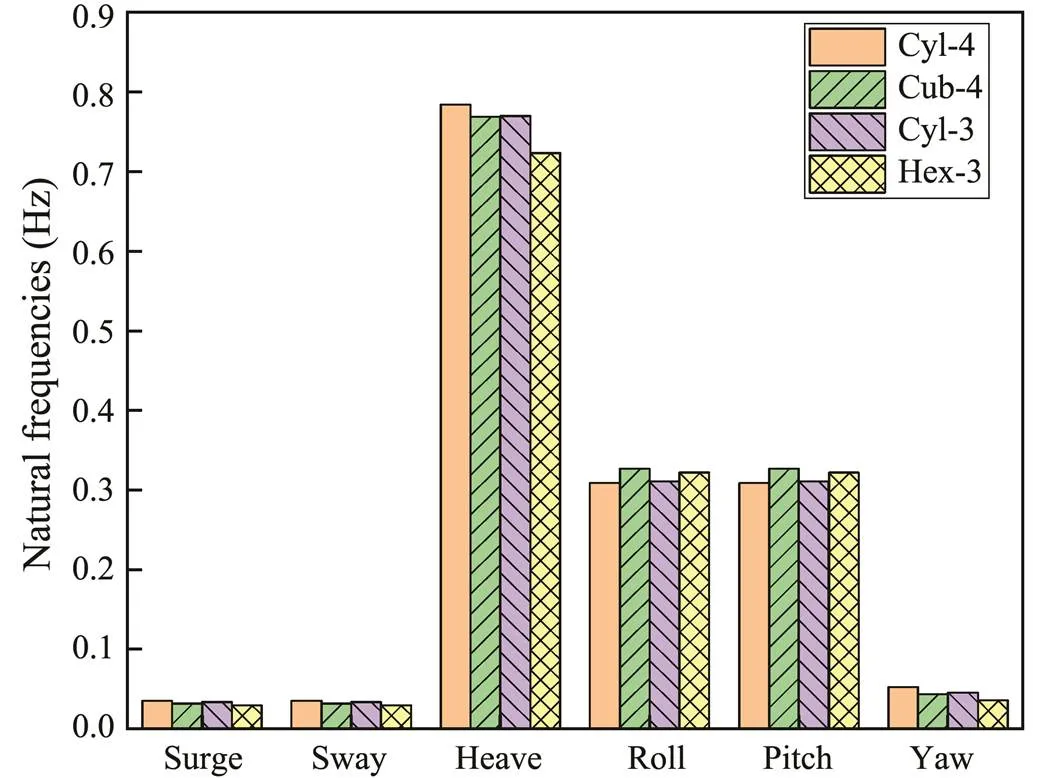
Fig.5 Comparisons of natural frequencies.

Fig.6 Time series of motion in (a) surge, (b) heave, (c) pitch, and (d) yaw under operational condition.
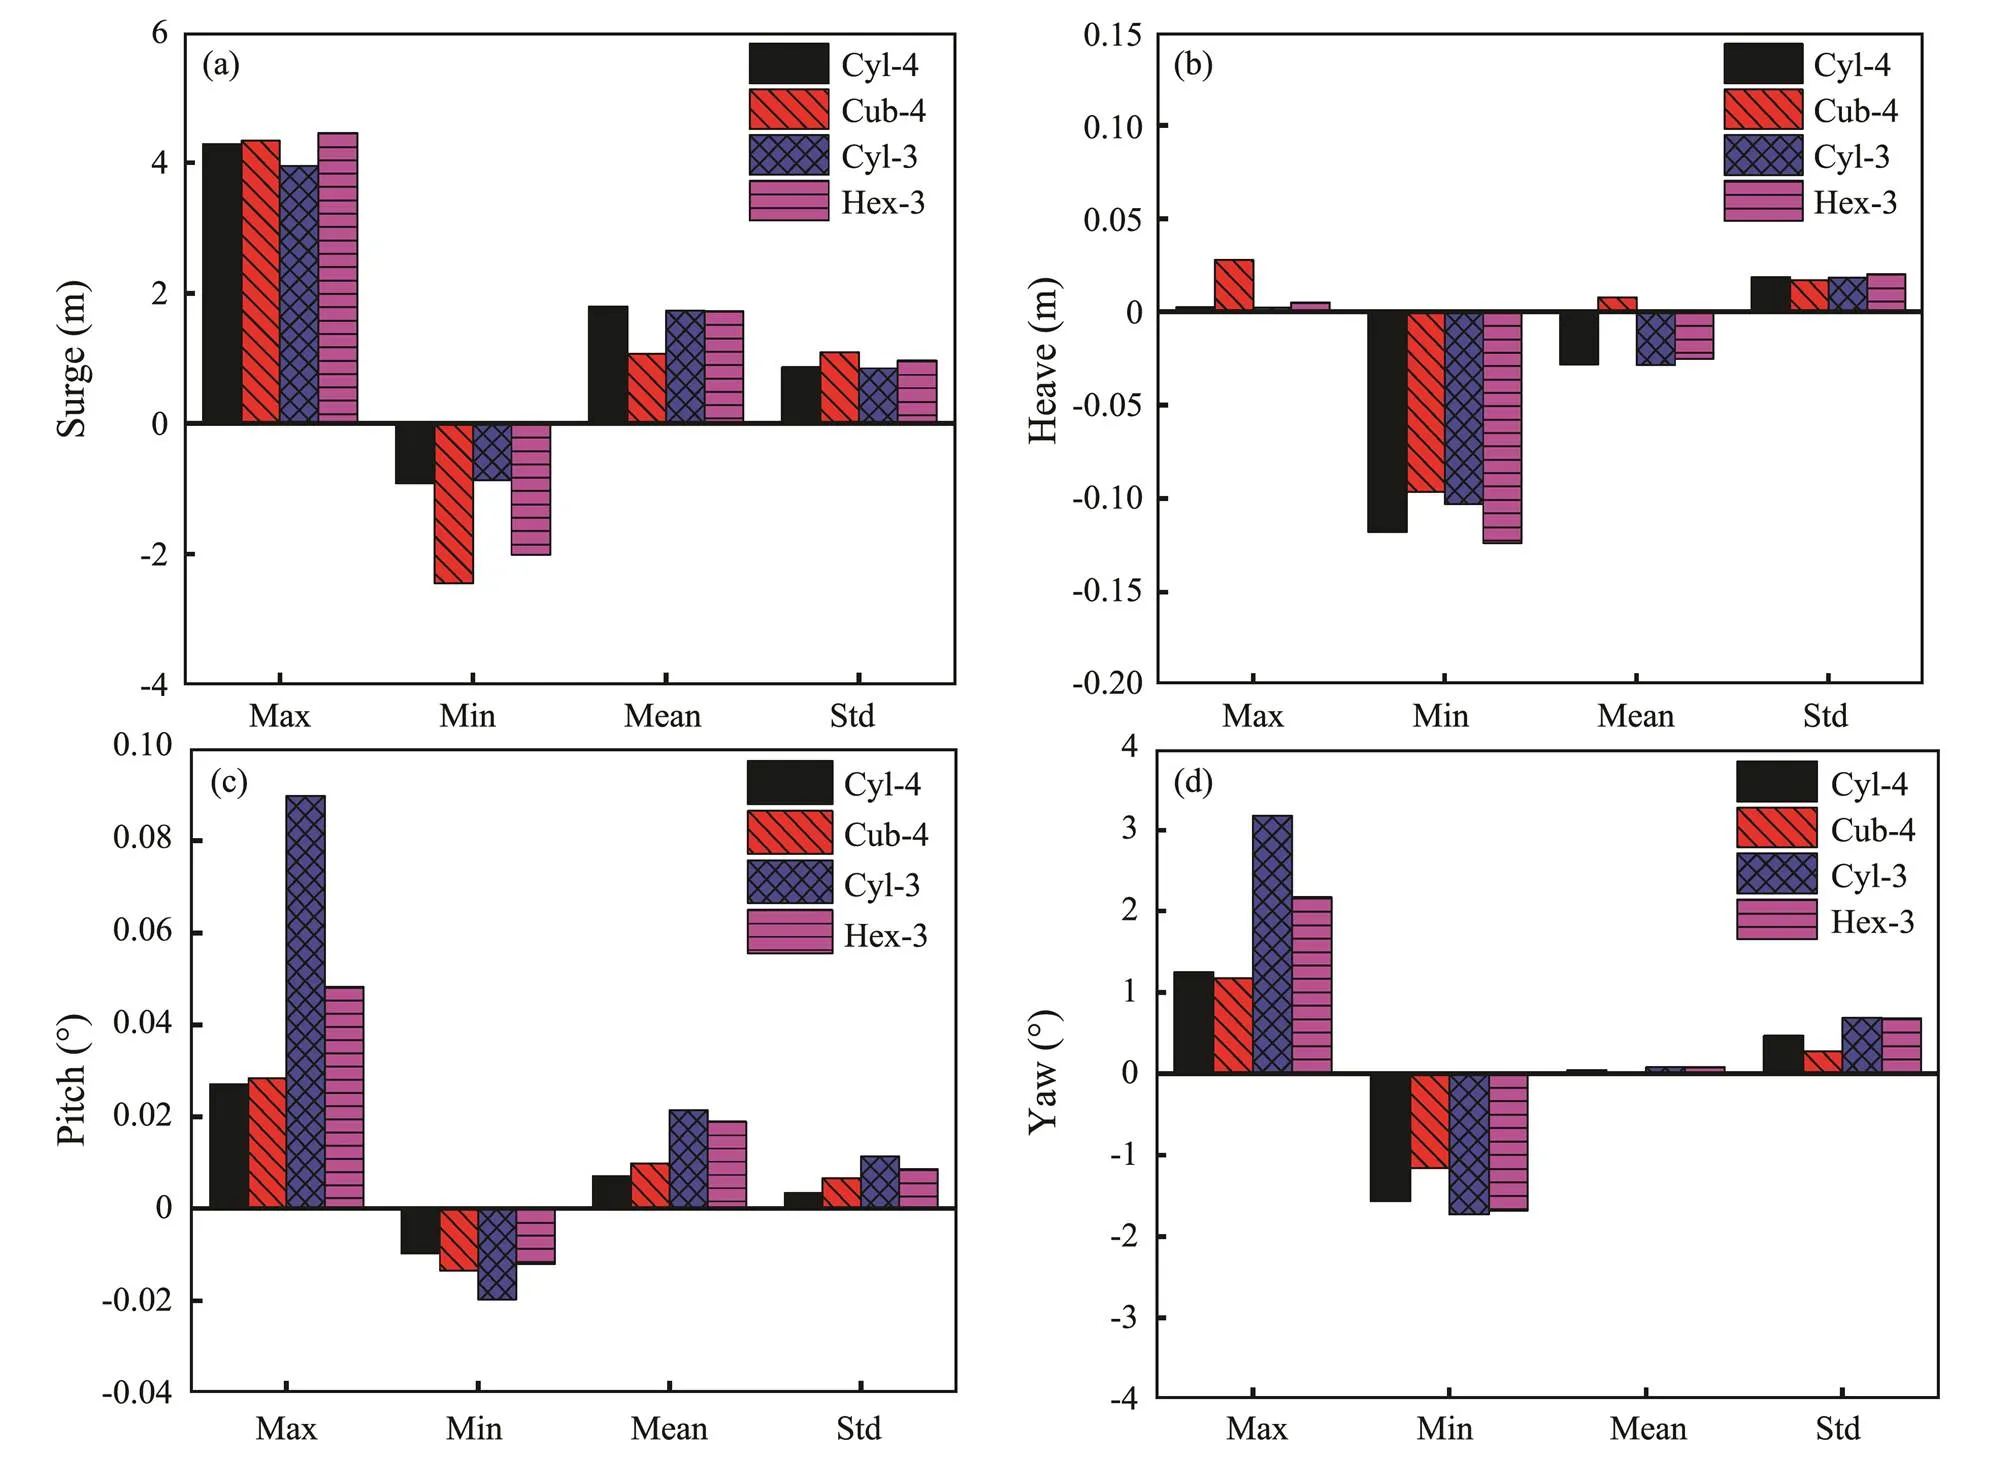
Fig.7 Statistics of motion in (a) surge, (b) heave, (c) pitch, and (d) yaw under operational condition.
Figs.8 and 9 show the time series and corresponding statistics of the wind turbine power generation and the bending moment at the tower base under operational condition, respectively. The values from the summary statistics, including the range of the 25th to 75th percentile, the range of the minimum to maximum value, the median and mean values, are displayed in the box chart. The mean power outputs of the four foundations, Cyl-4, Cub-4, Cyl-3, and Hex-3, were 4520, 4470, 4510, and 4510kW, respectively. The foundation configuration had a slight effect on the power output, which was dominated by the wind. The mean bending moments at the tower base of the four SFOWTs were very close. However, the range of bending moments was significantly affected by the foundation configuration. Among the four foundations, the largest maximum moment at the tower base was 111MNm, which appeared on Cub-4, and it was 1.42 times the smallest maximum moment, which appeared on Cyl-4.
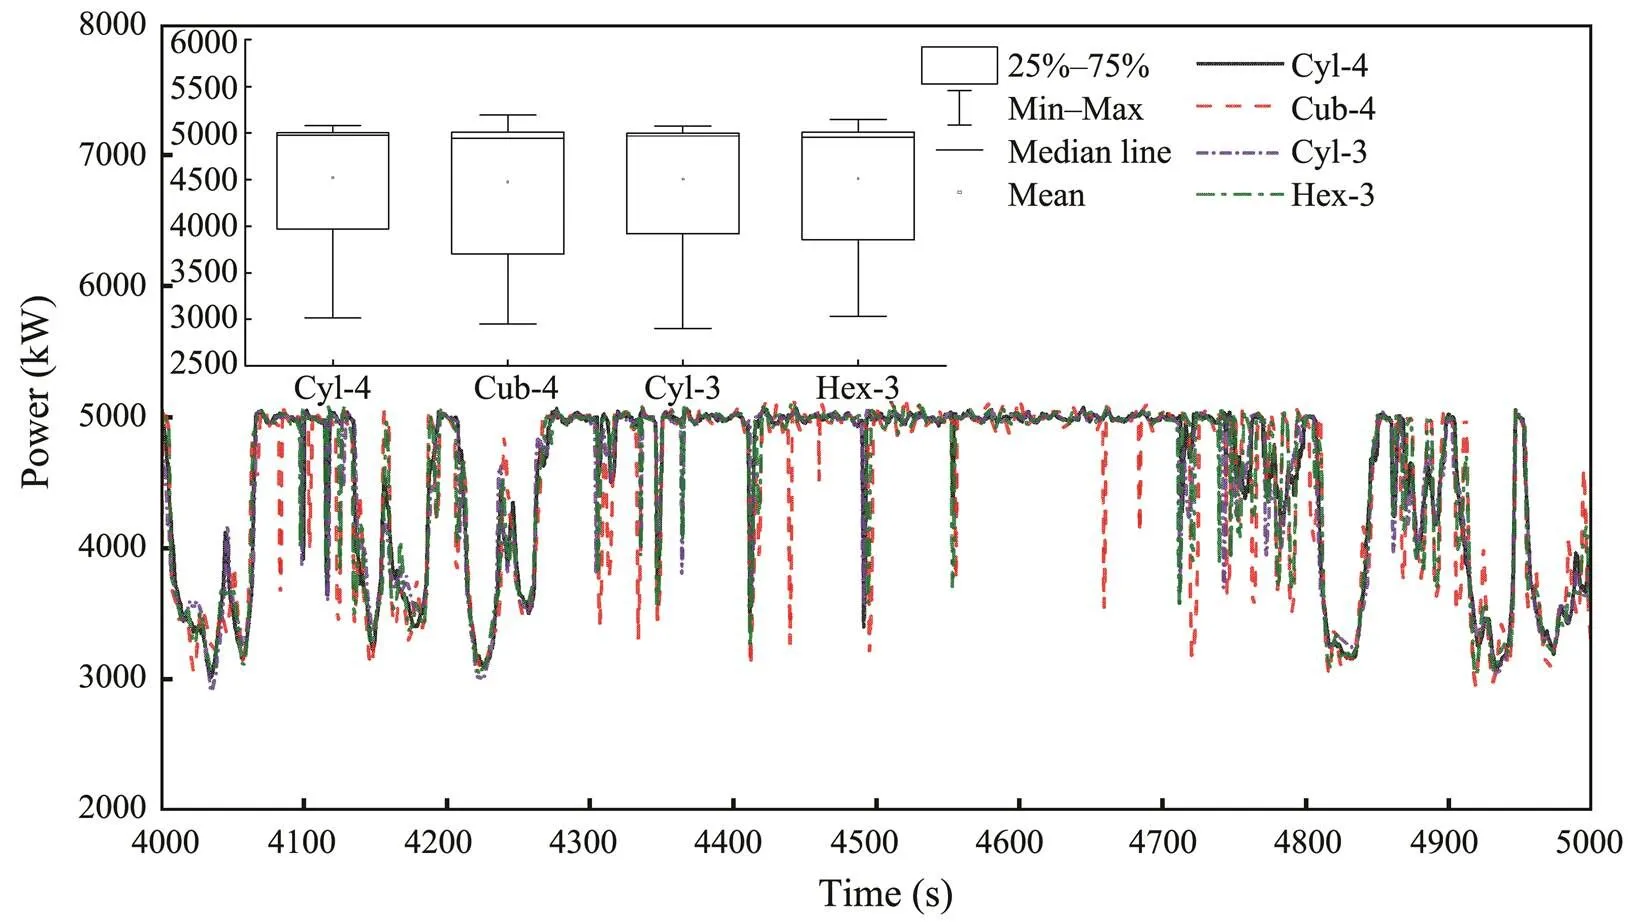
Fig.8 Time series and statistics of generator power.
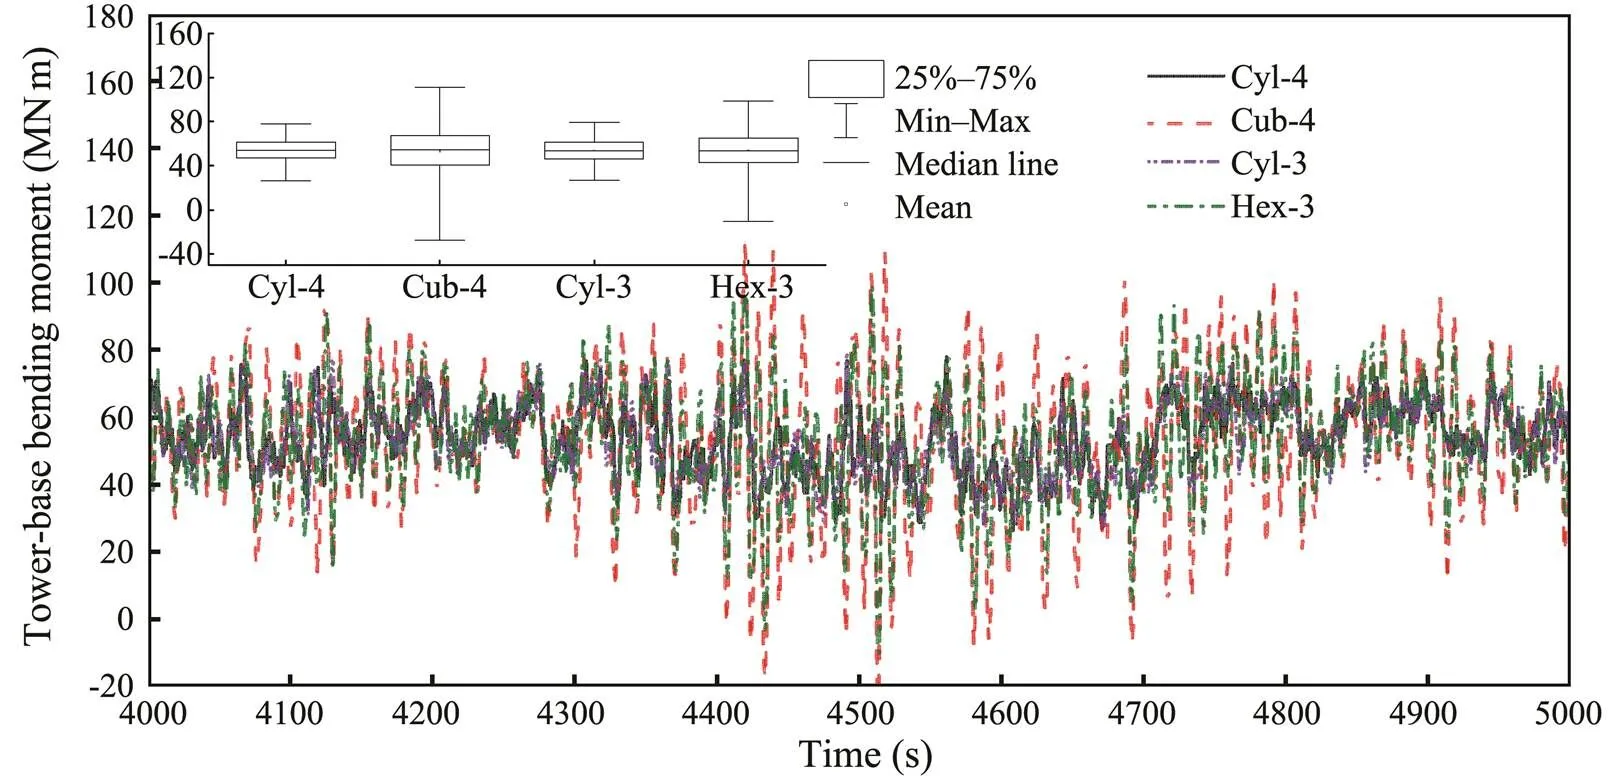
Fig.9 Time series and statistics of bending moment at the tower base.
Fig.10 shows the normalized tension statistics of the mooring lines. Mooring lines in the same position had similar tension. Therefore, only four mooring lines, mooring line 1# to 4#, which were in different positions, are provided for Cyl-4 and Cub-4, and three mooring lines, mooring line 1# to 3#, are provided for Cyl-3 and Hex-3. The initial pretensions in the mooring lines of the SFO- WTs with four pontoons and three pontoons were 3500 and 3100kN, respectively. The mooring line tension was normalized as the ratio of tension to the initial pretension. As shown in Fig.10, the tensions in the upstream mooring lines were higher than those in the downstream mooring line, due to the trim caused by the incident wave. Among the four SFOWTs, the largest normalized tension of mooring lines was 1.57, which appeared in the upstream mooring line 1# of Cyl-3, and the smallest normalized tension was 0.57, corresponding to the downstream mooring line 2# of Hex-3. The Cyl-4 had the smallest change in moor- ing line tension. Mooring line slacking was not captured under the operational condition.
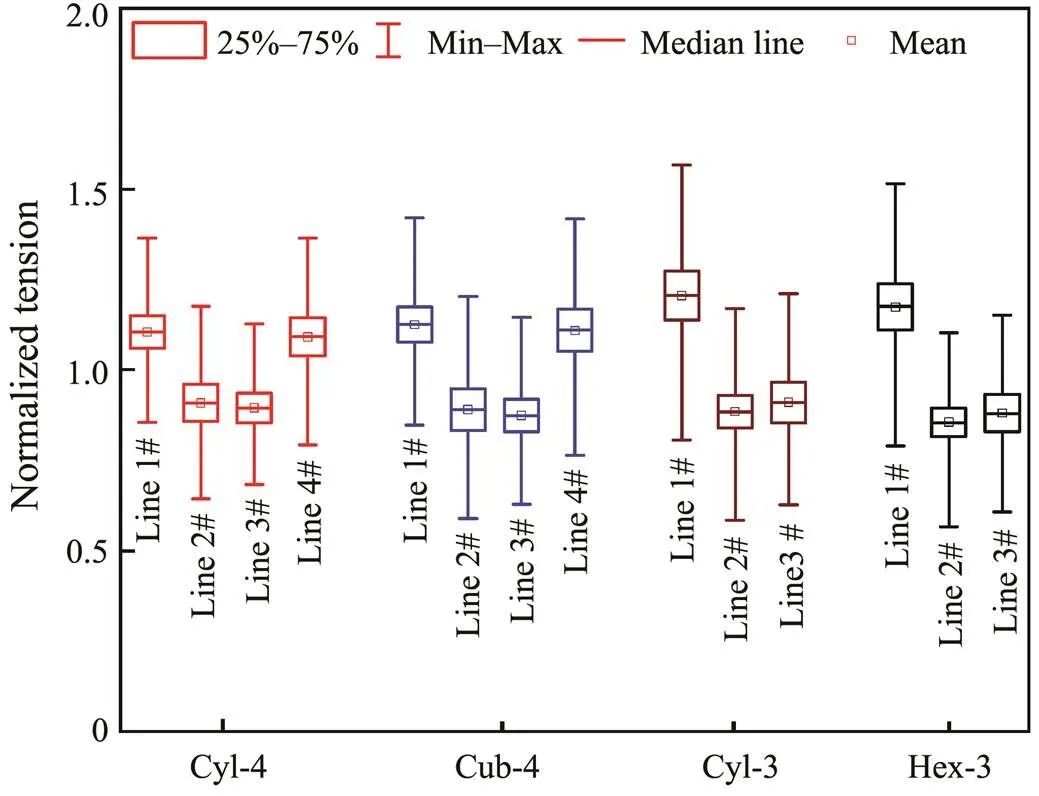
Fig.10 Normalized tension statistics of mooring lines under operational condition.
4.3 Extreme Condition
Figs.11 and 12 illustrate the motion time series and corresponding statistics of the four SFOWTs under extreme condition, respectively. There is a certain difference in the motion responses of the four SFOWTs. The maximum surges of the four SFOWTs, Cyl-4, Cub-4, Cyl-3, and Hex-3, were 14.30, 13.90, 18.40, and 14.30m, respectively; the maximum ratio reached 1.32. The mean surges were close, around 1.82m, which is below the maximum admissible offset of 5m. The heave motions were significantly higher than those under operational condition; the Cyl-3 had the maximum heave amplitude, 2.3m, while the Cub-4 had the smallest, 1.28m. The pitch responses of the four SFOWTs were still small under the extreme condition. The maximum pitch angles of Cyl-4, Cub-4, Cyl-3, and Hex-3 were 0.20˚, 0.40˚, 0.60˚, and 0.35˚, respectively, far less than 10˚, which is the maximum allowable pitch angle for FOWTs (Sclavounos., 2009). As shown in Fig.11(d) and Fig.12(d), the mean yaw responses of the four SFOWTs were small, while the maximum yaw amplitudes and standard deviations were relatively large; Hex-3 had the largest yaw amplitude (11.7˚) and standard deviation (3.84˚). Compared with the four-pontoon SFOWTs, the three-pontoon SFOWTs had a larger standard deviation, due to the smaller mass moment of inertia in yaw. The maximum yaw amplitude and standard deviation of Cyl-4 decreased by 50.2% and 46.8%, respectively, compared with those of Hex-3.
Fig.13 displays the power spectra of the four SFOWTs under extreme condition. The four SFOWTs exhibited similar trends. The power spectra of motions were mainly dominated by the wave frequency response, wind frequency response, and resonant response. As depicted in Fig.13(a), the surge motion was mainly dominated by the wave frequency response. The surge resonant response was relatively small. The power spectra of the heave motion (Fig.13(b)) captured the coupled behavior between the surge and heave motions. The power spectra were dominated by the wave frequency response, wind frequency response, and surge resonant response, while the heave resonant response was very small. The pitch motion was mainly dominated by the wave frequency response and surge resonant response, while the effect of pitch resonance was small. The spectra of yaw were dominated by the yaw resonant response, while the wave frequency response was quite small.

Fig.11 Time series of motion in (a) surge, (b) heave, (c) pitch, and (d) yaw under extreme condition.
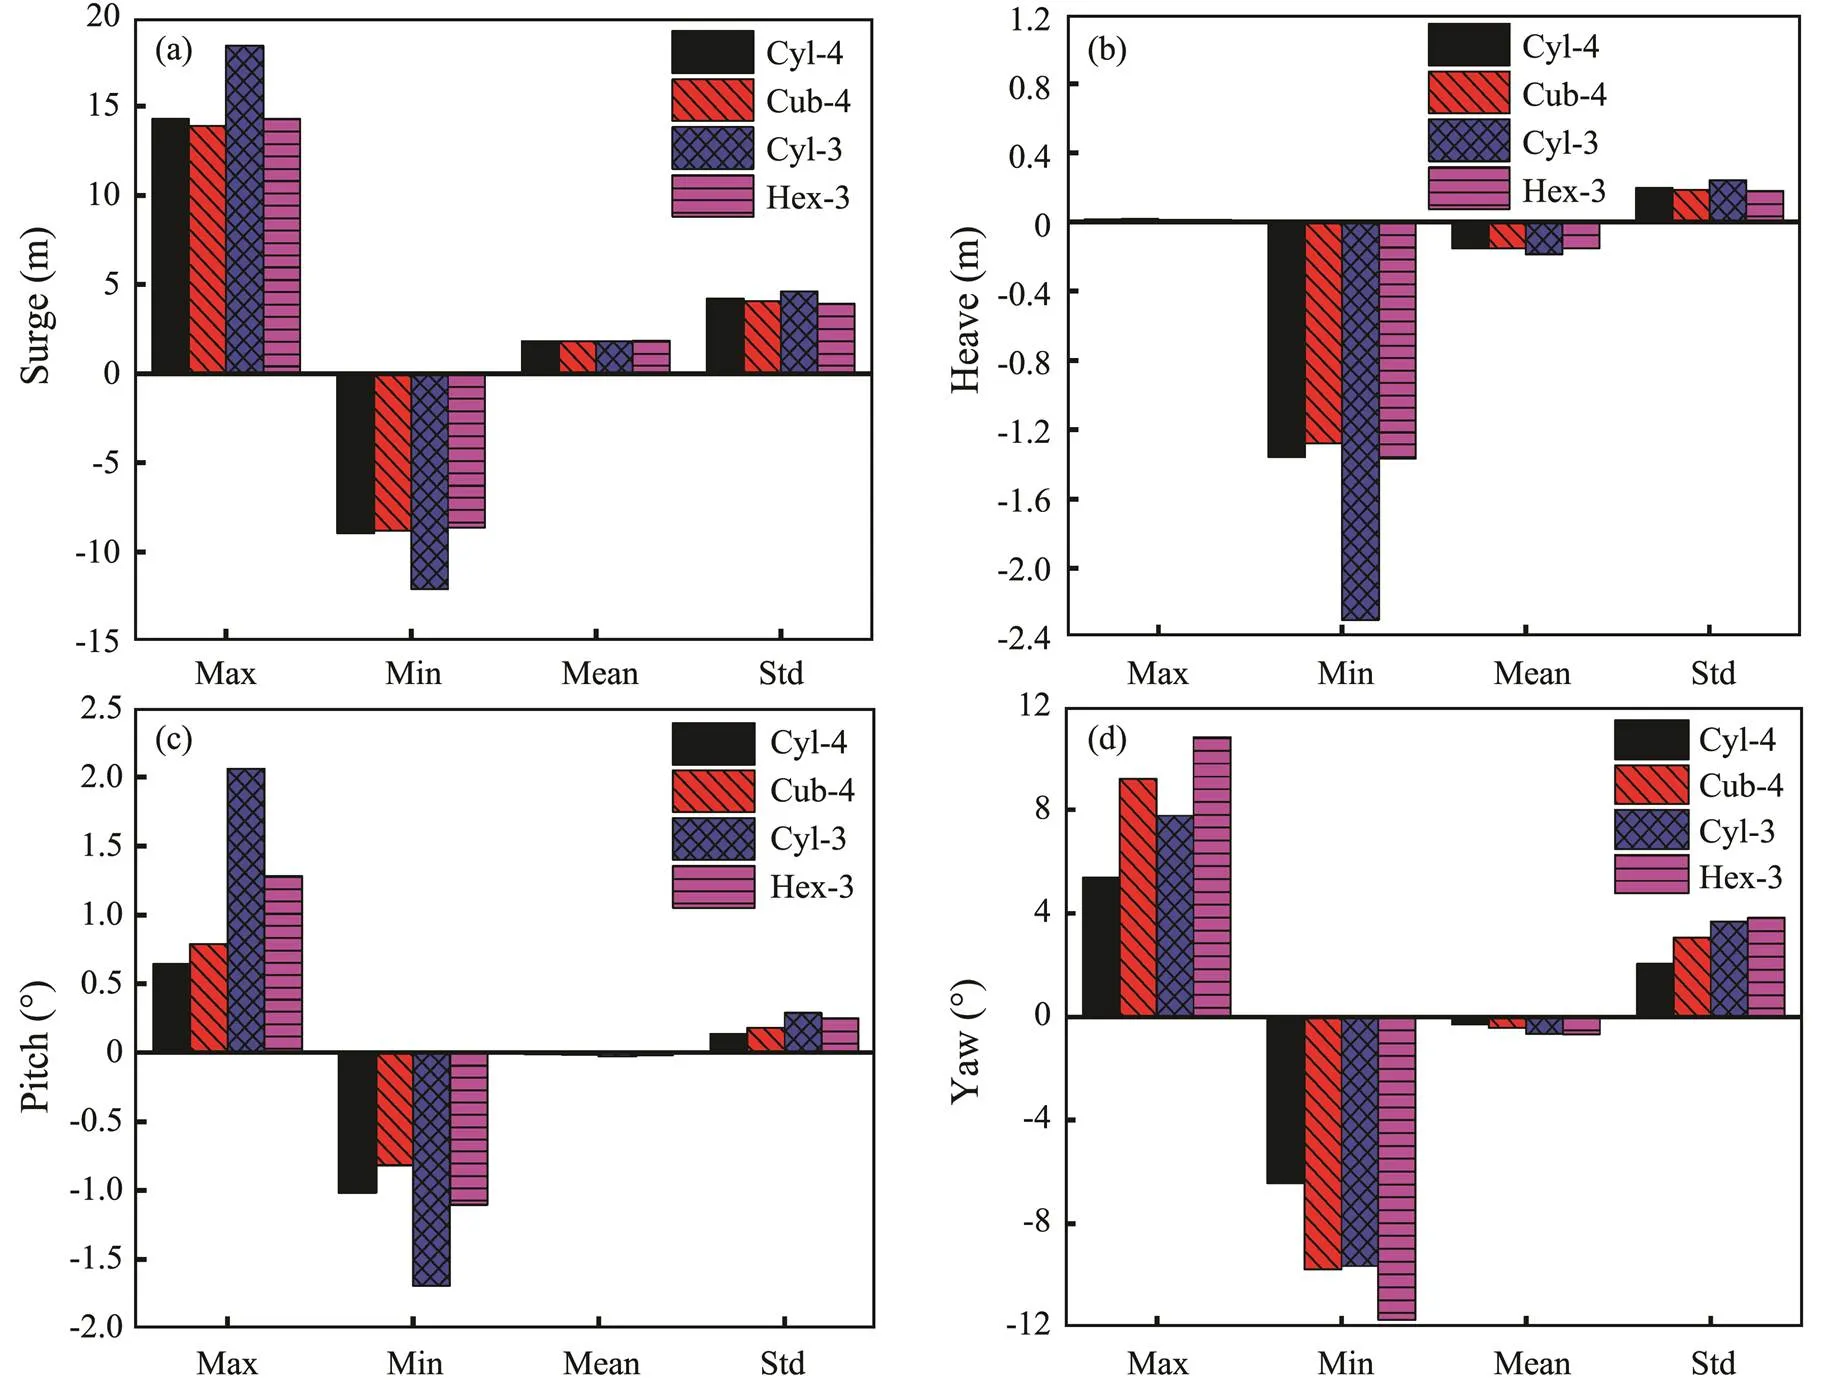
Fig.12 Statistics of motion in (a) surge, (b) heave, (c) pitch, and (d) yaw under extreme condition.

Fig.13 Spectra of platform motions in (a) surge, (b) heave, (c) pitch, and (d) yaw under extreme condition.
Fig.14 shows the time series, power spectra, and statistics of the bending moment at the tower base under extreme condition. The bending moment at the tower base was mainly dominated by the wave frequency response and the pitch resonant response. The mean bending moments of the four SFOWTs were very close, while the maximum bending moments differed by up to 21.5%, due to the foundation configurations. The Cyl-4 had the smallest maximum bending moment, which was likely because it had the smallest pitch.
Fig.15 shows the normalized tension statistics of mooring lines under extreme condition. Among the four SFO- WTs, the mean normalized tensions in upstream mooring lines exceeded 1, while those in downstream mooring line tensions were less than 1. The maximum normalized tensions were noticeably higher than those under operational condition. The largest normalized tension of mooring lines was 2.89, which appeared in the upstream mooring line 3# of Cyl-3, and the smallest normalized tension was 0.028, greater than 0, corresponding to the downstream mooring line 3# of Hex-3; this means that all the mooring lines were not slack under the extreme condition. The mooring lines of Cyl-4 had the smallest change in tension among the four SFOWTs.
4.4 Wind-Wave Misalignment
The above analyses were based on the environmental conditions that the wave and wind propagate in the same direction. However, the wind and waves can be significantly misaligned. To study the effects of wind-wave misalignment on the platform motions, five cases of wind-wave misalignments were analyzed under extreme condition (Table 5). Fig.16 shows the statistics of platform motions in six DOFs. As depicted in the figure, the four SFOWTs exhibited the same trends; the mean values of the platform motions in six DOFs changed very slightly; this was because the mean values of the platform motions were mainly determined by the wind. As the wind-wave misalignment increased, which means the wave load component along thedirection decreases and that along thedirection increases, the maximum surge and the standard deviation of surge decreased by 61.8% and 71.4%, respectively, while the maximum sway and the standard deviation of sway increased by 215.4% and 220.1%, respectively. The standard deviations of yaw varied little as the wind-wave misalignment increased, which was because the yaw response was mainly dominated by the wind. The overall motion responses of Cyl-4 and Cub-4 were smaller than those of Cyl-3 and Hex-3 under the extreme condition. Fig.17 shows the statistics of mooring line tension under the extreme condition. In general, the maximum and minimum values of mooring line tensions varied greatly with the wave directions, while the mean and standard deviation varied relatively slightly with the wave direction. The maximum tensions of all the mooring lines did not exceed the mooring line breaking load, and the minimum tensions of all the mooring lines were greater than 0, which means all the mooring lines remained tensioned without slacking. The minimum tension was 87927N, which occurred in the mooring line 1# of Hex-3 when the wind-wave misalignment was 45˚.
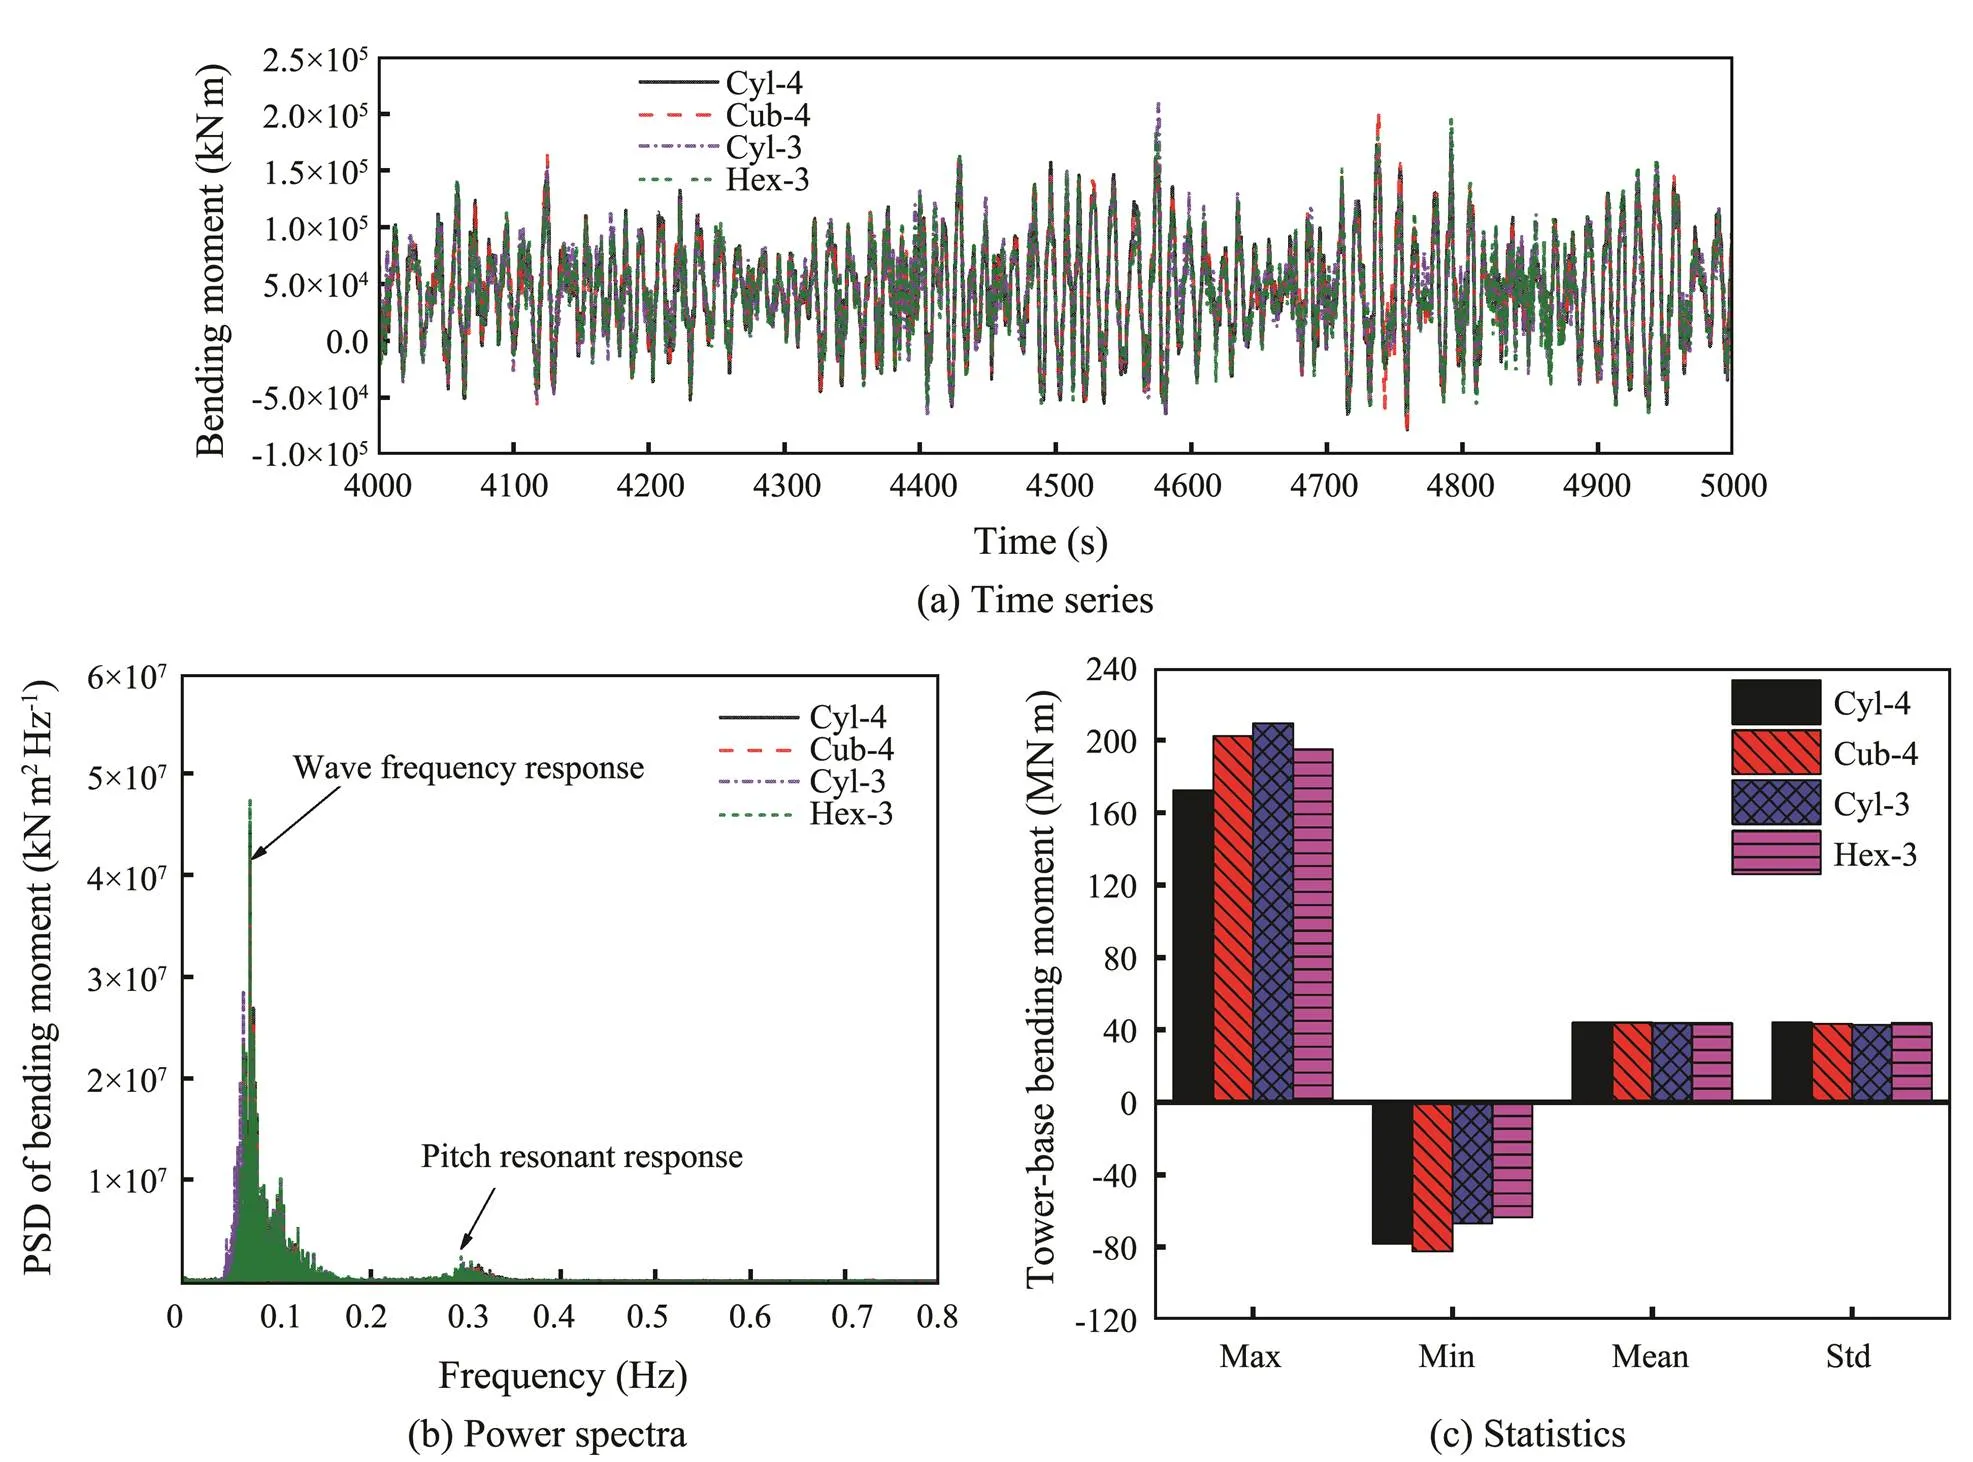
Fig.14 Time series, power spectra, and statistics of the bending moments at the tower base.

Fig.15 Normalized tension statistics of mooring lines under extreme condition.
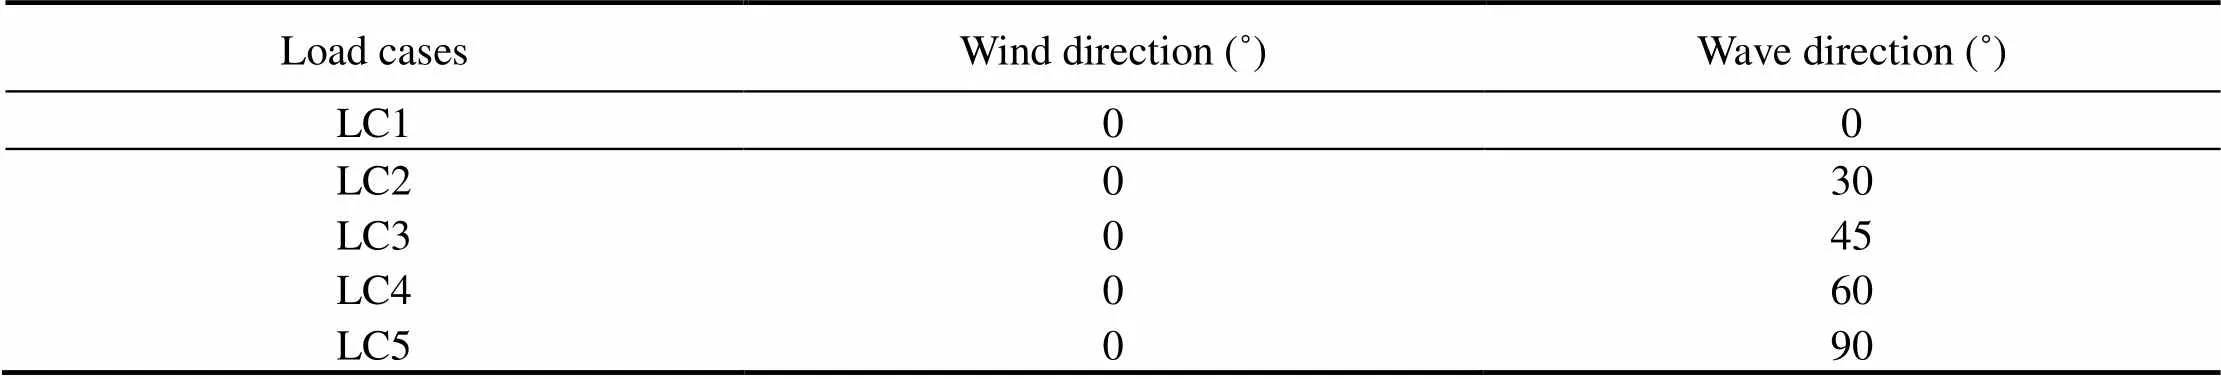
Table 5 Extreme condition with different wind and wave angles
4.5 Optimization Design of Mooring System
4.5.1 Pretension of mooring lines
The SFOWT is stabilized by the mooring lines. The mooring lines can become slack once the tension reduces to 0, which is not allowed even under extreme condition. The pretension on mooring lines has significant effects on the SFOWT performance. In this study, parametric design was carried out for the pretension of mooring lines. Each mooring line was designed to withstand pretensions of 2500, 3000, 3500, and 4000kN by adjusting the foundation ballast. In this section, only the different pretensions of Cub-4 under operational condition are shown for analysis.
The natural frequencies of the surge, heave, pitch, and yaw in different pretensions are shown in Fig.18. As expected, the natural frequency of Cub-4 in each DOF increased with the increase in pretension. Fig.19 presents the statistics of motion and mooring line tensions of the Cub-4 with different pretensions under operational condition. The pretension could significantly improve the SFO- WT motion response. When the pretension was increased from 2500 to 4000kN, the maximum values of the surge, pitch, and yaw decreased by 28.4%, 34.2%, and 30.3%, respectively, and the maximum amplitude of the heave (downward) decreased by 48.1%. Moreover, as the pretension increased, the variation rate of the decrease in motion response became smaller. When the pretension reached 3500kN, the increase in the pretension had little effect on the motion responses. The tensions of all mooring lines increased with the increase in pretension. The standard deviation of the mooring line tensions first increased with a slight growth rate as the pretension increased; however, when the pretension was increased from 3500kN to 4500kN, the standard deviation of the mooring line tensions increased sharply. As shown in Fig.19, all the mooring lines remained tensioned without slacking, and the maximum tension was 5420kN, which was less than the minimum breaking load.

Fig.16 Statistics of surge, sway, heave, roll, pitch, and yaw variation with wave direction under extreme condition.

Fig.17 Mooring line tension statistics of (a) Cyl-4, (b) Cub-4, (c) Cyl-3, and (d) Hex-3 variation with wave directions under extreme condition.
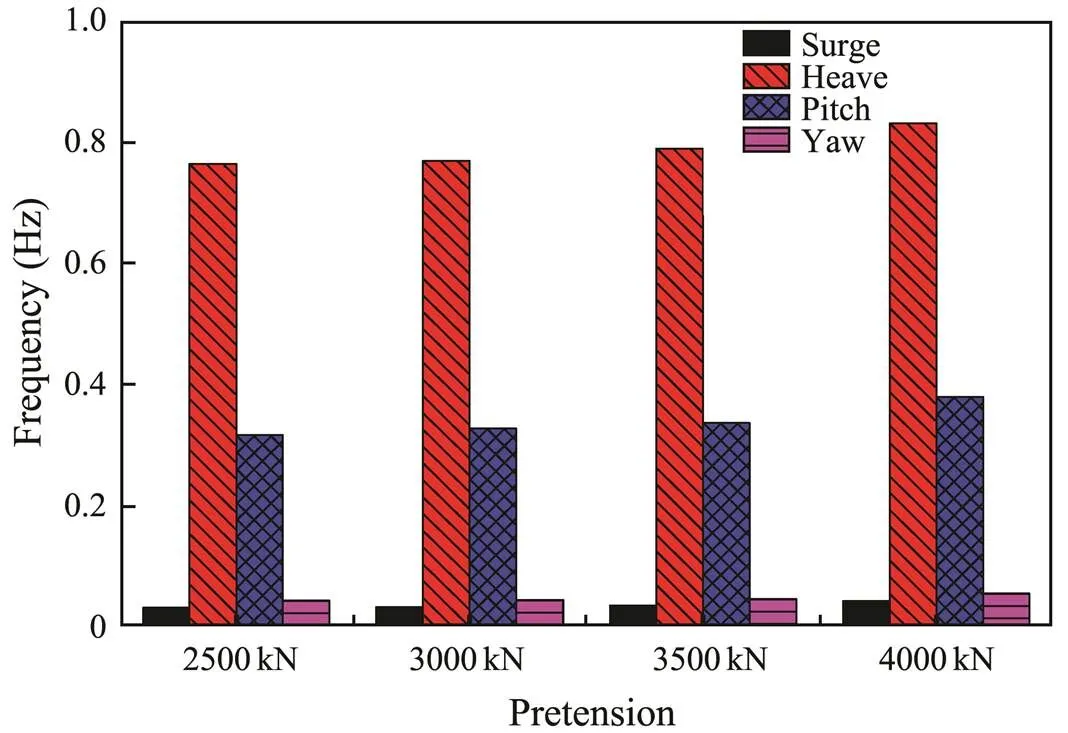
Fig.18 Natural frequencies of Cub-4 with different pretension conditions.
4.5.2 Mooring layout
Based on the Cub-4 SFOWT design described in previous sections and considering the mooring layout, the responses of Cub-4 with four different mooring layouts were analyzed under the operational and extreme conditions. The mooring layouts and main parameters are shown in Fig.20 and Table 6.
Figs.21 and 22 show the time series and statistics, respectively, of platform motion responses, fore-aft displacement of the tower-top, and mooring line1# tension of Cub-4 withdifferent mooring layouts. As shown in Figs.21(a) and 22(a), the maximum surges of mooring layout in forms L1, L2, L3, and L4 were 4.36, 4.32, 4.97, and 0.10m, respectively. The maximum surge and the standard deviation of the Cub-4 with L4 mooring, which included 4 vertical mooring lines and 12 diagonal mooring lines with an angle of 30˚to the vertical axis, were significantly smaller than those of the other three forms, due to the diagonal lines that can provide sufficient horizontal constraint. Similarly, the heave, pitch, and yaw of the Cub-4 with L4 mooring were significantly superior to those of other forms. Among the four mooring layouts, the Cub-4 with L4 mooring had the smallest maximum value and standard deviation of fore-aft displacement at the tower-top. The standard deviations of 1# mooring line tension for L1, L2, L3, and L4 were 204.5, 197.4, 300.1, and 210.9kN, respectively. Considering the above, the Cub-4 with L4 mooring had the best dynamic performance under the operational condition.
The Cub-4 with L4 mooring as an optimized design was selected for further extreme condition analysis. Fig.23 compares the motion responses of the Cub-4 before and after optimization, that is, with L1 mooring and L4 mooring, under extreme condition. The optimized mooring featured significantly reduced platform motion responses in surge, heave, and yaw. The maximum surge, maximum heave amplitude (downward), and maximum yaw of the Cub-4 with L4 mooring were 0.309m, −0.108m, and 0.118°, respectively, which were reduced by 97.7%, 91.5% and 98.7%, respectively, compared with the motion responses of the Cub-4 with L1 mooring. It can be seen that the diagonal lines could greatly limit the platform motion in the surge, heave, and yaw. However, the optimized mooring did not improve the platform motion response in pitch. Although the mean pitch was reduced by 39%, the maximum pitch was increased by 11.4% (to 0.45˚), which is still a very small pitch for the floating wind turbine.

Fig.19 Statistics of surge, heave, pitch, yaw, mooring line tensions, and standard deviations of mooring line tensions variation with pretension under operational condition.
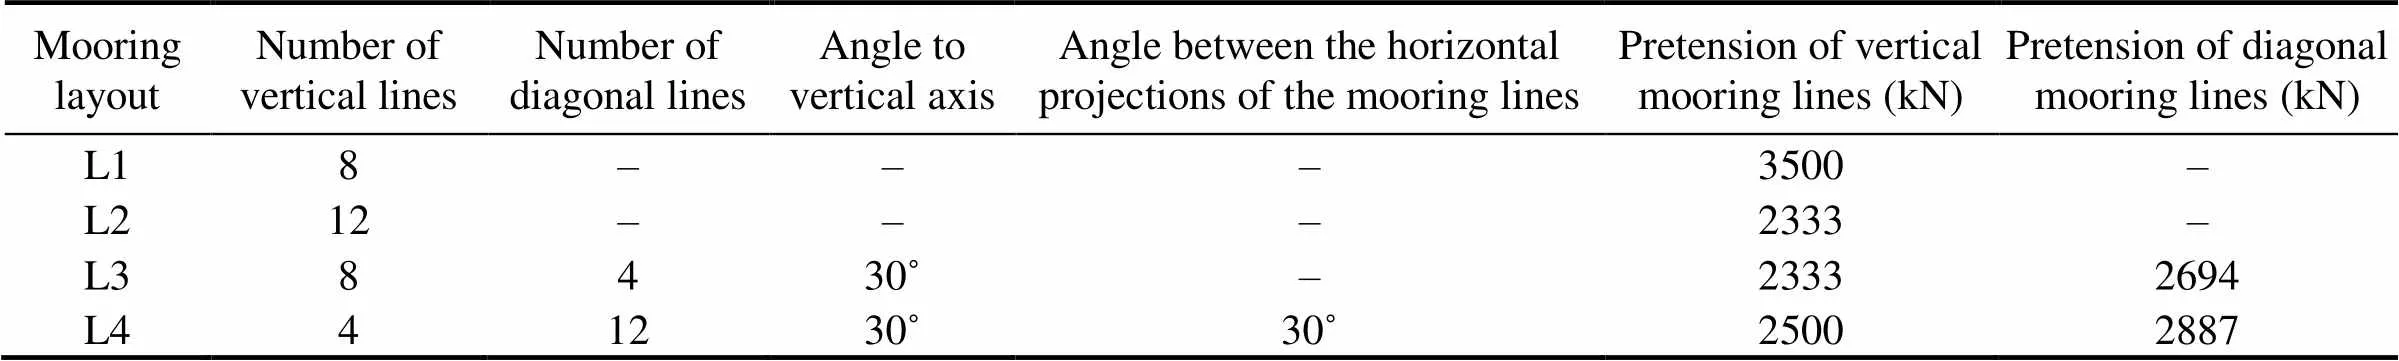
Table 6 Main parameters of different mooring layouts
Fig.20 Mooring line layouts.

Fig.21 Time series of platform motion in surge, heave, pitch, and yaw, tower-top fore-aft displacement, and tension of mooring line 1# with different mooring layouts under operational condition.
Fig.22 Statistics of surge, heave, pitch, yaw, tower-top fore-aft displacement, and tension of mooring line 1# with different mooring layouts under operational condition.
Fig.23 Statistics of surge, heave, pitch, and yaw under extreme condition.
Fig.24 shows the tension statistics of the upstream mooring lines 1#, 5#, 9#, and 13# and downstream mooring lines 3#, 7#, 11#, and 15# of the Cub-4 with L4 mooring under the extreme condition. All the mooring lines remained tensioned without slacking. The mean tensions in the upstream mooring lines were larger than the corresponding tensions in the downstream mooring lines. More- over, when the angle between the mooring line projection and the wind direction was smallest (such as upstream mooring line 5# and downstream mooring line 7#), the maximum tension, mean value, and standard deviation of the upstream or downstream mooring lines were largest.
Fig.24 Tension statistics of mooring lines under extreme condition.
5 Conclusions
In this paper, SFOWTs for intermediate water depths are proposed. Hydro-aero-servo-elastic time-domain analyses were performed to study the dynamic responses of the SFOWTs.
The natural frequencies of four SFOWTs with different configurations were determined by free decay tests in six DOFs. The natural frequencies of the four configurations in six DOFs were similar, and the natural frequencies in vertical plane motions (heave, pitch, and roll) were significantly higher than those in horizontal plane motions (surge, sway, and yaw).
The responses of the four SFOWTs were investigated under operational condition and extreme condition. All four SFOWTs exhibited good performance under both conditions. The effect of platform configurations on the power output was negligible under the operational condition. Under the extreme condition, among the four SFOWTs, the mean bending moments at the tower base were very close, while the maximum values differed by up to 21.5%, due to the different platform configurations. The effect of wind-wave misalignment was also further analyzed under the extreme condition. In general, the motion performances of the four-pontoon SFOWTs, Cyl-4, and Cub-4, were superior to those of the three-pontoon SFOWTs, Cyl-3, and Hex-3.
Optimization studies of the mooring system were carried out on Cub-4 with different mooring line pretensions and four mooring layouts. The natural frequency of the surge, heave, pitch, and yaw increased with the increase in pretension. An appropriate pretension can significantly improve the motion performance of SFOWTs. When the pretension was increased from 2500 to 4000kN, the maxi- mum values of the surge, pitch, and yaw decreased by 28.4%, 34.2%, and 30.3%, respectively, and the maximum amplitude of the heave (downward) decreased by 48.1%. As the pretension increased, the influence of pretension on decreasing the motion response decreased. Furthermore, the optimized Cub-4, which had four vertical lines and twelve diagonal lines with an angle of 30˚ to the vertical axis, could reduce the maximum motion responses of SFOWT in the surge, heave, and yaw by 97.7%, 91.5%, and 98.7%, respectively, under the extreme condition. Therefore, diagonal mooring lines can significantly improve the motion performance of SFOWTs. However, the optimized mooring did not improve the platform motion response in pitch. Although the mean pitch was reduced by 39%, the maximum pitch was increased by 11.4% (to 0.45˚); however, the pitch was still very small for the floating wind turbine. Mooring line slacking was not captured under the extreme condition, which means the SFOWT remained stable.
Acknowledgement
The authors gratefully acknowledge the financial support from the Tianjin Municipal Natural Science Foundation (No. 18JCYBJC22800).
Arapogianni, A., Genachte, A. B., Ochagavia, R. M., Vergara, J. P., Castell, D., Tsouroukdissian, A. R., Korbijn, J., Bolleman, N., Huera-Huarte, F. J., and Schuon, F., 2013. Deep water: The next step for offshore wind energy. Report of European Wind Energy Association, 50pp.
Bachynski, E. E., and Moan, T., 2012. Design considerations for tension leg platform wind turbines., 29 (1): 89-114.
Bae, Y. H., and Kim, M. H., 2013. Rotor-floater-tether coupled dynamics including second-order sum-frequency wave loads for a mono-column-TLP-type FOWT (floating offshore wind turbine)., 61: 109-122.
Benassai, G., Campanile, A., Piscopo, V., and Scamardella, A., 2014. Mooring control of semi-submersible structures for wind turbines., 70: 132-141.
Benassai, G., Campanile, A., Piscopo, V., and Scamardella, A., 2015. Optimization of mooring systems for floating offshore wind turbines., 57 (4): 1550021, DOI: 10.1142/80578563415500217.
Browning, J., Jonkman, J., Robertson, A., and Goupee, A., 2014. Calibration and validation of a spar-type floating offshore windturbine model using the FAST dynamic simulation tool., 555 (1): 012015.
Butterfield, S., Musial, W., Jonkman, J., Sclavounos, P., and Wayman, L., 2005. Engineering challenges for floating offshore wind turbines.. Copenhagen, Denmark, 10pp.
Campanile, A., Piscopo, V., and Scamardella, A., 2018. Mooring design and selection for floating offshore wind turbines on intermediate and deep water depths., 148: 349-360.
Choi, E. Y., Cho, J. R., Cho, Y. U., Jeong, W. B., Lee, S. B., Hong, S. P., and Chun, H. H., 2015. Numerical and experimental study on dynamic response of moored spar-type scale platform for floating offshore wind turbine., 54 (5): 909-922.
采用MIDAS GEN有限元软件,用梁单元模拟吸收塔加强筋,用板单元模拟吸收塔塔体及进口烟道进行建模。塔体沿高度方向均匀布置加强环筋,进出口烟道与塔体连接处均为大开口矩形孔,开孔部位较为薄弱,两侧用型钢进行加强;塔体和烟囱连接段为变截面,较为薄弱,用型钢进行加强。塔体底部受密度为1120kg/m3的石灰浆液静压力作用,石灰浆的液面高度为9.6m。
Coulling, A. J., Goupee, A. J., Robertson, A. N., Jonkman, J. M., andDagher,H.J.,2013.ValidationofaFASTsemi-submersible floating wind turbine numerical model with DeepCwind test data., 5 (2): 023116.
Det Norske Veritas, 2013..HØVIK, Norway.
Goldschmidt, M., and Muskulus, M., 2015. Coupled mooring systems for floating wind farms., 80: 255-262.
Goupee, A. J., Koo, B. J., Kimball, R. W., Lambrakos, K. F., and Dagher, H. J., 2014. Experimental comparison of three floating wind turbine concepts., 136 (2): 020906.
GWEC, 2019.. Global Wind Energy Council, 62pp.
Han, Y., Le, C., Ding, H., Cheng, Z., and Zhang, P., 2017. Stability and dynamic response analysis of a submerged tension leg platform for offshore wind turbines., 129: 68-82.
Jonkman, B. J., 2009a.. Na- tional Renewable Energy Laboratory (NREL), Golden, CO, 74pp, DOI: 10.2172/965520.
Jonkman, J., Butterfield, S., Musial, W., and Scott, G., 2009. De- finition of a 5-MW reference wind turbine for offshore system development. Technical report. National Renewable Energy Laboratory (NREL),Golden, CO, NREL/TP-500-38060.
Jonkman, J. M., 2009b. Dynamics of offshore floating wind turbines-model development and verification., 12 (5): 459-492.
Jonkman, J. M., and Matha, D., 2010. A quantitative comparison of the responses of three floating platforms.. Stockholm, Sweden, NREL/CP-500-46726.
Jonkman, J. M., and Matha, D., 2011. Dynamics of offshore float- ing wind turbines-analysis of three concepts., 14 (4): 557-569.
Koo, B. J., Goupee, A. J., Kimball, R. W., and Lambrakos, K. F., 2014. Model tests for a floating wind turbine on three different floaters., 136 (2): 020907.
Le, C., Li, Y., and Ding, H., 2019. Study on the coupled dynamic responses of a submerged floating wind turbine under different mooring conditions., 12 (3): 418-438.
Lefebvre, S., and Collu, M., 2012. Preliminary design of a floating support structure for a 5MW offshore wind turbine., 40: 15-26.
Liu, Y., Li, S., Yi, Q., and Chen, D., 2016. Developments in semi-submersible floating foundations supporting wind turbines: A comprehensive review., 60: 433-449.
Luan, C., 2018. Design and analysis for a steel braceless semi-submersible hull for supporting a 5-MW horizontal axis wind turbine. PhD thesis. Norwegian University of Science and Technology.
Luan, C., Gao, Z., and Moan, T., 2016. Design and analysis of a braceless steel 5-mw semi-submersible wind turbine.. Busan, OMAE2016-54848.
Masciola, M., Jonkman, J., and Robertson, A., 2013. Imple- mentation of a multisegmented, quasi-static cable model.. Anchorage, Alaska, NREL/CP-500-57812.
Matha, D., 2010. Model development and loads analysis of an offshore wind turbine on a tension leg platform with a com- parison to other floating turbine concepts: April 2009. Techni- cal report.National Renewable Energy Laboratory (NREL),Golden, CO, NREL/SR-500-45891.
Myhr, A., Maus, K. J., and Nygaard, T. A., 2011. Experimental and computational comparisons of the OC3-HYWIND and Tension-Leg-Buoy (TLB) floating wind turbine conceptual designs.. International Society of Offshore and Polar Engineers, Maui, Hawaii, ISOPE-I-11-560.
Nematbakhsh, A., Olinger, D. J., and Tryggvason, G., 2014. Non- linear simulation of a spar buoy floating wind turbine under extreme ocean conditions., 6 (3): 708-720.
Oh, K.-Y., Nam, W., Ryu, M. S., Kim, J.-Y., and Epureanu, B. I., 2018. A review of foundations of offshore wind energy con- vertors: Current status and future perspectives., 88: 16-36.
Ramachandran, G. K. V., Bredmose, H., Sorensen, J. N., and Jensen, J. J., 2014. Fully coupled three-dimensional dynamic response of a tension-leg platform floating wind turbine in waves and wind., 136 (2): 020901.
Roddier, D., Cermelli, C., Aubault, A., and Weinstein, A., 2010. WindFloat: A floating foundation for offshore wind turbines., 2 (3): 033104.
Sclavounos, P., Tracy, C., and Lee, S., 2009. Floating offshore wind turbines: Responses in a seastate pareto optimal designs and economic assessment.. Ame- rican Society of Mechanical Engineers Digital Collection, 31-41.
Shin, H., Dam, P. T., Jung, K. J., Song, J., Rim, C., and Chung, T., 2013. Model test of new floating offshore wind turbine platforms., 5 (2): 199-209.
Stewart, G., Lackner, M., Robertson, A., Jonkman, J., and Goupee, A., 2012. Calibration and validation of a FAST floating wind turbine model of the DeepCwind scaled tension-leg platform.. Rhodes, NREL/CP-5000-54822.
Utsunomiya, T., Matsukuma, H., Minoura, S., Ko, K., Hamamura, H., Kobayashi, O., Sato, I., Nomoto, Y., and Yasui, K., 2013. At sea experiment of a hybrid spar for floating offshore wind turbine using 1/10-scale model., 135 (3): 034503.
Zhang, L., Shi, W., Karimirad, M., Michailides, C., and Jiang, Z., 2020. Second-order hydrodynamic effects on the response of three semisubmersible floating offshore wind turbines., 207: 107371.
. E-mail: leconghuan@163.com
December 29, 2019;
April 2, 2020;
July 7, 2020
(Edited by Xie Jun)
猜你喜欢
杂志排行
Journal of Ocean University of China的其它文章
- Numerical Simulation and Risk Analysis of Coastal Inundation in Land Reclamation Areas: A Case Study of the Pearl River Estuary
- Variation of Yellow River Runoff and Its Influence on Salinity in Laizhou Bay
- Cold Water in the Lee of the Batanes Islands in the Luzon Strait
- Inversion of Oceanic Parameters Represented by CTD Utilizing Seismic Multi-Attributes Based on Convolutional Neural Network
- Trace-Norm Regularized Multi-Task Learning for Sea State Bias Estimation
- 11000-Year Record of Trace Metals in Sediments off the Southern Shandong Peninsula in the South Yellow Sea