基于线性生长假设的作物积温模型稳定性比较*
2020-11-18郭建平马雅丽张丽敏王婧瑄李伟伟
栾 青,郭建平,马雅丽,张丽敏,王婧瑄,李伟伟
基于线性生长假设的作物积温模型稳定性比较*
栾 青1,2,郭建平2,3**,马雅丽1,张丽敏2,4,王婧瑄5,李伟伟6
(1.山西省气候中心,太原 030006;2.中国气象科学研究院,北京 100081;3.南京信息工程大学气象灾害预警预报与评估协同创新中心,南京 210044;4.辽宁省葫芦岛市气象局,葫芦岛 125000;5.内蒙古自治区气象服务中心,呼和浩特 010051;6.山西省侯马市气象局,侯马 043000)
利用山西省2个冬小麦观测站、3个春玉米观测站和3个夏玉米观测站长时间序列的作物生育期观测资料和地面气象观测资料,基于4种作物生长发育速率线性假设,建立了作物不同生育阶段的活动积温(Aa)和4种有效积温模型,并对各积温模型的稳定性进行统计分析与检验。结果表明:以变异系数为指标检验各模型稳定性时,活动积温模型最稳定,考虑作物三基点温度的有效积温模型(Ae4)次之,仅考虑作物下限温度的有效积温模型(Ae1)及考虑作物上、下限温度的有效积温模型(Ae2和Ae3)最不稳定。以生育期模拟偏差和生育期模拟准确率为指标检验各模型稳定性时,Aa模型对作物生育期的模拟效果最好,稳定性最高;4种有效积温模型中,Ae1、Ae2和Ae3模型模拟效果无显著差异,准确率和稳定性高于Ae4模型。各积温模型在春玉米和夏玉米出苗−抽雄期和抽雄−成熟期的稳定性表现一致,出苗−抽雄期各积温模型的稳定性高于抽雄−成熟期;冬小麦在出苗−抽穗期和抽穗−成熟期各积温模型的稳定性表现因地区不同而有所差异。因此,在实际应用中,还需根据作物种植区域、品种类型以及生育期选取合适的基点温度,综合分析多种积温模型稳定性,选取稳定性更高的积温模型。
积温;线性假设;稳定性;变异系数;模拟准确率
1735年,Reaumur指出每一种作物品种从种植到成熟都要求一定量的日均温度的积累[1],提出了积温学说的雏形[2]并创立了积温理论。1837年,Boussingault提出了“度·日”(degree-day,℃·d)的概念[3],定义为期间天数与日平均气温的乘积。1923年,Houghton等提出了有效温度的概念[1]。之后,积温被广泛地应用于作物生育期预测[4]、产量预报[5]以及病虫害预报[6]等方面,并成为国内外作物模型中非常重要的因子之一。积温在中国农业气象领域的研究和应用始于20世纪50年代,随着大量研究工作的不断深入,积温的概念和计算方法也得到不断完善[7]。积温的计算大都以作物生长发育速率对温度反映的生长假设为前提,国际上常用的作物生长假设分线性假设和优化假设(非线性假设)[8-9]。积温模型有仅考虑下限基点温度的活动积温和有效积温[10],考虑上下限两个基点温度的有效积温,考虑3基点、4基点温度的有效积温[9,11]等模型。比较经典的积温模型有李森科线性积温模型[12]、沈国权非线性积温模式[12]、高亮之非线性积温模型[13-14]、殷新佑非线性积温模型[15-16]等。
积温虽然在科研和业务工作中得到了广泛的应用,但越来越多的研究表明,积温模型的稳定性因作物品种、种植区域、生育期长短等不同而存在差异[17]。吴玉洁等[18]分析了3种作物线性生长假设下的活动积温和有效积温的稳定性,表明活动积温比有效积温更稳定;肖静等[19]基于3种不同日均温计算了作物阶段有效积温和活动积温,分析证实活动积温较为稳定;姜会飞等[20]研究表明,以变异系数为指标时活动积温相对有效积温更稳定,而以标准偏差为指标时有效积温绝对稳定度优于活动积温;叶彩华等[21]基于积温在北京樱花盛花始期模拟中的应用研究表明,活动积温和有效积温稳定性强弱关系随下限温度的不同而不同。还有学者[17,22-23]认为,有效积温比活动积温更稳定。可见,对于不同积温模型的稳定性不同学者的观点不同,且各积温模型的稳定性是否随作物品种、生育期等的不同而有所差异,目前研究还相对较少。
本研究选取山西省冬小麦、春玉米和夏玉米共8个农业气象观测站长时间序列的作物生育期观测资料及地面气象观测资料,基于4种作物生长发育速率对温度响应的线性假设,以变异系数、生育期模拟偏差等为检验指标[18-19,24-25],统计计算分析5种不同积温模型的稳定性,旨在探索各积温模型针对不同作物、不同生长发育阶段是否具有一致的稳定性,为其在农业气象业务及科研中更好地应用提供依据。
1 材料与方法
1.1 资料及其来源
以冬小麦为喜凉作物的代表,春玉米和夏玉米为喜温作物的代表,选取山西省太谷区、盐湖区为冬小麦代表站,灵丘县、忻府区和昔阳县为春玉米代表站,尧都区、盐湖区和芮城县为夏玉米代表站,各站地理位置、作物物候观测年份等信息见表1。历年作物物候期观测资料包括冬小麦拔节期、抽穗期和成熟期,春玉米和夏玉米出苗期、抽雄期和成熟期的观测日期,均来源于各农业气象观测站。同期气象资料为各站历年逐日平均气温、最高气温和最低气温,来源于山西省气象信息中心。
1.2 积温模型及计算方法
1.2.1 日平均气温
目前应用较多的日平均气温计算方法主要有两种,一是采用一日内4个固定时次(2:00、8:00、14:00和20:00)气温观测值的平均,该方法也是当前气象部门发布的日平均气温的计算方法;二是采用一日内最高气温和最低气温的平均值。肖静等[19]研究结果显示,基于方法二计算得到的积温较稳定,对山西冬小麦生育期的模拟效果较好。因此,本文日平均气温的计算方法选择方法二。

表1 三种主要作物代表站地理信息及物候期观测资料年份
1.2.2 线性生长假设下的作物积温

目前常用的4种作物生长发育速率对温度反应的线性假设如图1所示[8]。
图1a仅考虑作物生物学下限温度(Tb),表示当日平均气温(Ti)高于Tb时,作物生长发育速率随温度的升高呈线性增长趋势。为活动积温(Aa)的表现形式,也是有效积温的第一种表现形式,用Ae1表示。此时日活动温度(ai)和日有效温度(ei)的计算式分别为


注:Tb为下限温度,T0为最适温度,Tu为上限温度。下同。
Note: Tbis lower limit temperature, T0is optimum temperature, Tuis upper limit temperature. The same as below.
式(3)−式(7)中,ai为日活动温度(℃),ei为日有效温度(℃),Tb、T0、Tu分别为下限温度、最适温度和上限温度(℃),Ti为日平均温度(℃)。
1.2.3 主要作物的三基点温度
综合文献资料记载及相关学者科研成果[26-30],确定冬小麦、春玉米和夏玉米的三基点温度如表2。
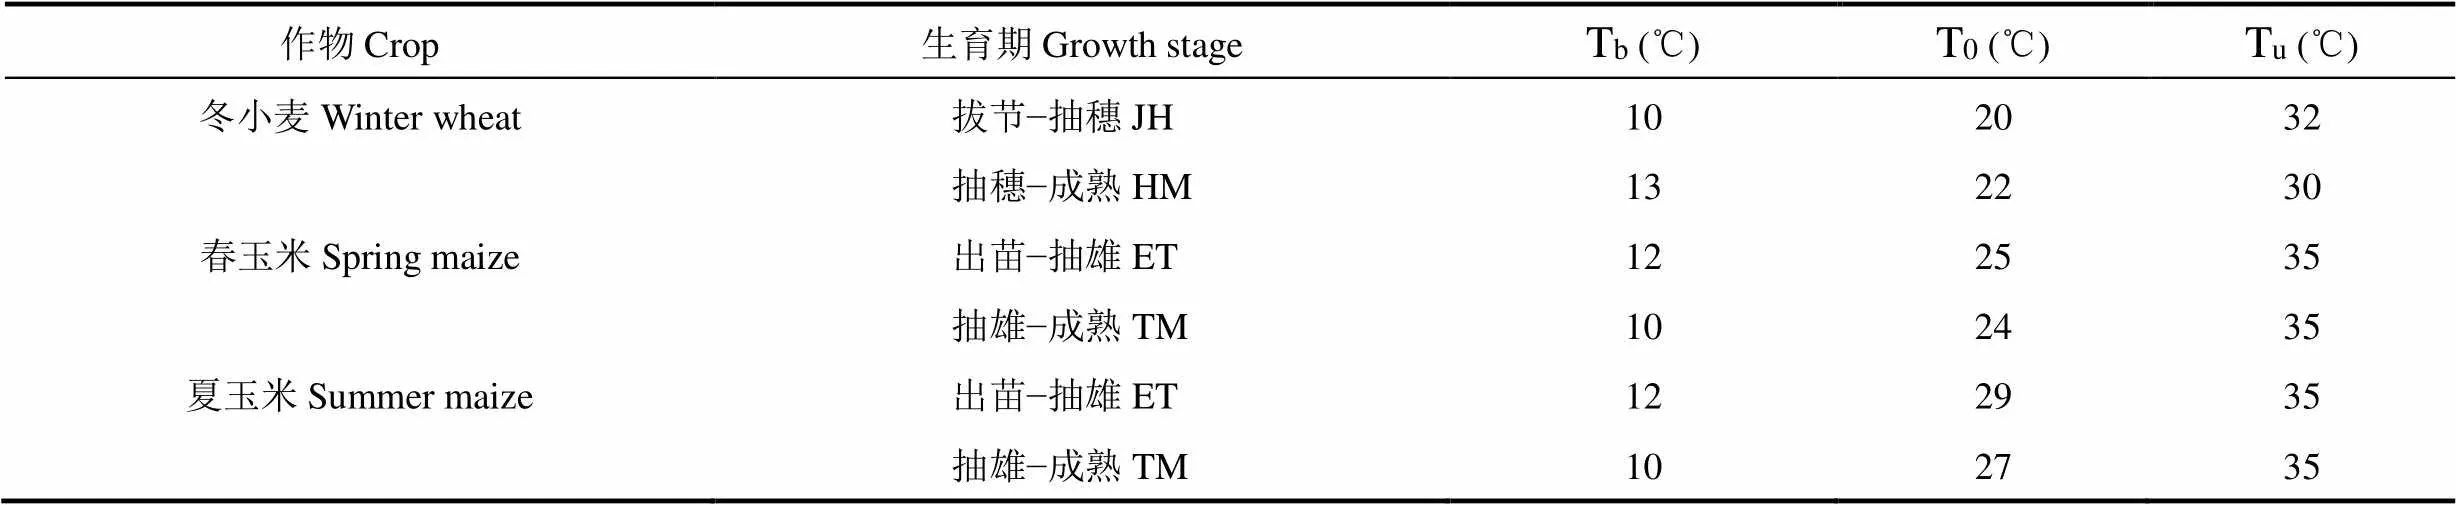
表2 代表作物各主要生育期的三基点温度(日平均温度)
注:JH为冬小麦拔节至抽穗期,HM为冬小麦抽穗至成熟期;ET为春玉米或夏玉米出苗至抽雄期,TM为春玉米或夏玉米抽雄至成熟期。下同。
Note: JH is the jointing to heading stage of winter wheat. HM is the heading to maturity stage of winter wheat. ET is the emergence to tasseling stage of spring maize or summer maize. TM is the tasseling to maturity stage of spring maize or summer maize. The same as below.
1.2.4 稳定性检验指标
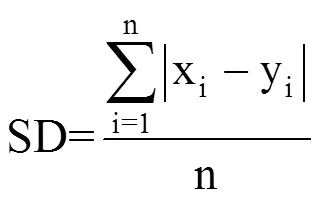
(1)变异系数(Coefficient of variation,CV)。CV是数据序列的标准差与其平均值的比,表示数据序列的相对离散程度,无量纲,可以客观地比较数据序列的稳定程度。根据各地代表作物生育期观测资料以及逐日平均气温,计算各积温模型的数据序列,利用CV检测各地代表作物主要生育期各积温模型数据序列的稳定程度。即

(2)生育期模拟偏差(Simulation deviation of growth period,SD)。SD定义为多年作物生育期的模拟值与实测值的平均偏差。其值越大表明模型稳定性越差,反之模型越稳定。假定随品种、气候等因素变化,作物生长所需积温为线性增加趋势,首先建立各地代表作物主要生育期各积温模型的数据序列随年份变化的线性方程,计算历年作物达到某一生育期所需积温,根据逐日平均气温,累加推算作物达到某生育期的时间(xi)。与实际作物达到该生育期的时间(yi)进行对比,计算SD值。即
(3)生育期模拟准确率(Simulation accuracy of growth period,SA)。SA为历年作物生育期模拟结果中与实际基本相符(生育期模拟值与实测值的偏差天数在±3d之内)的年数占相应生育期模拟年数的百分率(%),即

式中,n0为作物生育期模拟结果与实际基本相符(生育期模拟值与实测值的偏差在±3d之内)的年数,n为相应的作物生育期模拟年数。
2 结果与分析
2.1 代表作物生育期各积温模型的变异系数分析
2.1.1 冬小麦
表3为太谷区和盐湖区冬小麦拔节−抽雄和抽雄−成熟期5种积温模型的变异系数。由表可见,两个地区冬小麦不同生育阶段各积温模型的变异系数均表现为活动积温模型(Aa,假设一)的最小,同时考虑作物的三基点温度的有效积温模型(Ae4,假设四)次之,仅考虑作物下限温度或者上、下限温度的有效积温模型(Ae1,假设一;Ae2,假设二;Ae3,假设三)变异系数较大,说明活动积温模型较有效积温模型相对更稳定。Ae1、Ae2和Ae3有效积温模型中,Ae3模型的变异系数小于Ae1和Ae2模型。Ae1和Ae2模型的变异系数在太谷和盐湖两地冬小麦拔节−抽穗期均相等,抽穗−成熟期有所差别,说明两地冬小麦拔节−抽穗期多年日平均气温均低于其阶段上限温度,而抽穗−成熟期有部分日期日平均气温超过其上限温度。冬小麦两个生长发育阶段各积温模型的变异系数均表现为拔节−抽穗期大于抽穗−成熟期,说明以变异系数为指标检验的冬小麦抽穗−成熟期各积温模型的稳定性高于拔节−抽穗期。

表3 基于4种线性假设的冬小麦生育期5种积温模型的变异系数
注:Aa为作物生长发育速率随温度变化线性假设下的活动积温模型,Ae1、Ae2、Ae3和Ae4分别作物生长发育速率随温度变化线性假设下的4种有效积温模型。Aa和Ae1模型的线性假设为当日平均气温(T)高于作物下限温度(Tb)时,作物生长发育速率随温度的升高呈线性增长趋势。Ae2模型的线性假设为当T介于Tb与上限温度(Tu)之间时,作物生长发育速率随温度的升高呈线性增长趋势,并达到最大值(1.0);当T超过Tu时,作物生长发育速率随温度升高保持恒定不变。Ae3模型的线性假设为当T介于Tb与Tu之间时,作物生长发育速率随温度的升高呈线性增长趋势,并达到最大值(1.0);当T超过Tu时,作物生长发育停滞。Ae4模型的线性假设为当T介于Tb与最适温度(T0)之间时,作物生长发育速率随温度的升高呈线性增长趋势,并达到最大值(1.0);当T介于T0与Tu之间时,作物生长发育速率随温度升高呈线性下降趋势,并降至最小值(0.0);当T超过Tu时,作物生长发育停滞。下同。
Note: Aa is the active integrated temperature model based on the linear hypothesis about response of growth and development rate to temperature. Ae1, Ae2, Ae3 and Ae4 are the four effective integrated temperature models based on the four linear hypotheses about response of growth and development rate to temperature.The linear hypothesis of Aa and Ae1 models is that the growth and development rate of crops (GDR) increases linearly with the increase of temperature when the average daily temperature (T) is higher than the lower limit temperature (Tb) of crops. The hypothesis of Ae2 model is that when the T is between the Tband the upper limit temperature (Tu) of crops, the GDR increases linearly with the increase of temperature and reaches the maximum (1.0); when the T exceeds Tu, the GDR remains constant with the increase of temperature. The hypothesis of Ae3 model is that when the T is between Tband Tu, the GDR increases linearly with the increase of temperature and reaches the maximum (1.0); when the T exceeds Tu, the GDR stagnate. The hypothesis of Ae4 model is that when the T is between Tband the optimum temperature (T0), the GDR increases linearly with the increase of temperature and reaches the maximum (1.0); when the T is between T0and Tu, the GDR decreases linearly with the increase of temperature and decreases to 0.0; when the T exceeds Tu, the GDR stagnate. The same as below.
2.1.2 春玉米
灵丘县、忻府区和昔阳县春玉米出苗−抽雄及抽雄−成熟两个生长发育阶段各积温模型的变异系数见表4。由表可见,各地春玉米不同生育阶段的变异系数同样表现为活动积温模型(Aa)的最小,同时考虑作物三基点温度的有效积温模型(Ae4)次之,仅考虑作物生物学下限温度或上、下限温度的有效积温模型(Ae1、Ae2和Ae3)的最大,即活动积温模型的变异系数小于有效积温模型,说明活动积温模型更稳定。Ae1、Ae2和Ae3模型的变异系数各站基本相等,对比原始数据分析发现,仅昔阳县2010年7月29日、30日和31日日平均气温超过春玉米该阶段生物学上限温度,其余时间日平均气温均低于其阶段生物学上限温度,由此可见,3个地区春玉米出苗−成熟期常年日均气温大部分时间均适宜其生长发育,不受高温影响。对比各积温模型在春玉米两个生长发育阶段的变异系数可见,灵丘县和昔阳县5种积温模型出苗−抽雄期的变异系数均小于抽雄−成熟期,忻府区出苗−抽雄期的变异系数稍大于抽雄−成熟期,故可基本认为,各积温模型在春玉米出苗−抽雄期的稳定性高于抽雄−成熟期。
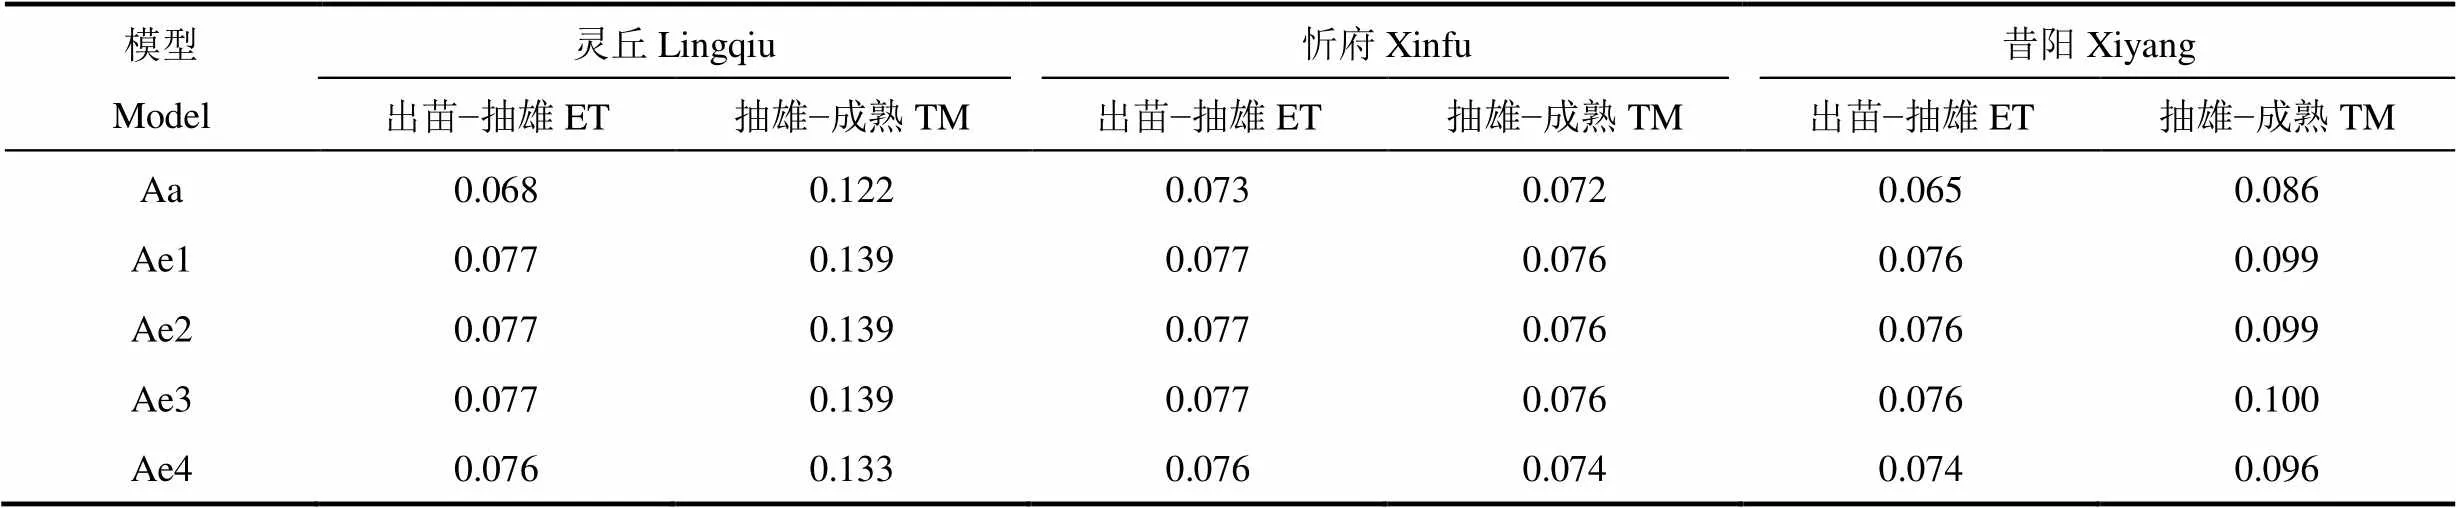
表4 基于4种线性假设的春玉米生育期5种积温模型的变异系数
2.1.3 夏玉米
由表5可见,夏玉米不同生育阶段各积温模型的变异系数与冬小麦和春玉米表现一致,即活动积温模型(Aa)的最小,有效积温模Ae4的次之,Ae1、Ae2和Ae3模型的基本相等且最大,同样表明活动积温模型较有效积温模型更稳定。Ae1、Ae2和Ae3模型的变异系数在各站代表作物不同生育期均相等,说明历年各站夏玉米出苗−成熟期基本未出现日平均气温高于其阶段上限温度的情况,仅盐湖区2017年夏玉米出苗−抽雄期有2d日平均气温超过上限温度,两地多年来夏玉米出苗后的生长发育基本不受高温抑制。夏玉米两个不同生育阶段各积温模型的变异系数均表现为抽雄−成熟期大于出苗−抽雄期,与春玉米一致,夏玉米出苗−抽雄期各积温模型的稳定性亦高于抽雄−成熟期。

表5 基于4种线性假设的夏玉米生育期5种积温模型的变异系数
2.2 各积温模型模拟代表作物主要生育期的偏差分析
2.2.1 生育期模拟
受外界诸多环境条件的影响,作物完成某一生长发育阶段所需积温并不是一个常数,即积温的不稳定性。有研究表明[31],作物生育期积温与平均温度呈线性或二次曲线等相关关系,本研究也发现,研究区各代表作物主要生育期5种积温模型的数据序列均呈现随时间的线性增加趋势。因此,以春玉米抽雄期模拟为例,构建代表站春玉米出苗−抽雄期5种积温模型数据序列随年份的线性方程,计算历年春玉米完成出苗−抽雄期所需积温;并以春玉米出苗期实际观测日为起点,根据式(3)−式(7)计算日活动温度和4种日有效温度,逐日累加,以首次达到通过线性方程计算得到的春玉米出苗−抽雄期所需积温的日期为抽雄期的模拟值。其余的作物生育期模拟方法相同。
2.2.2 模拟偏差
基于各站代表作物历年主要生育期的模拟值和实测值,根据式(9)计算生育期模拟偏差(SD),结果见表6。由表可见,活动积温模型(Aa)对不同作物、不同生育期的模拟偏差大部分小于4种有效积温模型(Ae1、Ae2、Ae3和Ae4),表明活动积温模型较有效积温模型对作物生育期的模拟更加准确,稳定性更高。4种有效积温模型对各站代表作物主要生育期的模拟偏差表现为Ae4模型最大,Ae3模型次之,Ae1和Ae2模型基本相等,也相对最小,原因在于Ae4模型考虑了作物三基点温度,当日平均温度超过作物阶段最适温度时,日有效温度降低,计算得到的Ae4模型数值必然小于Ae1、Ae2和Ae3模型,使作物生育期的模拟值较实际日期有所推迟,因此,Ae4模型的模拟偏差相对Ae1、Ae2和Ae3模型稍偏大。冬小麦两个生育期各积温模型的模拟偏差介于1.7~2.9d,春玉米介于2.9~6.7d,夏玉米介于1.3~6.1d,冬小麦生育期的模拟偏差相对较小,春玉米生育期的模拟偏差较大。各积温模型对春玉米和夏玉米抽雄期的模拟偏差小于成熟期,与通过变异系数(CV)分析的生育期积温稳定性相同,即针对春玉米和夏玉米来说,出苗−抽雄期各积温模型的稳定性高于抽雄−成熟期。冬小麦两个代表站不同生育期各积温模型的模拟偏差表现不同,太谷区抽雄期的模拟偏差大于成熟期,与CV分析的生育阶段积温稳定性相同;而盐湖区抽穗期的模拟偏差小于成熟期,与CV分析结果有所不同。此外,从生育期模拟偏差数值来看,部分生育期的模拟偏差值甚至超过5d,说明各积温模型均存在一定的不稳定性,尤其是有效积温稳定性相对更不稳定。

表6 各地基于5种积温模型的代表作物主要生育期的平均模拟偏差(SD, d)
2.2.3 模拟准确率
假设作物生育期模拟值与实测值相差在±3d以内的模拟为基本准确,统计各站历年代表作物生育期的模拟值与实测值相差在±3d以内的年数,计算与相应生育期模拟总年数的比值,得到各站代表作物主要生育期各积温模型的模拟准确率(表7)。由表可见,活动积温模型(Aa)对生育期模拟的准确率大部分高于4种有效积温模型,说明活动积温模型比有效积温模型对作物生育期的模拟效果更好,稳定性更高。从4种有效积温模型对作物生育期模拟的准确率来看,大部分也表现为Ae4模型最低,Ae1、Ae2和Ae3模型相等。分作物来看,各积温模型对冬小麦抽穗期模拟的准确率介于61.5%~89.7%,成熟期模拟准确率介于59.0%~92.3%,基本都在60%以上,表明利用5种积温模型均可较为准确地模拟冬小麦的抽穗期和成熟期;春玉米抽雄期各积温模型的模拟准确率介于53.8%~71.8%,成熟期模拟准确率介于26.5%~48.7%,整体均较低;夏玉米抽雄期各积温模型的模拟准确率介于50%~90%,大部分在60%以上,而成熟期模拟准确率仅28.6%~60%。可见,各积温模型对春玉米和夏玉米生育期的模拟准确率均表现为成熟期低于抽雄期,与通过变异系数和作物生育期模拟偏差为指标检验的阶段积温稳定性相同,即出苗−抽雄期各积温模型的稳定性高于抽雄−成熟期。太谷区各积温模型对冬小麦生育期的模拟准确率表现为抽穗期低于成熟期,而盐湖区表现为抽穗期略高于成熟期。
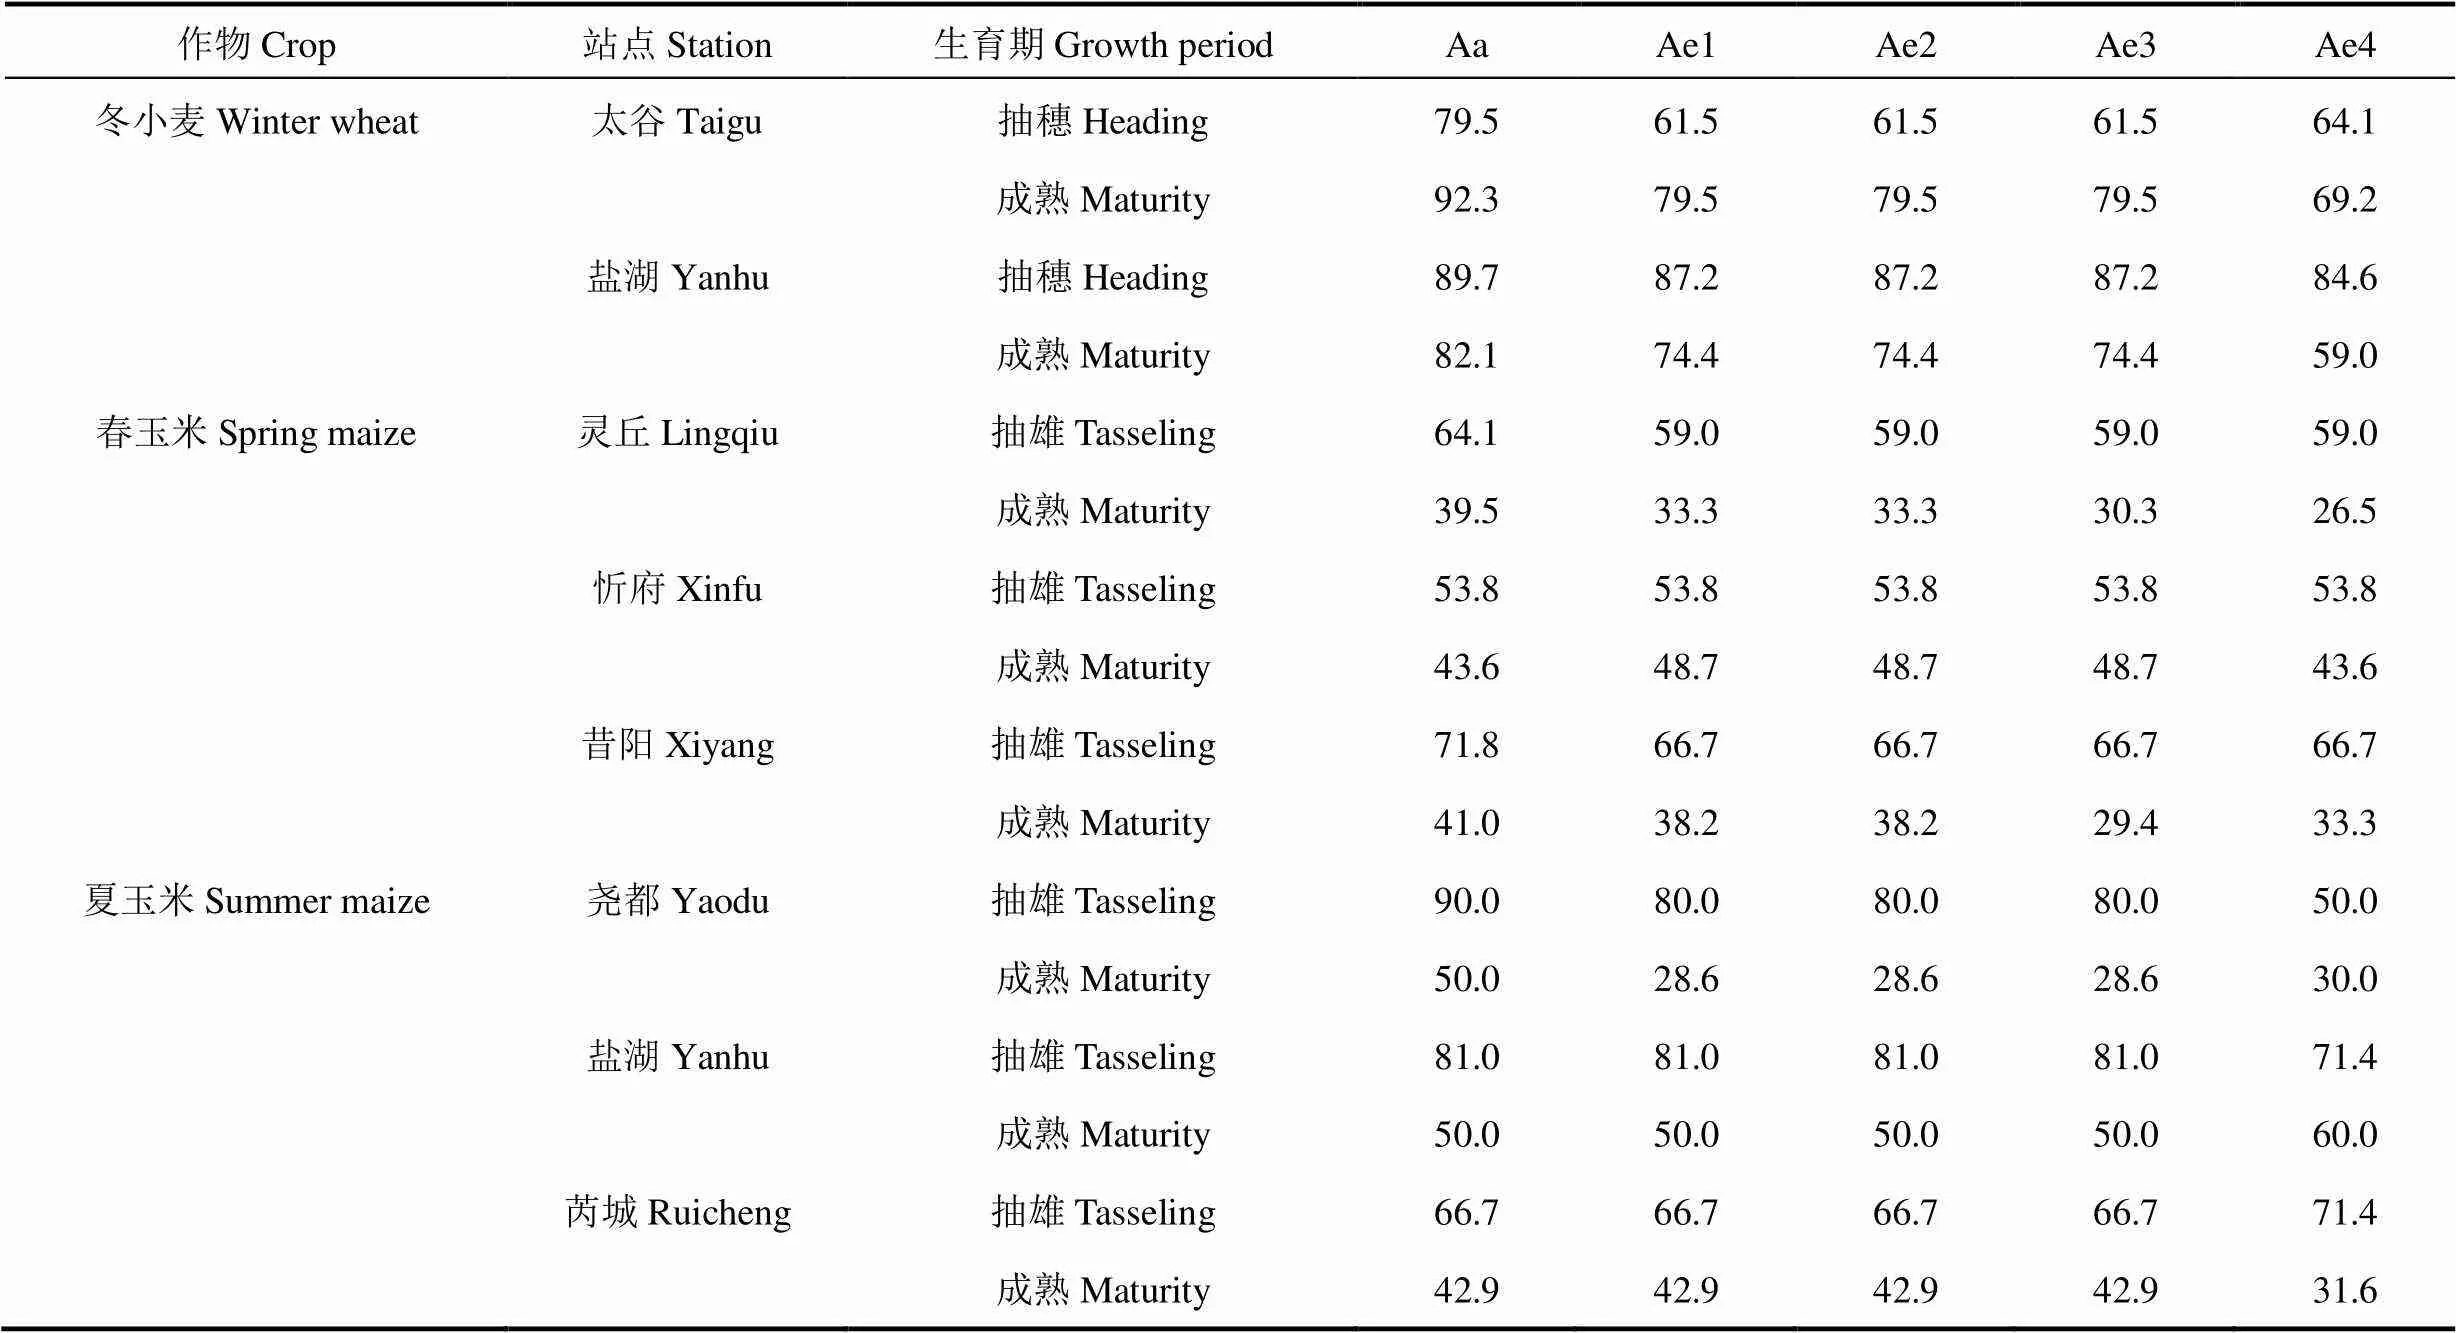
表7 各地基于5种积温模型的代表作物主要生育期模拟准确率(%)
注:准确率为模拟偏差≤3d的年数占相应生育期模拟总年数的百分比。
Note: Simulation accuracy is the percentage of years with a simulation deviation of the growth period less than three days in the total simulation years.
3 结论与讨论
3.1 结论
(1)以变异系数为积温模型稳定性检验指标时,活动积温模型较本研究基于4种作物生长发育速率线性假设下的有效积温相对稳定,同时考虑作物三基点温度的有效积温模型稳定性次之,仅考虑1~2个作物基点温度的有效积温模型较不稳定。以作物生育期模拟偏差和模拟准确率为积温模型稳定性检验指标时,同样证实活动积温模型较有效积温模型对作物生育期的模拟准确率更准确,稳定性更高;但同时考虑作物三基点温度的有效积温模型对作物生育期的模拟准确率(即稳定性)相比仅考虑1~2个作物基点温度的有效积温模型并未得到改善。
(2)各积温模型对冬小麦抽穗期和成熟期的模拟准确率均较高,太谷区冬小麦抽穗期模拟准确率低于成熟期,而盐湖区冬小麦抽穗期模拟准确率高于成熟期,即冬小麦拔节−抽穗期和抽穗−成熟期各积温模型的稳定性因地区不同而有所差异。春玉米和夏玉米抽雄期和成熟期模拟的平均准确率不及冬小麦,生育期模拟准确率均表现为抽雄期高于成熟期,说明针对春玉米和夏玉米出苗−抽雄期各积温模型的稳定性高于抽雄−成熟期。
3.2 讨论
本研究选择3种代表作物、8个站点长时间序列的观测资料,考虑了4种作物生长发育速率线性假设,基于多指标分析验证结果均表明活动积温较有效积温稳定性相对更高,这一结论与吴玉洁等[18-20]研究结果一致,而与有效积温比活动积温更稳定的说法[17,22-23]相矛盾。有效积温比活动积温稳定的研究结论大都基于20世纪70年代的水稻种植观测试验数据分析得出,但其中的不足,一是试验年限仅1a,其数据代表性不足,二是分期播种试验的某些播期水稻的生长发育并不处于最适气候条件下,因此,有效积温比活动积温稳定的结论事实依据并不强。还有些主观说法认为[23],考虑到有效积温扣除了生物学下限温度的无效积温,能够更准确反映作物对热量的需求,然而事实上温度有其日变化特征,当日平均气温低于下限温度时,白天可能仍有时段气温高于下限温度,该时段作物生长发育仍然进行,而日有效温度的计算值为零,不能反映其生长发育。
春玉米和夏玉米不同生育阶段各积温模型的稳定性均表现为出苗−抽雄期高于抽雄−成熟期。有研究表明[32],玉米营养生长阶段,温度效率最高,而抽雄后的生殖生长阶段其温度效率下降,这可以解释本研究仅以积温为单一因子的玉米生育期模拟中抽雄期模拟效果好于成熟期的结果。冬小麦生育期模拟效果总体优于春玉米和夏玉米,说明温度对冬小麦生长发育起主要作用;变异系数检验结果显示两个冬小麦代表站各积温模型在拔节−抽穗期的稳定性低于抽穗−成熟期,但生育期模拟准确率有所不同。由此可见,变异系数与生育期模拟准确率反应的积温模型稳定性可能存在不一致的情况。
由于本研究所选时间序列较长,20世纪80−90年代温度无逐时记录,所以日平均气温采用日最高气温和最低气温平均的计算方法[33-35],但目前日平均气温的计算方法已发展到逐时气温的平均,不同计算方法下的积温模型的稳定性还需进一步验证。本研究未考虑作物品种的变化,且生育期划分相对较粗,基点温度参照广大学者研究成果而定,因此,其分析结论在其它地区以及作物较细的生长发育期阶段是否具有一致性也还需进一步分析和验证。积温的计算均以作物生长发育速率对温度反映的生长假设[9]为前提,生长假设分线性生长假设和非线性生长假设,本研究基于目前应用最广的4种线性生长假设分别统计分析了5种积温模型的稳定性,但普遍认为作物的生长发育速率随温度呈非线性变化趋势[7,9,12,15]。沈国权[36]研究结果显示,当量积温稳定性更高,而本文Ae4模型对作物生育期的模拟准确率不高、稳定性较差的原因可能来源于基点温度的选取以及线性假设的不确定性。因此,确切的作物三基点温度应通过试验方法获得,业务应用中,需综合考虑多种线性和非线性积温模型,对比不同积温模型在本地特定作物下的稳定性,选取稳定性较高的积温模型。
自积温理论被提出以来,积温已在农业气象等工作中得到广泛应用。积温理论的假设是在光照、水分等环境条件适宜的情况下,作物生长主要受温度影响,所以作物完成某一生长发育阶段所需要的积温是一定的,然而在自然条件下作物生长发育还受品种类型、生理控制、田间管理等因素的影响,积温往往不是一个常数。本研究虽通过相关的数据分析验证得出活动积温较有效积温相对稳定的结论,但积温受多种因素的综合影响,具有一定的不稳定性[20]。因此,进一步研究积温稳定性、改进积温模型仍是目前及今后努力的方向[4,7,37]。
[1] 冯秀藻,陶炳炎.农业气象学原理[M].北京:气象出版社,1991:94.
Feng X Z,Tao B Y.Principles of agricultural meteorology[M]. Beijing:China Meteorological Press,1991:94.(in Chinese)
[2] 李有,董中强,宋贤明.积温学说的不稳定性和修正式的评价[J].华北农学报,1993,8(S1):93-96.
Li Y,Dong Z Q,Song X M.The destability of the accumulated temperature theory and the evaluation for its modified models[J].Acta Agriculturae Boreali-sinica,1993, 8(S1):93-96.( in Chinese)
[3] 郑大玮,孙忠富.关于积温一词及其度量单位科学性问题的讨论[J].中国农业气象,2010,31(2):165-169.
Zheng D W,Sun Z F.Discussion on scientificalness problem of accumulated temperature and its unit[J].Chinese Journal of Agrometeorology,2010,31(2):165-169.(in Chinese)
[4] 王婧瑄,郭建平,李蕊.春玉米积温稳定性及在发育期预报中的应用[J].应用气象学报,2019,30(5):577-585.
Wang J X,Guo J P,Li R.Accumulated temperature stability of spring maize and its application to growth period forecast[J].Journal of Applied Meteorological Science,2019, 30(5):577-585.(in Chinese)
[5] Peng J,Kim M,Kim K,et al.Application of climatic algorithm for prediction of regional whole-crop barley productivity[J].Journal of Animal Science,2018,96(S3): 510-511.
[6] Yamaguchi R,Matsunaga K,Watanabe A.Influence of temperature on pine wilt disease progression inseedlings[J].European Journal of Plant Pathology, 2020,156(2):581-590.
[7] 赵倩.不同积温模型的稳定性评估[D].北京:中国气象科学研究院,2016.
Zhao Q.Stability evaluation of different accumulated temperature model:as an example of spring maize in northeast China[D].Beijing:Chinese Academy of Meteorological Sciences,2016.(in Chinese)
[8] 姜会飞,温德永.基于线性生长假设利用极端温度计算日积温的方法[J].中国农业大学学报,2013,18(1):82-87.
Jiang H F,Wen D Y.Methods of calculating growing degree-day based on LR assumption and daily extreme temperatures[J].Journal of China Agricultural University, 2013,18(1):82-87.(in Chinese)
[9] 姜会飞,温德永.基于优化生长假设利用极端温度计算日积温的方法[J].中国农业大学学报,2013,18(2):116-123.
Jiang H F,Wen D Y.Methods of calculating growing degree-day based on OR assumption and daily extreme temperatures[J].Journal of China Agricultural University, 2013,18(2):116-123.(in Chinese)
[10] 段若溪,姜会飞.农业气象学(第3版)[M].北京:气象出版社,2018:80-81.
Duan R X,Jiang H F.Agricultural meteorology(3nd)[M]. Beijing:China Meteorological Press,2018:80-81.(in Chinese)
[11] 王芳,邬定荣,王春乙.两种参数化方案下冬小麦品种对发育期的影响[J].应用气象学报,2017,28(4):493-503.
Wang F,Wu D R,Wang C Y.Effects of cultivar shifts on winter wheat phenology under two parameterization methods[J].Journal of Applied Meteorological Science, 2017,28(4):493-503.(in Chinese)
[12] 沈国权.影响作物发育速度的非线性温度模式[J].气象,1980,31(6):9-11.
Shen G Q.Model of nonlinearity temperature on developing rate of crops[J].Meteorological Monthly,1980,31(6):9-11. (in Chinese)
[13] 高亮之,金之庆,李林.中国不同类型水稻生育期的气象生态模式及其应用[J].农业气象,1982,(2):1-8.
Gao L Z,Jin Z Q,Li L.Meteorological ecological model of different types of rice in China and its application[J]. Agricultural Meteorology,1982,(2):1-8.(in Chinese)
[14]高亮之,金之庆,黄耀,等.水稻计算机模拟模型及其应用之一:水稻钟模型,水稻发育动态的计算机模型[J].中国农业气象,1989,10(3):3-10.
Gao L Z,Jin Z Q,Huang Y,et al.Rice clock model:a computer simulation model of rice development[J].Chinese Journal of Agrometeorology,1989,10(3):3-10.(in Chinese)
[15] 殷新佑.水稻发育温度效应的非线性模型及其应用[J].作物学报,1994,20(6):692-700.
Yin X Y.A nonlinear model to quantify temperature effect on rice phenology and it’s application[J].Acta Agronomica Scinica,1994,20(6):692-700.(in Chinese)
[16] 殷新佑.对预测作物发育的积温法的评价[J].作物学报,1999,25(4):474-482.
Yin X Y.A critical appraisal of thermal time approach for predicting crop development[J].Acta Agronomica Scinica, 1999,25(4):474-482.(in Chinese)
[17] 徐善玲,黄兴国,黄琼,等.浅谈作物积温的稳定性及其预报的准确性[J].江西气象科技,2005,28(3):34-35.
Xu S L,Huang X G,Huang Q,et al.Discuss superficially the stability of the accumulated temperature of crops and accuracy predicted simply[J].Jiangxi Meteorological Science and Technology,2005,28(3):34-35.(in Chinese)
[18] 吴玉洁,叶彩华,姜会飞,等.不同积温计算方法作物发育期模拟效果比较[J].中国农业大学学报,2016,21(10): 117-126.
Wu Y J,Ye C H,Jiang H F,et al.Comparison of the simulation effect of different growing degree-days calculating methods on crop development processes[J]. Journal of China Agricultural University,2016,21(10): 117-126.(in Chinese)
[19] 肖静,李楠,姜会飞.作物发育期积温计算方法及其稳定性[J].气象研究与应用,2010,31(2):64-67.
Xiao J,Li N,Jiang H F.Calculation and stability of accumulated temperatures in the growing season of winter wheat[J].Journal of Meteorological Research and Application, 2010,31(2):64-67.(in Chinese)
[20] 姜会飞,郭勇,张玉莹,等.不同下限基点温度对积温模型模拟效果的影响[J].中国农业大学学报,2018,23(5):131-141.
Jiang H F,Guo Y,Zhang Y Y,et al.Impact of base temperature on the growing degree-day and simulation effect of GDD model[J].Journal of China Agricultural University,2018,23(5):131-141.(in Chinese)
[21] 叶彩华,周孝煌,姜会飞,等.下限温度对北京樱花盛花始期模拟效果的影响[J].中国农业气象,2018,39(1):1-8.
Ye C H,Zhou X H,Jiang H F,et al.Impacts of different base temperature on simulation effect of beginning flowering date ofin Beijing[J].Chinese Journal of Agrometeorology,2018,39(1):1-8.(in Chinese)
[22] 蓝鸿第等.水稻光温问题的研究[M].北京:气象出版社,1982:73.
Lan H D,et al.Research on the light and temperature of rice[M].Beijing:China Meteorological Press,1982:73.(in Chinese)
[23] 武晓梅.活动积温与有效积温的概念及计算方法[J].山西农业科学,1985(4):42.
Wu X M.Concept and calculation method of active accumulated temperature and effective accumulated temperature[J].Journal of Shanxi Agricultural Sciences, 1985(4):42.(in Chinese)
[24] 甘蕾,周脚根,石锦,等.点源时间序列数据缺失值的估值方法比较:以小流域气象和水文数据为例[J].中国农业气象,2018,39(3):195-204.
Gan L,Zhou J G,Shi J,et al.Performance comparison of different interpolation methods on missing values for time series data:a case study of meteorological and hydrological data in subtropical small watershed[J].Chinese Journal of Agrometeorology,2018,39(3):195-204.(in Chinese)
[25] 邱美娟,刘布春,刘园,等.中国北方苹果主产省降水分布特征分析[J].中国农业气象,2020,41(5):263-274.
Qiu M J,Liu B C,Liu Y,et al.Analysis on distribution characteristics of precipitation in major production provinces of apple in Northern China[J].Chinese Journal of Agrometeorology,2020,41(5):263-274.(in Chinese)
[26] 马雪晴,胡琦,潘学标,等.1961-2015年华北平原夏玉米生长季气候年型及其影响分析[J].中国农业气象,2019, 40(2):65-75.
Ma X Q,Hu Q,Pan X B,et al.Analysis of annual climate types and its impact on summer maize in the North China plain over the period 1961-2015[J].Chinese Journal of Agrometeorology,2019,40(2):65-75.(in Chinese)
[27] 马鹏里,蒲金涌,赵春雨,等.光温因子对大田冬小麦累积生物量的影响[J].应用生态学报,2010,21(5):1270-1276.
Ma P L,Pu J Y,Zhao C Y,et al.Influence of light and temperature factors on biomass accumulation of winter wheat in field[J].Chinese Journal of Applied Ecology,2010, 21(5):1270-1276.(in Chinese)
[28] 郭建平.气候变化对农业气候资源有效性的影响评估[M].北京:气象出版社,2016:198.
Guo J P.Evaluation of effect of climate change on the efficiency of agricultural climate resources[M].Beijing: China Meteorological Press,2016:198.(in Chinese)
[29] Sánchez B,Rasmussen A,Porter J R.Temperatures and the growth and development of maize and rice:a review[J]. Global Change Biology,2014,20(2):408-417.
[30] Porter J R,Gawith M.Temperatures and the growth and development of wheat:a review[J].European Journal of Agronomy,1999,10(1):23-26.
[31] 李蕊.东北春玉米积温稳定性影响因素与积温模型的改进[D].北京:中国气象科学研究院,2018.
Li R.Impact factors of accumulated temperature stability and improvement of accumulated temperature model of northeast spring maize[D].Beijing:Chinese Academy of Meteorological Sciences,2018.(in Chinese)
[32] 刘长民.夏玉米发育进程分析和生育期预报[J].陕西气象,1994,(3):5-7.
Liu C M.Summer maize development process analyze and growth period prediction[J].Shaanxi Weather,1994,(3):5-7. (in Chinese)
[33] Andales A,Wang J,Sammis T W,et al.A model of pecan tree growth for the management of pruning and irrigation[J]. Agricultural Water Management,2006,84(1):77-88.
[34] Confalonieri R,Bechini L.A preliminary evaluation of the simulation model CropSyst for alfalfa[J].European Journal of Agronomy,2003,21(2):223-237.
[35]Lu H Y,Lu C T,Chan L F,et al.Seasonal variation in linear increase of taro harvest index explained by growing degree days[J].Agronomy Journal,2001,93(5):1136-1141.
[36] 沈国权.当量积温及其应用[J].气象,1981,32(7):23-25.
Shen G Q.Accumulated equivalent temperature and application[J].Meteorological Monthly,1981,32(7):23-25. (in Chinese)
[37] 李蕊,郭建平.东北春玉米非线性积温模型参数改进[J].应用气象学报,2018,29(2):154-164.
Li R,Guo J P.Improving parameters of nonlinear accumulated temperature model for spring maize in Northeast China[J].Journal of Applied Meteorological Science,2018,29(2):154-164.(in Chinese)
Comparison of Model’s Stability about Integrated Temperature Based on Linear Hypotheses
LUAN Qing1,2, GUO Jian-ping2,3, MA Ya-li1, ZHANG Li-min2,4, WANG Jing-xuan5, LI Wei-wei6
(1. Shanxi Climate Center, Taiyuan 030006, China; 2.Chinese Academy of Meteorological Sciences, Beijing 100081; 3.Collaborative Innovation Center on Forecast and Evaluation of Meteorological Disasters, Nanjing University of Information Science and Technology, Nanjing 210044; 4.Huludao Meteorological Bureau, Huludao 125000; 5.Inner Mongolia Meteorological Service Center, Hohhot01005l; 6.Houma Meteorological Bureau of Shanxi Province, Houma 043000)
Integrated temperature, as a measure of heat, has been widely used in the prediction of crop development period, yield, diseases and insect pests. However, more and more studies showed that the integrated temperature is unstable, and the stability of different integrated temperature models is different. Therefore, it is great significant to analyze and understand the stability of different integrated temperature models for the application of integrated temperature in agricultural meteorological work. In this paper, four linear hypotheses about response of growth and development rate to temperature and five integrated temperature models were made. The first linear hypothesis is that the growth and development rate of crops increases linearly with the increase of temperature when the average daily temperature (T) is higher than the lower limit temperature (Tb). It is the hypothesis of the active integrated temperature model (Aa) and the first effective integrated temperature model (Ae1). The second hypothesis is that when the T is between the lower limit temperature (Tb) and the upper limit temperature (Tu) of crops, the growth and development rate of crops increases linearly with the increase of temperature and reaches the maximum (1.0); when the T exceeds Tu, the growth and development rate of crops remains constant with the increase of temperature. It is the hypothesis of the second effective integrated temperature model (Ae2). The third hypothesis is that when the T is between Tband Tu, the growth and development rate of crops increases linearly with the increase of temperature and reaches the maximum (1.0); when the T exceeds Tu, the growth and development of crops stagnate. It is the hypothesis of the third effective integrated temperature model (Ae3). The fourth hypothesis is that when the T is between Tband the optimum temperature (T0), the growth and development rate of crops increases linearly with the increase of temperature and reaches the maximum (1.0); when the T is between T0and Tu, the growth and development rate of crops decreases linearly with the increase of temperature and decreases to 0.0; when the T exceeds Tu, the growth and development of crops stagnate. It is the hypothesis of the fourth effective integrated temperature model (Ae4). Based on these hypotheses, long time series of crop development period observation data and surface meteorological observation data of two winter wheat stations, three spring maize stations and three summer maize stations in Shanxi Province were selected to calculate the active integrated temperature and four effective integrated temperature. Using the coefficient of variation, the average simulation deviation of the crop growth period and the simulation accuracy of the crop growth period as indicators, the stability of the five integrated temperature models were evaluated. The result showed that the coefficient of variation (CV) of Aa model during different growth stages for three representative crops in each station were between 0.062 and 0.143; the CV of Ae1, Ae2 and Ae3 models were between 0.073 and 0.201; the CV of Ae4 model were between 0.072 and 0.179. That is, when using the CV as an indicator to test the stability of each model, the stability of Aa model was highest, that of the Ae4 model was the second and that of the Ae1, Ae2 and Ae3 models were the weakest. The average simulation deviation (SD) of Aa model for different growth periods of three representative crops in each station were between 1.3 and 5.8 days; the SD of Ae1, Ae2 and Ae3 models were between 1.5 and 6.6 days; the SD of Ae4 model were between 2.2 and 6.7 days. The simulation accuracy (SA) of Aa model for different growth periods of three representative crops in each station were between 39.5% and 92.3%; the SA of Ae1, Ae2 and Ae3 models were between 28.6% and 87.2%; the SA of Ae4 model were between 26.5% and 84.6%. That is, when using the SD and SA as the indicators, the Aa model had the best simulation effect for different growth periods of the crops and had the highest stability. The simulation accuracy and stability of Ae1, Ae2 and Ae3 models had no significant difference and were higher than those of Ae4 model. For spring maize and summer maize, the stability of each integrated temperature model was consistent from emergence to tasseling and from tasseling to maturity, and the stability of each integrated temperature model from emergence to tasseling was higher than that from tasseling to maturity. While the stability of each integrated temperature model for winter wheat from jointing to heading and from heading to maturity varied from region to region. Therefore, in practical applications, it is also necessary to select the appropriate base point temperature according to the crop planting region, variety relationship and growth period, and to select a more stable integrated temperature model based on the comprehensive analysis of the stability of multiple integrated temperature models.
Integrated temperature; Linear hypotheses; Stability; Coefficient of variation; Simulation accuracy of growth period
10.3969/j.issn.1000-6362.2020.11.002
栾青,郭建平,马雅丽,等.基于线性生长假设的作物积温模型稳定性比较[J].中国农业气象,2020,41(11):695-706
2020−07−06
郭建平,E-mail:gjp@cma.gov.cn
国家自然科学基金(31571559);中国气象科学研究院科技发展基金(2019KJ006);公益性行业(气象)科研专项(GYHY201306038)
栾青,E-mail:luanqing2003@163.com