Numerical Estimation of Crack Depth in Curved Surfaces of Polymer Bonded Explosives Using Rayleigh Surface Wave
2020-08-10JIANGChangYANGZhanfengLIWeibinZHANGWeibinTIANYong
JIANG Chang,YANG Zhan⁃feng,LI Wei⁃bin,ZHANG Wei⁃bin,TIAN Yong
(1. Institute of Chemical Materials,China Academy of Engineering Physics,Mianyang 621999,China;2. School of Aerospace Engineering,Xiamen University,Xiamen 361005,China)
Abstract:Cracks in polymer bonded explosives(PBXs)may occur during manufacturing,transportation and storage stages. The surface crack of explosives has an important influence on their mechanical properties and detonation performance. Quantitative detection of the depth of the surface crack is of great significance to the process of surface crack removal. The numerical simula⁃tion of surface crack depth estimation was investigated by using Rayleigh surface waves which propagate along the cylindrical and spherical surfaces of PBXs. The propagation patterns of surface waves were studied on these two types of surfaces. The reflec⁃tion and transmission of surface waves at different frequencies in PBXs with crack of varied depth were simulated through the fi⁃nite element method(FEM).The FEM results indicate that the depth of crack in curved surfaces can be deduced according to the amplitude variations of reflected and transmitted waves.
Key words:Rayleigh wave;curved surface;polymer bonded explosive;crack depth;simulation
1 Introduction
Polymer bonded explosives(PBX),as an im⁃portant type of national defense and military prod⁃uct,possesses the advantages of high energy densi⁃ty,great mechanical properties and superior securi⁃ty. However,cracks often occur in the process of forming,machining and post⁃processing,leading to performance degradations of the explosives[1-5].Ultra⁃sonic inspection is an important nondestructive tech⁃nique for assessment of many types of macro and mi⁃cro defects in contrast to the industrial computed to⁃mography[6-8]. Given that cracks usually initiate from the surface,ultrasonic surface wave seems to be rel⁃atively more feasible and appropriate for the evalua⁃tion of crack depth in PBXs providing more sensitivi⁃ty than others with most of the wave energy con⁃fined in the vicinity of the free surface within a depth of the specimen under test[9].
Researches have been reported on ultrasonic crack detection in plates,but references to crack depth determination with respect to curved surfaces of PBXs are still limited for the moment[10]. In a re⁃cent investigation,C. He[11]presented a quantitative characterization method for estimating surface crack depth employing electromagnetic acoustic transduc⁃ers. Other studies have also demonstrated consider⁃able results on the interaction of Rayleigh waves and cracks[12]. However,the above studies investigate cracks only on the planar surface,while distinctive propagation patterns of surface waves are supposed to turn up concerning curved surfaces. To date,few works on crack detection on curved surfaces using surface waves can be found.
This paper aims to provide solutions of ultrason⁃ic method for quantitatively estimating crack depth on cylindrical and spherical surfaces of PBXs. An in⁃version method for crack depth estimation involving a benchmark of the transmission and reflection curves is proposed. By means of the finite element method(FEM),wave motion of surface wave on cy⁃lindrical and spherical PBXs are studied,along with the reflection and transmission waves resulted from the interaction of Rayleigh waves and cracks of dif⁃ferent depths. Results are analyzed considering the theoretical predictions. Comparison of the simula⁃tion results with certain references is made to ensure the credit of this numerical study.
2 Theory
2.1 Rayleigh surface wave
Rayleigh waves are a type of surface wave which propagate near the surface of solids and de⁃crease exponentially in amplitude as distance from the surface increases. Many researches have studied the wave velocity of Rayleigh surface wave regard⁃ing different characteristics of materials[13]. The ma⁃jor axis of the elliptic orbits is vertical to the surface,and the in⁃plane motion of a particle is retrograde at shallow depths and prograde at greater depths. The earliest approximate expression was given bycR=(0.87 + 1.12ν)( 1+ν)·c2,wherec2is the shear wave velocity.
2.2 Dispersion in curved surfaces
The Rayleigh wave dispersion is usually observed when the properties of the materials alter with depth such as propagations in the earth and multi⁃layered structures. On the other hand,the influence of cur⁃vature radii on the wave number and wave velocity has been theoretically analyzed. The Rayleigh wave velocity in curved surface is given by[13]

wherecRdenotes the Rayleigh wave velocity along a plane surface,ωis the angular frequency,ραandρβare the curvature radii parallel and perpendicular to the propagation direction,respectively.A,BandCare expressed as follows
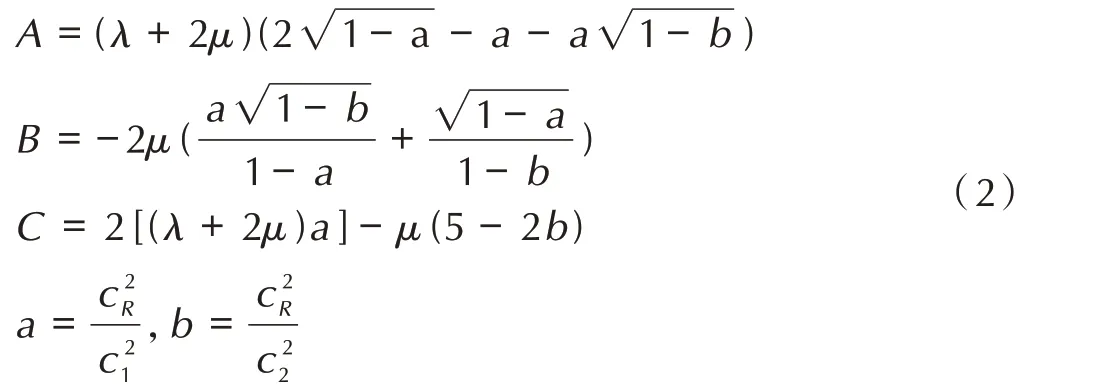
wherec1andc2are the longitudinal and transverse wave velocities,respectively,andλ,μare Lamé constants. It is noteworthy that the phase velocity of Rayleigh wave along a curved surface is dependent on the wave frequency and curvature radii besides the elastic constants and density of the material. It can be inferred that suitable frequencies of surface wave are supposed to be applied for different mea⁃surement scales.
3 Model development
The following simulation was implemented based on the COMSOL Multiphysics V5.3a. The sol⁃id mechanics module was employed for the Ray⁃leigh surface wave studies.
mother took her to the kitchen. She filled three pots with water and placed each on a high fire. Soon the pots came to a boil. In the first, she placed carrots, in the second she placed eggs and in the last she placed ground coffee beans. She let them sit and boil without saying a word. In about twenty minutes, she turned off the burners. She fished the carrots out and placed them in a bowl. She pulled the eggs out and placed them in a bowl. Then she ladled the coffee out and placed it in a bowl.
3.1 Geometry & material
The FEM simulation was conducted for existing products of PBXs of specific sizes. The computation⁃al model as regards cylindrical surface was estab⁃lished by a two⁃dimensional geometry. The left side of the geometry was reserved for study of the surface wave propagation along cylindrical surface,and a crack perpendicular to the surface was set on the right side(45° direction). The width of the crack is constantly set to 0.1 mm.
According to the specific material properties provided by the Institute of Chemical Materials(Chi⁃na Academy of Engineering Physics),the approxi⁃mately isotropic homogeneous material is defined as follows:the density is 1860 kg·m-3,the Young's modulus is 10 GPa and the Poisson's ratio is 0.32.Note that certain PBXs are made of a high⁃volume fraction of explosive particles and a very low⁃vol⁃ume fraction of binder,especially for the HMX(e.g.PBX 9501)type of PBX that comprises a 95% explo⁃sive particle and only 5% binder[14]. It has been proved that the explosive particles are linear elastic at or below room temperature[15]. In addition,the monoclinic crystals (explosive particles) are ran⁃domly oriented in PBX[15],so the isotropic elastic properties can be approximately used for this study.
For the spherical surface,a two⁃dimensional ax⁃isymmetric model was built with the same material properties and similar geometry(a crack set on the 45° direction). Fig.1 shows the schematics of the above configurations. It should be noted that the crack drawn in the figure has been enlarged for clari⁃ty. The space around the crack is filled with air.
3.2 Structural mechanics & mesh
The ultrasonic point source was determined by prescribed displacement. A sequence of domain point probes was set on the surface of the geometric model as shown in Fig.1 to receive the ultrasonic sig⁃nals with respect to the normal and tangential dis⁃placement components. Given that surface waves are constrained to a certain depth,two meshes of different densities are deployed to the whole do⁃main. The mesh size of the outer surface layer isλ·10-1whereλis the wavelength,and a predefined extremely fine mesh is set up for the rest. The surface layer is twice as thick as the crack. In order to re⁃duce the wave interference and facilitate the analysis of the signal,a low reflection boundary was deter⁃mined for the inner surface of the models.
Since the Rayleigh surface waves are excited by point sources determined on the outer faces of the models by prescribed displacements(Hanning win⁃dowed sin signals of multi⁃cycles,the maximum am⁃plitudes are 1× 10⁻⁷m)towards the normal direc⁃tion of the surfaces,ultrasonic waves propagating along nearly half space direction are introduced into the models. Except for the expected Rayleigh surface waves which propagate along the outer surfaces,the other inconsequential waves can be diminished to a great extent by the absorption of the low reflection boundary conditions. Note that this excitation meth⁃od is in certain degree an imitation of laser ultrason⁃ic excitation,which has been used by a few re⁃searchers with reasonable results[16-18]. In addition,the ultrasonic near⁃field effect,which is not perti⁃nent to the scope of this study,is diminutive enough to be neglected according to this particular mechan⁃ic load.
3.3 Solver configurations
The numerical simulation involves ultrasonic in⁃put signals of 0.25,0.5,1.0,1.5 MHz and 2.0 MHz.The time steps of the transient solver are set as 0.1/f,wherefdenotes the frequencies of the excited Ray⁃leigh waves. The above configurations can ensure moderate accuracy of solutions to the specified problems.
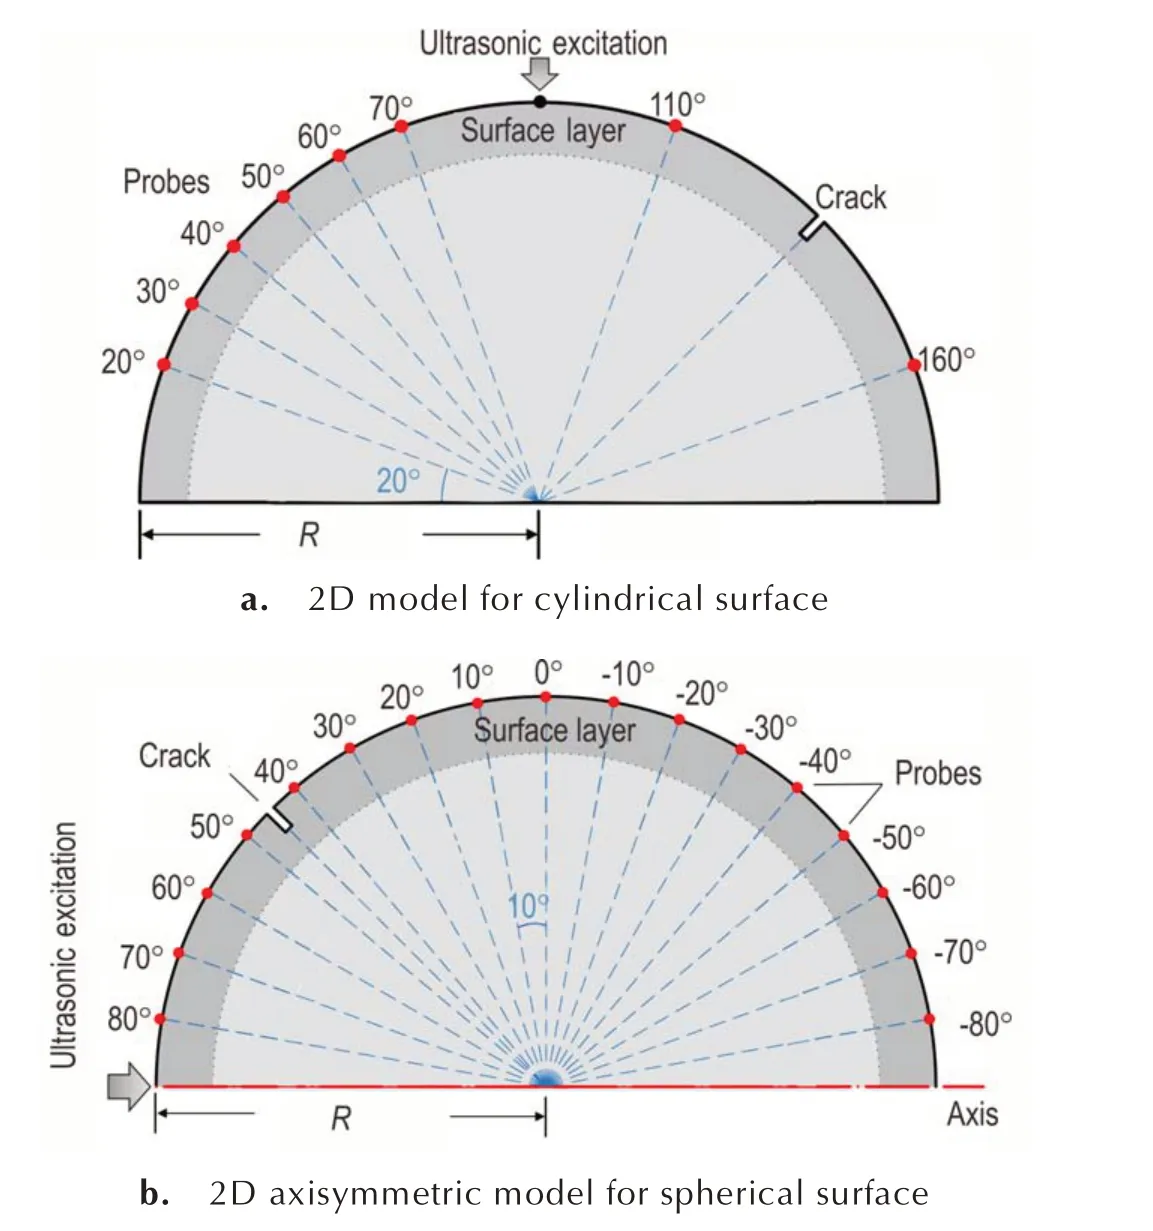
Fig.1 Geometric models and physical setups
4 Results & discussion
4.1 In cylindrical surface
According to the model developments,an input signal at 1 MHz was brought into the model from the above of the geometry. The prescribed displace⁃ment vertically downward causes surface waves to be generated on the top of the geometry and propa⁃gated towards left and right. Firstly,signals picked up by probes on the left side are presented in Fig.2a.As one can see,the normal component of the parti⁃cle displacement in the cylindrical surface decreases firstly to a certain degree,then rises symmetrically to almost the same values it has reached before. The minimum of the normal displacement is presumed to occur at the 45° position on the left side. In the meanwhile,the trends of decrease and increase are most likely to follow a linear pattern. The tangential displacements seem to be identical as shown in Fig.2b. The above phenomenon can be attributed to the curve of the Rayleigh surface wave guide. For the cylindrical surface,the radii of curvature of the outer surface isRfor direction parallel to the figure,and infinite for direction perpendicular to the figure.The wave velocity of Rayleigh surface wave at 1 MHz propagating in cylindrical surface of PBX is calculated as 1302.5 m·s-1.

Fig.2 Rayleigh surface waves(1 MHz)received on the cy⁃lindrical surface at different positions

Fig.3 Snapshots of Rayleigh surface waves(1 MHz)on the cylindrical surface at different times
The wavelength of the input ultrasonic signal at the frequency of 1 MHz is about 1.3 mm,and the crack depth ranging from 0.1 mm to 1.1 mm was de⁃termined to achieve the above numerical simula⁃tions. The ultrasonic surface wave propagated along the curved cylindrical surface and interacted with the surface crack,resulting in the reflected and trans⁃mitted waves which were received at the fixed posi⁃tions(110° and 160°)for the investigation of assess⁃ment of crack depth. Fig.4 shows the maximum am⁃plitudes of the reflected waves and transmission waves with respect to different crack depth. As seen,the maximum amplitudes of the reflected waves in⁃crease with the crack depth within certain range(d≤0.4 mm). In a similar way,the maximum ampli⁃tudes of the transmission waves decrease with the crack depth withind≤0.4 mm. Therefore,the depth of a crack can be evaluated by measuring the maxi⁃mum amplitudes of the reflected and transmission waves and concurrently referring to a pre⁃measured baseline of the relation curves. Note that the maxi⁃mum amplitude of the reflected waves decreases when the crack depth increases above 0.6 mm,this can be due to the energy scattering of multi wave packets generated from the interaction with the crack.

Fig.4 Relation between the maximum amplitudes of reflect⁃ed and transmission waves and the crack depth(input signal at 1 MHz)
4.2 In spherical surface
4.2.1 Signal analysis
Regarding the spherical surface,similar FEM simulations are achieved adopting the 2D axisym⁃metric model presented in Fig. 1b,which can be used to enhance the calculation efficiency of the simulation(i.e. by reducing a 3D problem to 2D axi⁃symmetric one). This setup is believed to be reason⁃able with regard to serval published works[19-20]and the COMSOL Users Guide. First,an ultrasonic sig⁃nal was introduced into the model in the absence of the crack for study of the wave propagation. As shown in Fig.5,both the normal and tangential com⁃ponents of the particle displacement are altering while the wave propagates along the surface. Espe⁃cially,the normal displacement of the wave in the spherical surface decays and rises over an approxi⁃mate exponential trend,while the tangential dis⁃placement varies over an approximate linear trend.The minimums of the displacement components are both observed at the 0° position. The curvature of the spherical surface mainly accounts for the above amplitude changes. In addition to the excitation and reception of a signal at the frequency of 0.25 MHz as shown in Fig.5,signal at other frequencies(0.5,1,1.5 MHz,and 2 MHz)were also introduced into the model for comparison. An interesting fact is that the amplitude of the Rayleigh surface wave in⁃creased back to larger values after propagating through the equator of the model (0° position)when the frequency of the input signal is 0.25 MHz and 0.5 MHz,while the amplitude of the surface wave increased much less after that when the fre⁃quency is above 1 MHz. Especially,the amplitude of the surface wave at the frequency of 2 MHz in⁃creased a few while propagated to the -80° position compared to that at the 0° position. Besides,the number of cycles of the time domain signal observed from the 0° to -80° positions increased. This phe⁃nomenon,which is not presented in figure here,can be attributed to the geometric dispersion of high⁃frequency ultrasonic signals,embodying the law of conservation of energy.

Fig.5 Rayleigh surface waves(0.25 MHz)received on the spherical surface at different positions
4.2.2 Motion pattern


Fig.6 Analysis of geometrical dispersion impact on the am⁃plitude of Rayleigh surface wave

In order to understand the motion of particles in more detail,on the other hand,the amplitude ratios of the received surface waves in the normal and tan⁃gential directions at different positions are calculat⁃ed. As shown in Fig.7a,the amplitude ratio(normal component to tangential component) of the Ray⁃leigh surface wave decreased from the wave source to 45° position,and increased to 1.6 at the equator of the model(0° position). It is interesting to find that the trends of the four different input signals are consis⁃tent in terms of the amplitude ratio. In addition,the amplitude ratio reached 1.0 when the surface wave propagated to the 45° position,which suggests that the orbit of the surface particle there is a standard cir⁃cle.More specifically and vividly,Fig.7b demonstrat⁃ed the elliptical orbits of particle motion at different positions. It is noted that the range of motion of the surface particle reduces since the Rayleigh wave dis⁃perses from the excitation point source.

Fig.7 Motional pattern of the surface waves
The skin effect of the Rayleigh surface wave in the spherical surface is also verified by setting a se⁃ries of domain point probes at the 45° position un⁃der the surface of the model with different depths. As presented in Fig.8,the normal amplitudes of the ul⁃trasonic signals at different frequencies decreases along the depth beneath the surface of the model. Es⁃pecially,the higher the frequency of the input sig⁃nal,the smaller the area Rayleigh surface wave can influence. As one can see,the amplitude of the re⁃ceived signal detected 1 mm beneath the surface is rather smaller for input signal at the frequency of 1.5 MHz than others. This fact provides guidance for the frequency selection in the estimation of surface crack depth in the subsequent simulations and future experiments. In addition,the result is in accordance with theory relating to surface wave that the primary wave field is within a wavelength long beneath the surface[13].

Fig.8 Skin effect of the Rayleigh surface waves at different frequencies
4.2.3 Crack depth inversion
Based on the above analyses and the goal to as⁃sess the crack depth in PBXs,ultrasonic signals at frequencies of 0.25,0.5,1,1.5 MHz and 2 MHz are brought into the model shown in Fig.1b to inves⁃tigate the wave reflections and transmissions,respec⁃tively. The surface wave detected at the 80°,70°and 60° are extracted for the analysis of the wave re⁃flections,and signals received at the 30°,20° and 10° are processed for study of the wave transmis⁃sions. As shown in Fig.9,the normal amplitudes of the reflected and transmitted waves at different fre⁃quencies vary with the crack depth. Note that the ab⁃scissa is labeled asd/λsince the FEM results suggest the wave reflections share almost the same pattern except for slight discrepancies as the frequency of the input signal varies,as well as the wave transmis⁃sions. As seen from Fig.9a,amplitudes of signals re⁃ceived near the ultrasonic source(80° for instance)are larger than that away from the source(60° for in⁃stance),which suggests that one can set the receiv⁃ing probes befittingly away from the equator of the future specimen for higher signal⁃to⁃noise ratio. Be⁃sides,the relation of approximately monotonic de⁃creasing variation between the amplitude of the transmitted wave and the crack depth shown in Fig.9b seems to provide a more feasible and practi⁃cal way to estimate the crack depth in the spherical surface than the reflected waves. The amplitudes of the reflected and transmitted waves remain almost the same(call it a saturation)when the crack depth reaches to a certain degree,and the local irregulari⁃ties shown in Fig.9a may be attributed to the interfer⁃ences of the back scattered waves. As for the tangen⁃tial components of the reflected waves,Fig.10 shows a similar relationship to Fig. 9a. From a practical point of view,however,the normal displacement is most likely to be measured in experiments other than the tangential one,even though the tangential component possesses a less variation of amplitude while propagating along the curved surface.
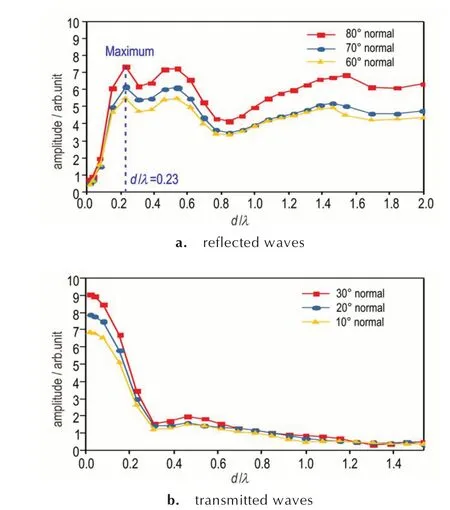
Fig.9 Relation between the crack depth and the normal am⁃plitudes of the waves received at different positions. d,λ de⁃note the crack depth and wavelength of the excited surface wave,respectively

Fig.10 Relation between the crack depth and the tangential amplitudes of the reflected waves at different positions. d,λ denote the crack depth and wavelength of the excited surface wave,respectively
For sufficient accuracy of FEM results ranging from 0 to about 0.3d/λ(ddenotes the crack depth),more simulations have been conducted as shown in Fig.11. The frequency of the input signal was deter⁃mined as 0.25 MHz(wavelength 12 mm). As one can see,due to the relative monotonic variation trend(d/λ <0.23,Fig. 11b). The relation between the crack depth and the normal amplitude of the transmitted wave can be utilized for crack depth esti⁃mation. In addition,the reflected waves can also be referred to for reliability considerations. These wave reflection and transmission curves indicate that one can measure a series of benchmarks as references for depth estimation of unknown cracks in the curved surface,and different frequencies can be used for characterization at different length scales. Thus,the inversion method for the crack depth estimation in curved surfaces of this PBX can be described as fol⁃lows:
Step 1:For a PBX with unknown depth of crack,introduce a relatively very low⁃frequency ultrasonic Rayleigh surface wave into the material (e. g.0.1 MHz for a crack of which depth is below 1mm to ensured/λ <0.04). In other words,the detection starts from using a long wavelength surface wave to observe the reflected and transmitted waves.
Step 2:By frequency tuning(increase the fre⁃quency of the input signal),the wavelength decreas⁃es,and the amplitude of transmitted wave drops,along with the increase of amplitude of the reflected wave.
Step 3:When the amplitude of the reflected wave reaches its first extremum(e.g. a local maxi⁃mum as shown in Fig.11a),continue the frequency increasing with attention.

Fig.11 Relation between the crack depth and the normal am⁃plitudes of the waves received at different positions. The fre⁃quency of the input signal is 0.25 MHz(wavelength 12 mm)
Step 4:When the amplitude of the reflected wave reaches its first maximum as shown in Fig.9a,the crack depth can be estimated as 0.23λ. Noted that this can be confirmed by repeated implementa⁃tion of a large range of frequency,as well as the ref⁃erence of amplitude of the transmitted wave.
It is important to note that the above simulations have not taken the material attenuation into consid⁃eration for investigation of surface acoustic waves in⁃fluenced by geometry and material separately. How⁃ever,the material attenuation could be determined as constant when the propagation path and proper⁃ties of the surface wave remain consistent for experi⁃mental measurements. Besides,the results are in cer⁃tain way similar to a published work which was con⁃ducted in a cracked plate by electromagnetic acous⁃tic transducer[15]. Thus,the proposed crack estima⁃tion method can potentially be promising with credit.
5 Conclusions
(1)The surface wave propagations in cylindri⁃cal and spherical surfaces of PBXs are investigated.The general disperse patterns of Rayleigh surface wave motion along these curved surfaces are pre⁃sented and analyzed.
(2)The wave reflections and transmissions with a single crack by introducing ultrasonic signals at dif⁃ferent frequencies are recorded and processed for study of the influences on surface waves by the in⁃duced rectangle cracks with various depths.
(3) The numerical simulations indicated that the proposed crack depth estimation method involv⁃ing transmission waves and reflected waves is poten⁃tially viable tools to quantitatively estimate the depth of cracks in the curved surface of PBXs.
(4)Future related experiments are of great sig⁃nificance to achieve the crack location and depth measurement in curved surfaces with the method and results provided in this paper.