The double coupled microwave resonance probes and application for diagnosingatmospheric pressure plasma jet
2020-06-28朱芸桢,徐金洲,褚佳琪


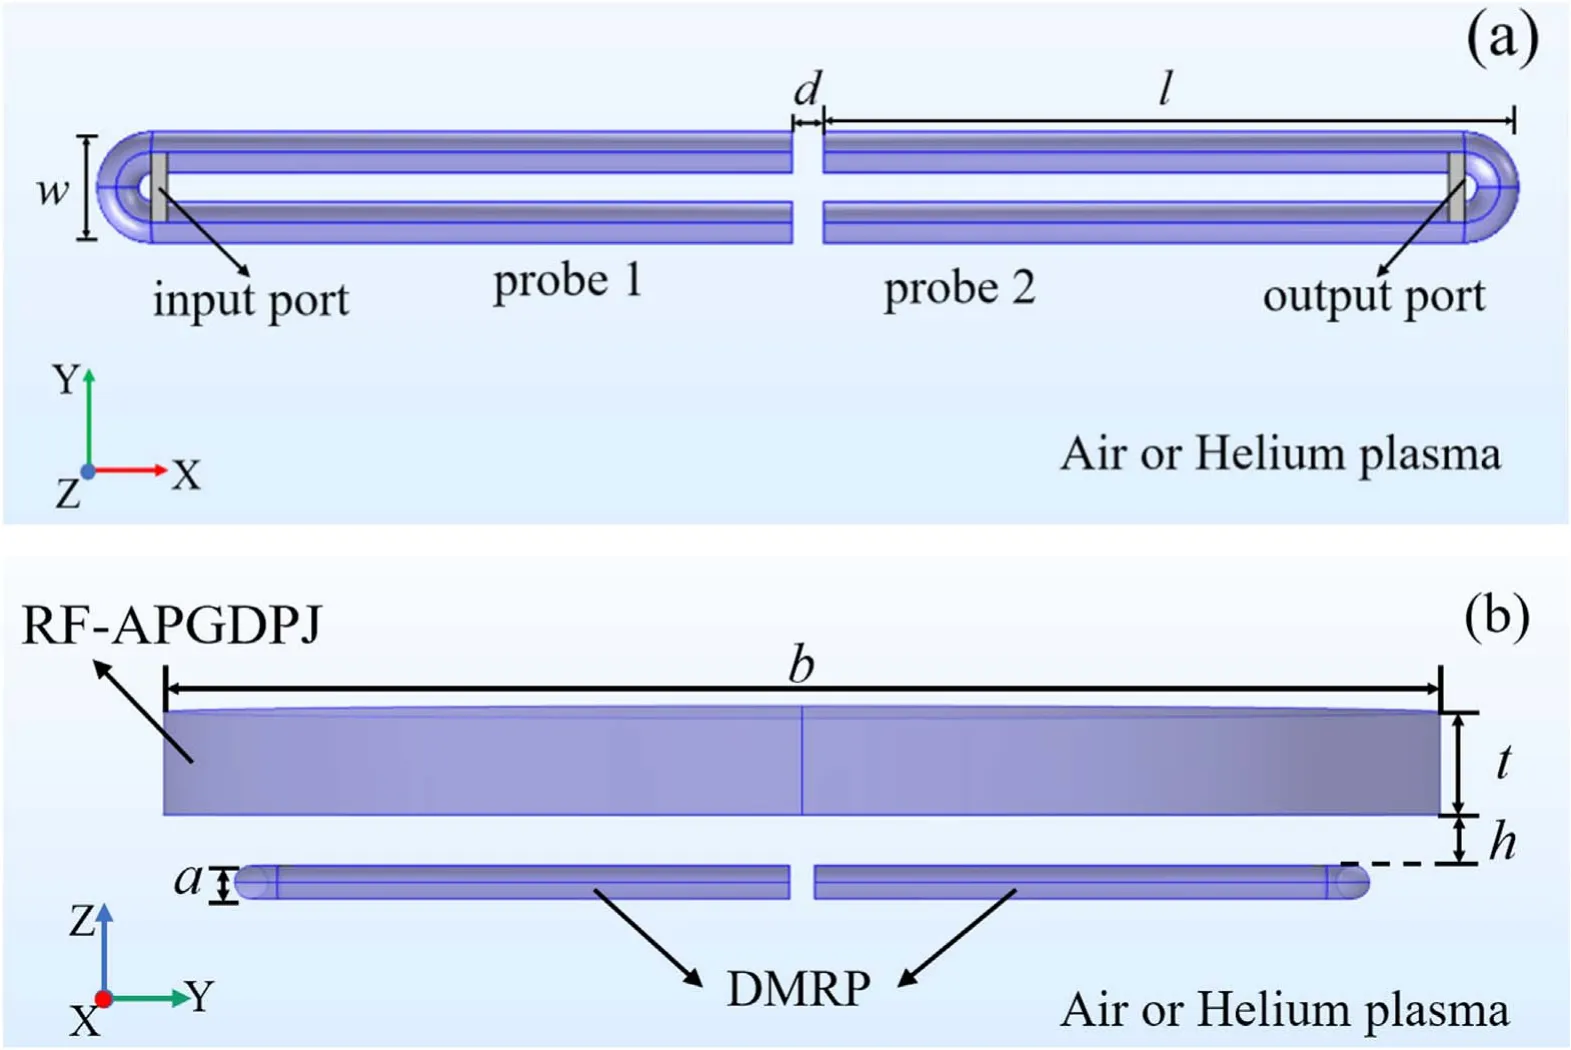
Figure 1.Simulation model of (a) the DMRP and (b) the DMRP with RF-APGDPJ applicator.
2. Simulation model and results
2.1. Simulation model

2.2. The resonance characteristics
The reflection spectra of the DMRP in air with a probe gap d of 1 mm without jet applicator is shown in figure 2(a). The two resonant frequencies on the reflection spectrum of the DMRP in air, f1and f2are 3.344 GHz and 3.520 GHz,respectively. Only a resonant frequency fresof 3.448 GHz appears for hairpin probe. Figure 2(b) is the electric field distribution of DMRP at two resonant frequencies, compared with that of the hairpin probe at the frequency fres.The electric field distribution of DMRP is symmetrical, and its field strengths at resonant frequency f1or f2are about half of that of the hairpin probe.
Figures 3(a) and (b) show the reflection spectra of the DMRP and the electric field distribution at resonance frequency f2at different values of probe gap d. As the gap d increases, two resonant peaks at frequencies f1and f2shift to the frequency fres, the reflectance at resonant decreases, the corresponding FWHMΔf1,airandΔf2,airdecrease. The electric field strength of the probe at left increases,whereas that at right decreases.When the gap d increases to 20 mm,only one resonant frequency fresexists and the electric field distribution is similar with that of a hairpin probe.
The characteristic of the DMRP can be analyzed by the coupled oscillator theory [27, 28]. There are two resonant modes in the DMRP system. Assuming that the eigenfrequencies and the quality factors of two hairpin probes are equal, the corresponding resonant frequencies of the two modes are respectively

Figure 2.(a) The comparison of reflection spectra of the DMRP and hairpin probe. (b) The electric field distributions of the DMRP at the frequency f1,f2,respectively. The data acquisition baseline is the y-axis in the simulation model, and the zero point is the central symmetry point. The background environment is air and the probe gap d is 1 mm.

Figure 3.(a)The reflection spectra of the DMRP and(b)the electric field distributions of the DMRP at resonance frequency f2 with probe gap d of 0.5 mm, 1.5 mm, 2.5 mm and 20 mm, respectively.
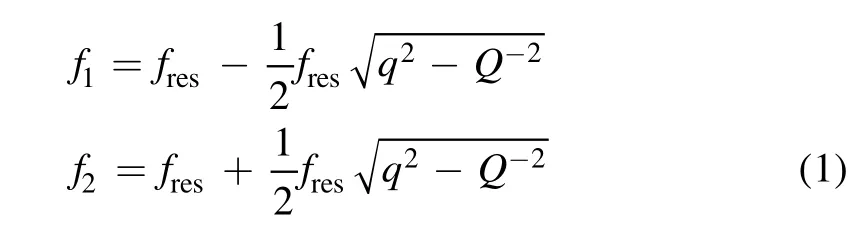
Q is the quality factor of a hairpin probe,and q is the coupling coefficient between the two side of DMRP.The attenuation of electric field in the gap means that the coupling coefficient q decreases as the gap d increases.In the other word,the probe gap d determines whether the two probes are isolated or coupled. Whenq≫Q-1,two resonant frequencies can be clearly distinguished and can be approximated as

Figure 4.The reflection spectra of the DMRP at distance h to RFAPGDPJ of 2 mm,5 mm,10 mm.And the probe gap d is of 1.0 mm.

On the contrary, ifq≤Q-1, thenf1=f2=fres,only one resonant frequency appears on the spectrum. Although two hairpin probes in the DMRP have the same size,the energy is fed into DMRP from the left port,and the port at right is off.The energy transmission in DMRP is carried out by electrical coupling between two hairpin probes.So,the effective length of hairpin probe 1 is slightly different from that of hairpin probe 2, and it results in a slight difference in the eigenfrequency and quality factor Q of the two hairpin probes,which is the cause of the different frequency shift in the two modes of DMRP.
Figure 4 shows the reflection spectra of the DMRP at the different distances h to the RF-APGDPJ applicator. As the distance h decreases, two resonant frequencies shift closer,and the FWHM of two resonant modes (Δf1,airandΔf2,air)decrease. For a hairpin probe, the FWHM at resonance increases with the decreasing of distance h or the quality factor Q is degraded [24]. The influence of RF-APGDPJ applicator on DMRP is contrary to that of a hairpin probe.As shown in figure 4,when the distance h decreases from 10 mm to 2 mm, the FWHMΔf1,airandΔf2,airat the resonant states are reduced from 17.36 MHz to 10.19 MHz, and from 19.16 MHz to 12.23 MHz, respectively. Two clearly distinguishable resonant peaks with the smaller FWHM can be obtained by selecting the suitable value of d and h,which means that it is possible to diagnose the afterglow of RF-APGDPJ by DMRP.
2.3. The influence of plasma
In the simulation model,the gap d of 1 mm and the distance h of 2 mm are selected.The ambient medium DMRP immersed is set as a uniform pure helium atmospheric plasma with density neof 1015m–3, 1016m−3, 1017m–3and 1018m–3,respectively. Figures 5(a) and (b) are the reflection spectra and the electric field distributions of the DMRP in the helium atmospheric plasma with different electron density ne. As the increase of plasma electron density ne, the resonant frequencies do not shift,and the electric field strength decreases.Correspondingly,the FWHM of two resonant spectraΔf1and Δf2both increase, which similar to that of the hairpin probe[22]. When the electron density neis less than 1017m–3, the r esponse of the two resonant peaks is significant. And when the electron densitynereachs 1018m-3,the two resonant peaks disappear together.

Figure 7.The reflection spectrum of the DMRP below RF-APGDPJ applicator (without discharge).
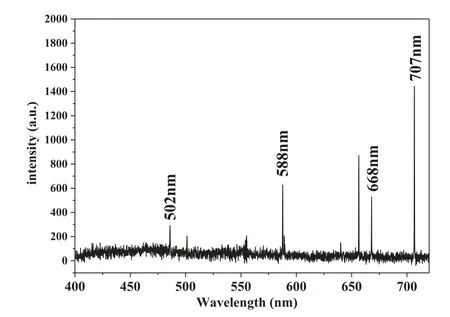
Figure 8.Optical emission spectrum of the RF-APGDPJ operation at the helium flow rate of 25 l min−1.
3. Experiment
3.1. Experimental setup
Figure 6 is a schematic diagram of experimental setup for the plasma diagnostics by DMRP. The hand-made DMRP are made of copper wire with wire diameter a of 1.30 mm. As a hand-made DMRP, there is a small manufacturing error. The width of the probe w is about 3.45–3.55 mm,and the length l is about 21.50–22.10 mm. The RF-APGDPJ is consisted of two perforated circular metal plate electrodes, 50 mm in diameter, containing 151 holes with diameter of 0.75 mm,separated of 2.00 mm.The lower electrode is grounded,while the upper electrode is connected to a rf power supply(Rishige RSG1000) with the frequency of 13.56 MHz via an impedance matching network. The helium gas (99.999%) is fed into the discharge chamber via the gas flow meter (Sevenstar D08-2B) and allowed to flow through the electrodes. The reflection spectra are measured by a vector network analyzer(Rohde&Schwarz ZVL6) at various helium flow rates. The experimental measurements were repeated three times by increasing and then decreasing the power during each discharge processing.
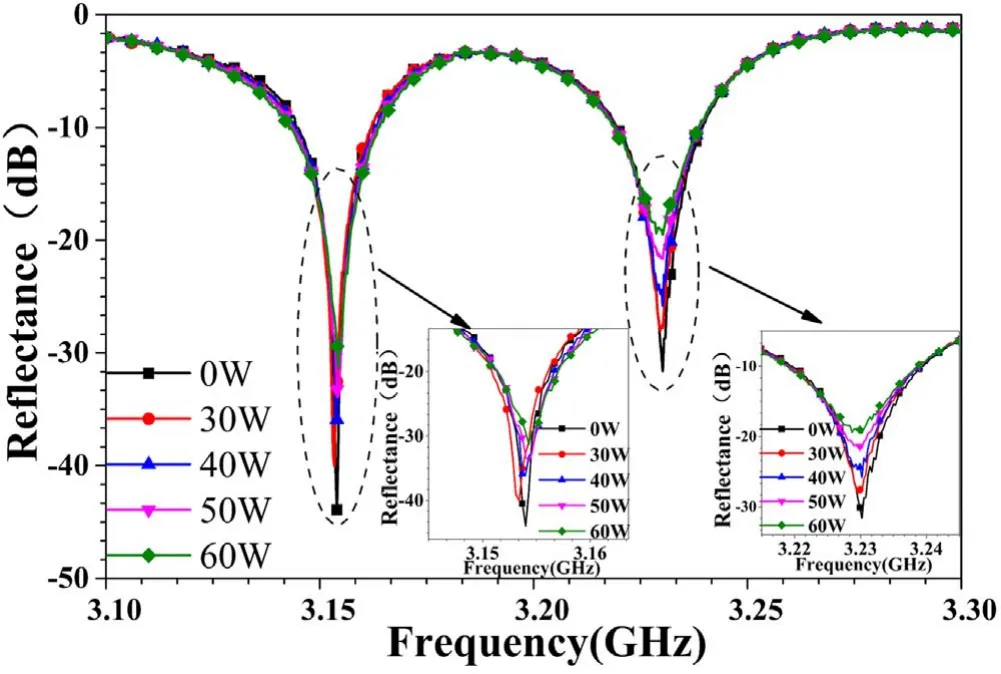
Figure 9.The reflection spectra of the DMRP at deferent rf powers,and helium flow rate is of 25 l min−1.
3.2. Experimental results and discussion
The reflection spectra of the DMRP with gap d of 1 mm at different locations below the RF-APGDPJ applicator is shown in figure 7. As the DMRP approaches the RFAPGDPJ,two resonant peaks in the spectrum shift close each other, and their FWHMΔf1,airandΔf2,airdecrease, which is exactly the same as the simulation result. When the DMRP placed 2 mm below the RF-APGDPJ, two resonant modes with high quality factor appearance at 3.20 GHz (–34.54 dB)and 3.30 GHz (–23.43 dB), respectively.
Figure 8 is the optical emission spectrum of the RFAPGDPJ collected by an optical fiber probe connected to a spectrometer (AvaSpec 2048TEC). The electron temperature of the RF-APGDPJ was estimated to be 0.14 eV according the reference[29],which agrees well with 0.161 eV given by Yan et al [30].
The reflection spectra of the DMRP are measured for RFAPGDPJ operation at different rf powers as the gas flow rate of 25 l min−1, shown in figure 9. The DMRP placed 2 mm below the RF-APGDPJ. As the increase of rf power, the resonant frequencies do not shift,the FWHM of two resonant peaksΔf1andΔf2both increase,which is consistent with the simulation results.
The FWHMΔfof DMRP are sensitive to many parameters such as the horizontal relative position with the applicator, the plasma source type, rf noise, mechanical oscillations and environment temperature, etc. However,except plasma parameters, all of the effects are completely eliminated by subtractingΔfairfromΔfas for a hairpin probe.For a hairpin probe, the electron density necan be estimated by the change of FWHM [22, 23]. In this work, the electron density neis estimated by matching the change of FWHM

[8] Nozaki T et al 2007 Nanotechnology 18 235603
[9] Ichiki T, Taura R and Horiike Y J 2004 J. Appl. Phys. 95 35
[10] Benedikt J et al 2006 Appl. Phys. Lett. 89 251504
[11] Moravej M et al 2004 J. Appl. Phys. 96 7011
[12] Hicks R F et al 2006 SAMPE Fall Technical Conf. Proc.:Global Advances in Materials and Process Engineering(Dallas, Texas, United States)
[13] Moravej M et al 2004 Plasma Sources Sci. Technol. 13 8
[14] Stenzel R L 1976 Rev. Sci. Instrum 47 603
[15] Piejak P B et al 2004 J. Appl. Phys. 95 3785
[16] Haas F A,Al-Kuzee J and Braithwaite N S J 2005 Appl.Phys.Lett. 87 201503
[17] Sands B L,Siefert N S and Ganguly B N 2007 Plasma Sources Sci. Technol. 16 716
[18] Šamara V, Bowden M D and Braithwaite N S J 2012 Plasma Sources Sci. Technol. 21 024011
[19] Sirse N, Karkari S K and Turner M M 2015 Plasma Sources Sci. Technol. 24 022001
[20] Milosavljevic V,Karkari S K and Ellingboe A R 2007 Plasma Sources Sci. Technol. 16 304
[21] Karkari S K et al 2007 J. Appl. Phys. 102 063308
[22] Xu J Z et al 2009 Plasma Sources Sci. Technol. 18 045009
[23] Xu J Z et al 2010 Chin. Phys. B 19 075206
[24] Yan W 2015 Master Donghua Univisity O461.21; O358 (in Chinese)
[25] Zhao B Y et al 2018 J. Donghua Univ. (Nat. Sci.) 44 141 (in Chinese)
[26] COMSOL AB 2012 COMSOL multiphysics user’s guide(version 4.3) Stockholm, Sweden
[27] Bliokh K Y et al 2008 Rev. Mod. Phys. 80 1201
[28] Bliokh K Y et al 2008 Phys. Rev. Lett. 101 133901
[29] Xiong Q et al 2013 Plasma Sources Sci. Technol. 22 015011
[30] Yan W,Xu J Z and Wang J F 2015 Testing and Measurement:Techniques and Applications (Boca Raton, FL: CRC Press)
[31] Yousfi M et al 2012 Plasma Sources Sci. Technol. 21 045003
[32] Tachibana K,Kishimoto Y and Sakai O 2005 J.Appl.Phys.97 123301
[33] Niemi K et al 2011 Plasma Sources Sci. Technol. 20 055005
杂志排行

Plasma Science and Technology的其它文章
- Sensitivity of two drug-resistant bacteria to low-temperature air plasma in catheterassociated urinary tract infections under different environments
- First experimental results of intrinsic torque on EAST
- Gas pressure effect on plasma transport in a magnetic-filtered radio-frequency plasma source
- Design of a variable frequency comb reflectometer system for the ASDEX Upgrade tokamak
- Optimization of plasma-processed air (PPA)inactivation of Escherichia coli in button mushrooms for extending the shelf life by response surface methodology
- Reconstruction of hollow areas in density profiles from frequency swept reflectometry