影响静态箱检测开放式气体排放源N2O排放通量的关键因子
2020-06-04李柯萍李欣瑜王朝元施正香李保明
刘 羽,周 婧,李柯萍,李欣瑜,王朝元,3,施正香,3,李保明,3
·农业生物环境与能源工程·
影响静态箱检测开放式气体排放源N2O排放通量的关键因子
刘 羽1,2,周 婧1,李柯萍1,李欣瑜1,王朝元1,2,3※,施正香1,2,3,李保明1,2,3
(1. 中国农业大学水利与土木工程学院,北京 100083;2. 农业农村部设施农业工程重点实验室,北京 100083;3. 北京市畜禽健康养殖环境工程技术研究中心,北京 100083)
为研究影响静态箱检测开放式气体排放源氧化亚氮(N2O)排放通量的关键因子,以提高静态箱检测气体排放通量的准确性,该文在实验室条件下,探究了箱体配置(有无通气孔、有无风扇)和检测条件(不同密闭时间:30、40、50和60 min;不同排放源表面风速:0、0.5、1.0、1.5和2.0 m/s)对300 mm(直径)×300 mm(高度)(300 mm×300 mm)的静态箱检测N2O排放通量准确性的影响规律。结果表明,不同配置的静态箱测量结果偏差率随时间的变化趋势均相同,其中有通气孔和风扇的箱体在不同风速下的检测稳定性较好,检测准确性最高。当排放源表面风速为0~2 m/s时,风扇对静态箱检测准确性无显著性影响,排放源表面的风主要通过通气孔影响静态箱的检测准确性。静态箱检测的气体排放通量与实际排放通量的偏差率随排放源表面风速和箱体密闭时间的增加而显著降低。该试验推荐在排放源表面风速小于2 m/s的无粪便堆积的奶牛运动场以及排放源介质相似的开放式气体排放系统中使用有通气孔和风扇的静态箱对N2O排放通量进行检测,密闭50 min。
排放控制;环境工程;奶牛运动场;氧化亚氮;排放通量;静态箱法
0 引 言
温室气体(Greenhouse Gases, GHGs)排放超标是造成全球变暖的重要因素,联合国粮食及农业组织(Food and Agriculture Organization of the United Nations,FAO)指出,畜牧业GHGs排放占全球人为GHGs排放的18%[1]。2015年,反刍动物(牛、羊)养殖中GHGs排放占中国畜牧业GHGs排放总量的72.44%,其中养牛业是主要来源[2]。畜牧业GHGs主要来源于畜禽肠道CH4和粪便管理过程中产生的CH4和N2O。以2015年的数据为基础分析中国畜牧业GHGs排放组成,粪便发酵产生的N2O排放不容忽视,其排放量占GHGs排放总量的18%~23%[3],且温室效应是CO2的298倍[4]。
中国奶牛养殖场通常配有舍外露天运动场,是奶牛饮水、休息和自由活动的场地,运动场上残留的粪便量大约为总排粪量的50%[5]。发达国家虽已对奶牛场GHGs排放进行了长期系统的检测[6-7],但由于奶牛养殖模式、设施类型、粪便管理等方面均存在显著差异,其数据无法直接作为中国奶牛场气体排放的参考[8]。目前,广泛应用在开放式系统气体排放检测的方法有静态箱法、示踪气体法和微气象法等[9-14]。示踪气体法和微气象法不会影响被测排放源周围的微环境,是检测气体排放量较为理想的方法[15],但其对环境的稳定性要求较高且操作复杂,实际使用难度大。静态箱法简单、经济、便捷[16-17],因此是现场检测GHGs排放量的首选,运用广泛。
静态箱法虽然应用广泛,但其形成的密闭环境容易受检测表面的小气候环境干扰,且箱体的材料、大小、高度及土壤情况等因素都会带来一定的不确定度[18]。王迎红[19]发现由于静态箱是根据箱内气体浓度随时间的变化率来计算通量值,土壤-大气浓度梯度随时间降低的变化往往被忽略,从而造成静态箱对实际排放通量的低估;Ding等[15]以SF6为示踪气体研究了不同箱体直径和高度的圆筒型静态箱对气体排放通量检测准确性的影响,推荐300 mm(直径)×300 mm(高度)(D300 mm× H300 mm)的静态箱检测准确性最好,并指出有无扰流风扇对静态箱检测准确性没有影响。然而有研究发现使用静态箱检测CH4时,不安装扰流风扇,箱内气体不充分混合会造成排放通量低估;而扰流风扇会改变箱内气体排放源表面的风速场,可能造成气体排放通量的高估[20]。由上可知有无扰流风扇对静态箱检测准确性的影响因气体不同而不同,扰流风扇对静态箱检测N2O的影响还不明确。此外,密闭时间、通气口和排放源风速等也会对静态箱检测性能产生影响。Davidson等[21]研究发现静态箱的检测精度容易受到箱体密闭时间的影响,检测时需要合理地选择密闭时间,并强调所有静态箱应装配适当尺寸的通气孔以平衡封闭环境的空气压力。但是,目前的研究还不能很好的解释各影响因素对静态箱检测精度的具体影响,因此有必要在实验室条件下对相应因素的影响进行系统研究。
本研究在实验室条件下采用静态箱法对开放式奶牛运动场模拟系统的气体排放通量进行检测,研究扰流风扇、通气孔、密闭时间和风速场等4种关键因素对静态箱检测气体排放量准确性的影响及相关规律。以期提高静态箱检测气体排放通量的准确性及其在现场应用的可操作性。
1 材料与方法
1.1 试验设计
本试验选用规格为D300 mm×H300 mm的圆桶静态箱。为探究通气孔和扰流风扇对N2O排放通量检测精度的影响,试验设置了4种不同配置的静态箱,见表1。

表1 静态箱配置
静态箱的主要材料为有机玻璃,包含箱体及箱盖2部分,箱体底部不封口。箱体和盖子间放置橡胶垫圈并用螺栓连接,以保证气密性。4种不同配置的静态箱仅在箱盖上有差异,其中有通气孔和风扇箱体设计如图1,箱盖上设置进气口和出气口,位于箱盖中心的两侧,以连接内径为3 mm的硅胶采样管和特氟龙采样管;箱盖中心上方的位置安装有机玻璃制成的T型通气孔,向下深入箱体20 mm,向上伸出20 mm,顶端向两边分别伸出75 mm,通气孔外径为2 mm;箱盖正中心安装扰流风扇,外径110 mm,由12 V、3 500 r/min的电机带动旋转,转动时箱体底部距底端50 mm处风速为1 m/s,风扇底部距箱盖约150 mm。无通气孔箱体不设置T型通气孔,无风扇箱体不预留箱盖正中心安装孔,其余部分均与有通气孔和风扇箱体一致。
1.2 静态箱检测系统
静态箱检测系统见图2。校准箱由有机玻璃制成,包括箱体和箱盖,箱体直径1 000 mm,高600 mm;为充分混匀箱内的气体,箱体底部中心位置安装一直径120 mm,转速2 700 r/min的混合风扇。箱体侧面在距离箱体底部100 mm设置一直径为3 mm的开口用来连接气罐,在距离箱体底面200 mm处设置一直径为3 mm的开口用来连接气体检测仪。校准箱盖直径1 000 mm,高150 mm;盖面上设置孔径为5 mm的小孔,小孔间距为30 mm,保证气体扩散的均匀性,盖上铺设150 mm厚的石英砂层(孔隙度为35%,密度为2.2 g/cm3),用来模拟真实情况中的气体排放介质[15]。在中国,素土地面是奶牛运动场一种典型的地面类型,土壤密度为2.1 g/cm3,孔隙度约为28%~32%[22],与石英砂相似。

1.静态箱体 2.橡胶垫圈 3.静态箱盖 4.出气孔 5.螺栓孔 6.扰流风扇 7.进气孔 8.T型通气孔
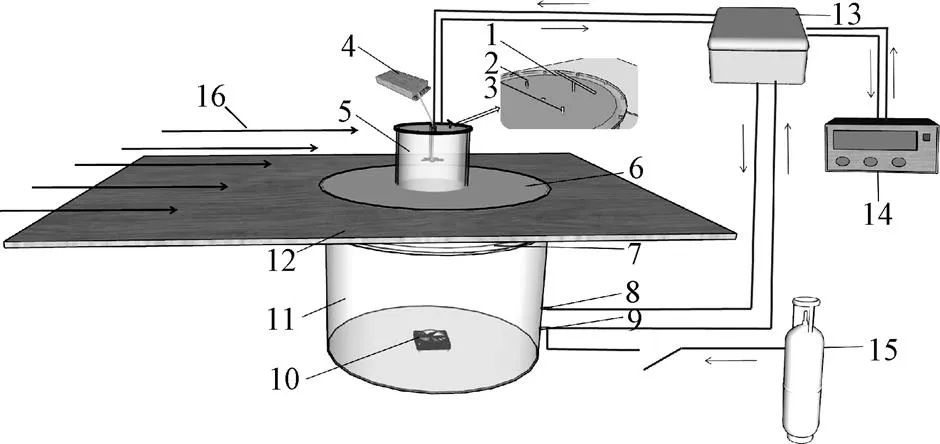
1.T型通气孔 2.静态箱出气孔 3.静态箱进气孔 4.电机 5.静态箱 6.石英砂 7.校准箱盖 8.校准箱进气孔 9.校准箱出气孔 10.混合风扇 11.校准箱 12.试验台 13.多路器 14.气体分析仪 15.气瓶 16.风向
该试验于中国农业大学水利与土木工程学院试验大厅进行,利用实验室的农业通风设备性能检测装置(即“风洞”)进行风速的调节,以模拟真实环境。风洞出风口宽1 650 mm,高1 600 mm,本试验系统设置在出风口外,测试结果表明距出风口1~2 m处风速较稳定,因此将校准箱放置在出风口外1 m处。
1.3 操作方法
为避免人为操作造成对排放源表面的干扰,在第一次试验前,须提前24 h将静态箱插入石英砂50 mm。试验期间箱体不得拔出或移动,每次试验结束后将箱盖缓慢打开排出箱内积累的气体。
试验前,将热线风速仪(KA41L,Kanomax,日本)平架在排放源表面,进行风速测量并记录,调节风洞的风速使其为所需值,使其稳定运行15 min后开始进行试验。试验期间,每隔10 min用热线风速仪对排放源表面风速进行检测,试验过程中保证持续监测。由于现场的地表风速一般在0~2 m/s左右[22],故本试验风速梯度设置为0.0、0.5、1、1.5和2.0 m/s。
试验时释放一定量的气体进入扩散箱使箱内初始N2O气体浓度达到90 mg/m3。缓慢盖上静态箱盖子,拧紧螺丝。用红外光声谱气体检测仪(INNOVA 1412i,LumaSense technologies,美国)对静态箱和校准箱内的气体浓度进行采样测量,采样间隔为10 min,连续监测60 min。试验结束后将箱盖轻轻揭开,释放箱内气体。每组进行5次重复试验。
1.4 气体排放通量的计算方法
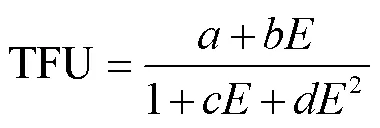
本试验采用二次多项式模型(简称“QR模型”)对N2O排放通量进行计算。式(1)是静态箱内排放通量与时间的关系式:

式中为静态箱内测量所得的N2O气体浓度,mg/m2;为密闭时间,min;,,均为系数,将实际测得的气体浓度和密闭时间反复带入,可求得该系数。
在用二次多项式模型进行拟合分析的情况下,静态箱内气体的排放通量计算公式为

式中为一定时间内气体排放通量,mg/(m2·min);为箱体有效高度,cm。
在不同试验条件下,静态箱体的形状大小、密闭时间以及土壤的基本情况等条件都不尽相同,且均会对试验结果造成影响。根据Venterea[23]的研究,引入理论排放通量低估率(Theoretical Flux Underestimation, TFU),在此条件下,静态箱实际排放通量0与静态箱计算排放通量的关系为

式中0为修正后的一定时间内气体排放通量,mg/(m2·min);TFU的值与静态箱的有效高度、试验时的密闭时间及能够代表土壤状态的具体参数(如总孔隙度、体积含水量、土壤孔径分布参数等)有关,为无量纲。
式中,,,为描述理论排放通量低估值与误差参数之间关系的回归系数,=26.857 5,=−3.566 6,=0.281 4,=0.047 1;为关于静态箱体有效高度及试验时密闭时间的系数:

式中为土壤总孔隙度,%;为体积含水率,%;为pH值修正因子,本试验中采用N2O气体,取值为1;为微量气体亨利定律气液分配系数;为空气中微量气体差异系数,cm2/h;为土壤的孔径分布参数,一般采用=13.6CF+3.5来估算,CF为土壤中黏土的比例,(0 校准箱内气体排放通量计算方法[24]为 式中c为校准箱气体排放通量,mg/(m2·min);c为校准箱体积,m3;s为石英砂空隙的体积,m3;c为校准箱排放源面积,m2;c为一定时间内校准箱气体浓度变化量,mg/m3;Δc为采样时间间隔,min。校准箱中测得的N2O排放通量视为N2O排放通量真实值。 数据分析时去掉5次重复中的最大值和最小值,剩余3个有效数取平均值。试验数据通过EXCEL 2016进行整理,并采用SPSS 21.0统计分析软件分析。 图3反映了不同配置的静态箱在不同排放源表面风速和密闭时间下对N2O排放通量检测的准确性,由图3可知4种不同配置的静态箱在不同风速下检测N2O的准确性变化趋势均相同。在试验初期,箱体密闭时间较短,检测气体的排放通量高于真实值。这主要是因为刚盖上箱盖时会在很大程度上影响排放源表面气体混合的过程[25],导致箱体有效高度的增加,造成在短时间内密闭箱体内气体排放通量的高估[26]。当气体持续排放,箱体内的气体浓度达到一定值时,会显著降低N2O的扩散和流动,从而导致气体的低估[27]。因此使用静态箱法检测气体排放通量结果一般会先高于真实值,再低于真实值。 图3 静态箱检测N2O排放通量偏差率随排放源表面风速和密闭时间的变化 由图3可知不同配置的静态箱在密闭50 min时检测N2O排放通量的准确性较高。且有通气孔和风扇的箱体在密闭时间为50 min时对N2O的检测准确度最高,比万云帆等[28]推荐的密闭15~30 min要长,这是由于本试验所选用的静态箱有通气孔来平衡箱体内外的气压,延长了静态箱的检测时长[22]。 表2反映了不同配置的静态箱密闭50 min检测N2O排放通量的准确性受排放源表面风速的影响。在0~2 m/s风速下,无通气孔和风扇静态箱、有通气孔无风扇静态箱、无通气孔有风扇静态箱及有通气孔和风扇静态箱的检测偏差率分别为1.02%~−29.06%、12.29%~−47.92%、−9.71%~−40.92%和4.42%~−25.64%。无通气孔和风扇静态箱在排放源表面风速为0的情况下测得的N2O排放通量的准确性显著高于其他风速条件下的结果(<0.05),其他风速下测得的结果之间无显著差异(>0.05)。Bain等[27]在用静态箱法测定气体排放量时,土壤气体的排放通量会随着外界环境风压的增高而增大。无通气孔和风扇静态箱在没有任何调控内环境措施的条件下,箱内气体排放通量受排放源风速的影响小,箱外气体排放通量随风速的增大而增大,从而使该静态箱随着风速的增加越来越低估N2O的排放通量。有通气孔无风扇静态箱在排放源表面风速为1.5和2.0 m/s条件下测得的N2O排放通量的准确性显著低于其他3个风速条件下的结果(<0.05)。通气孔通过平衡箱体内外的压差来改善箱体的检测性能,当外界风速通过通气孔产生文丘里效应,使箱内的气体不断逸出[27],静态箱下部气体向上补充,并加快校准箱气体排入静态箱,从而使静态箱检测结果出现高估。但随着风速的增大,气体从静态箱更快地逸出,重复上述过程,并随着检测时间的增长,静态箱和校准箱之间的气体浓度差越来越小,校准箱进入静态箱的气体减少,但静态箱的逸出过程仍在继续,静态箱内气体浓度降低,从而使静态箱的检测结果出现低估,并随着风速的提高而增大。Hutchinson等[25]表明,当环境中的温度、气压以及箱体体积不变的时候,由于气体扩散使从通气孔泄漏的气体通量小于总通量的0.04%,但在外界有风的情况下则会由于气压的变化而导致泄漏气体通量大幅度增加。除表面风速为2.0 m/s的情况,有通气孔和风扇静态箱在其他各个风速条件下的检测N2O排放通量偏差率均无显著差异(>0.05),说明该箱体的检测稳定性较好。且有通气孔和风扇静态箱的检测准确性显著高于无通气孔有风扇静态箱(<0.05)。扰流风扇的使用会加快静态箱内气体的均匀混合,提高静态箱的检测准确性,并缩短检测时间[22]。Christiansen等[20]发现扰流风扇的风速不改变气体从排放源扩散的流速,但无扰流风扇的箱体会造成36%的低估。 表2 不同配置静态箱密闭50 min时不同排放源表面风速下的偏差率 注:同一静态箱中不同小写字母表示不同排放源表面风速下偏差率在0.05 水平差异显著。 Note: Different letters in same closed chamber indicate there are significant differences at 0.05 level among deviation rates under different emission surface wind speeds. 表3为密闭时间及排放源表面风速对偏差率的主效应分析以及2个影响因素之间的交互性分析,其中密闭时长为0~60 min,排放源表面风速为0~2 m/s。排放源表面风速和密闭时间是影响偏差率的主效应,且效应显著(<0.05),排放源表面风速和密闭时间的交互作用对静态箱检测N2O排放通量准确性的影响不显著(>0.05)。 表3 密闭时间及排放源表面风速对静态箱检测准确性的主效应分析 密闭时间会影响箱体内部的微环境,从而对检测性能造成影响。研究表明,密闭时间受静态箱配置的影响[29-30],如箱体的有效高度、有无风扇和通气孔的配置等[27]。排放源表面风会影响插入排放源的箱体底部表面气体的流动和进出。有风的情况下,排放源中的N2O会被逸出,导致排放源的气体浓度变低,特别是当排放源的湿度较低时[22]。而本试验采用的是湿度较低的石英砂,因此更易受到风速的影响。 根据密闭时间和排放源表面风速对静态箱检测偏差率影响的相关性分析可知密闭时间与静态箱检测偏差率显著负相关(<0.05),随着静态箱密闭时间的增加,静态箱检测气体排放通量的偏差率减小,与前人研究结论一致[22]。排放源表面风速与检测偏差率也呈显著负相关(<0.05),但有研究表明该因素与无通气孔静态箱的检测性能无相关性[22],与本文结论相反,这说明排放源表面风速主要通过通气孔来影响静态箱的检测性能。 通过以上不同箱体在不同试验条件下的检测结果分析,本试验推荐使用有通气孔和风扇的静态箱对N2O排放通量进行检测,密闭时间为50 min,排放源表面风速小于2 m/s。牛粪是一种复杂的多孔介质,新鲜牛粪的湿度可达84%[31]。奶牛运动场部分区域由于牛粪的堆积,孔隙度和湿度均比试验用石英砂高。高孔隙度会增大表面风速对排放源的影响,使静态箱检测气体排放通量的低估率增加[32];而高湿度可以减少箱体内正压的影响,从而减小静态箱的低估率[33]。牛粪特性对静态箱检测奶牛运动场气体排放通量准确性的影响还需要进一步研究。 通过在实验室模拟奶牛场开放式气体排放源,研究了静态箱配置、箱体密闭时间以及排放源表面风速对静态箱检测N2O排放通量准确性的影响。主要得出以下结论: 1)不同配置的箱体测量结果偏差率随时间的变化趋势均相同,其中有通气孔和风扇的箱体在不同风速下的检测稳定性较好,检测准确性最高。 2)当排放源表面风速为0~2 m/s时,风扇对静态箱检测准确性无显著性影响,风速主要通过通气孔来影响静态箱的检测准确性。 3)静态箱检测的气体排放通量与实际排放通量的偏差率随排放源表面风速和箱体密闭时间的增加而降低。 4)推荐在无粪便堆积的奶牛运动场以及排放源介质相似的开放式气体排放系统中使用300 mm×300 mm有通气孔和风扇的静态箱对N2O排放通量进行检测,排放源表面风速小于2 m/s时,密闭时间为50 min。 [1] Steinfeld H, Gerber P, Wassenaar T, et al. Livestock’s long shadow[M]. Rome, Italy: FAO, 2006: 97-110. [2] 郭娇,齐德生,张妮娅,等. 中国畜牧业温室气体排放现状及峰值预测[J]. 农业环境科学学报,2017,36(10):2106-2113. ,i,hang,. Chinese greenhouse gas emissions from livestock: Trend and predicted peak value[J]. Journal of Agro-Environment Science, 2017, 36(10): 2106-2113. (in Chinese with English abstract) [3] IPCC. In climate change 2013: The Physical Science Basis[M]. New York: Contribution of Working Group I. Cambridge University Press, 2013. [4] Portmann R W, Daniel J S, Ravishankara A R. Stratospheric ozone depletion due to nitrous oxide: Influences of other gases[J]. Philosophical Transactions of the Royal Society, 2012, 367: 1256-1264. [5] 袁慧军,高志岭,马文奇,等. 应用反演式气体扩散技术测定奶牛场甲烷的排放特征[J]. 农业环境科学学报,2011,30(4):746-752. Yuan Huijun, Gao Zhiling, Ma Wenqi, et al. Determination of methane emissions from a dairy feedlot using an inverse dispersion technique[J]. Journal of Agro-Environment Science, 2011, 30(4): 746-752. (in Chinese with English abstract) [6] Leytem A B, Dungan R S, Bjorneberg D L, et al. Emissions of ammonia, methane, carbon dioxide, and nitrous oxide from dairy cattle housing and manure management systems[J]. Journal of Environment Quality, 2011, 40(5): 1383-1394. [7] Borhan M S, Capareda C S, Mukhtar S, et al. Greenhouse gas emissions from ground level area sources in dairy and cattle feed yard operations[J]. Atmosphere, 2011, 2: 303-329. [8] 刘羽,刘婕,王朝元,等. 规模奶牛养殖室外运动场春季温室气体与氨气排放特性[J]. 农业工程学报,2018,34(22):178-184. Liu Yu, Liu Jie, Wang Chaoyuan, et al. Emission characteristic of greenhouse gases and ammonia from open lot of scale dairy farm in spring[J]. Transactions of the Chinese Society of Agricultural Engineering (Transactions of the CSAE), 2018, 34(22): 178-184. (in Chinese with English abstract) [9] Laubach J, Bai M, Pinares-Patino C S, et al. Accuracy of micrometeorological techniques for detecting a change in methane emissions from a herd of cattle[J]. Agricultural and Forest Meteorology, 2013, 17(6): 50-63. [10] Lovanh N, Warren J, and Sistani K. Determination of ammonia and greenhouse gas emissions from land application of swine slurry: A comparison of three application methods[J]. Bioresource Technology, 2010, 101(6): 1662-1667. [11] McGinn S M, Turner D, Tomkins N, et al. Methane emissions from grazing cattle using point-source dispersion[J]. Journal of Environmental Quality, 2011, 40(1): 22-27. [12] Misselbrook T H, Webb J, Chadwick D R, et al. Gaseous emissions from outdoor concrete yards used by livestock[J]. Atmospheric Environment, 2001, 35(31): 5331-5338. [13] Spiehs M J, Whitney M H, et al. Oder and gas missions and nutrient excretion from pigs fed diets containing dried distiller grains with soluble[J]. Applied Engineering in Agriculture, 2012, 28(3): 431-437. [14] Uggetti E, García J, Lind S E, et al. Quantification of greenhouse gas emissions from sludge treatment we[J]. Water Resource, 2012, 46(6): 1755-1762. [15] Ding L Y, Wang C Y, Lu Q K, et al. Effects of configuration and headspace mixing on the accuracy of flux chambers for dairy farm gas emission measurement[J]. Applied Engineering in Agriculture, 2015, 31(1): 153-162. [16] Blackmer A M, and Bremner J M. Gas chromatographic analysis of soil atmospheres[J]. Soil Science Society of America Journal, 1977, 41(5): 908-912. [17] Jukka P, Pasi K, Hannu I, et al. Comparison of different chamber techniques for measuring soil CO2efflux[J]. Agricultural and Forest Meteorology, 2004, 123(3): 159-176. [18] Denmead O T. Approaches to measuring fluxes of methane and nitrous oxide between landscapes and the atmosphere[J]. Plant and Soil, 2008, 309(1/2): 5-24. [19] 王迎红. 陆地生态系统温室气体排放观测方法研究、应用及结果比对分析[D]. 北京:中国科学院,2005. Wang Yinghong. Chamber Method Measurement of Greenhouse Gas Emissions from Typical Terrestrial Ecosystems of China: Method Research, Application and Results Discussion[D]. Beijing: Chinese Academy of Science, 2005. (in Chinese with English abstract) [20] Christiansen J R, Korhonen J F, Juszczak R, et al. Assessing the effects of chamber placement, manual sampling and headspace mixing on CH4fluxes in a laboratory experiment[J]. Plant Soil, 2011, 343(1/2): 171-185. [21] Davidson E A, Savagea K, Verchot L V, et al. Minimizing artifacts and biases in chamber-based measurements of soil respiration[J]. Agricultural and Forest Meteorology, 2002, 113: 21-37. [22] Liu Y, Wang C Y, Ding L Y, et al. Influence of deployment time and surface wind speed on the accuracy of measurements of greenhouse gas fluxes using a closed chamber method under low surface wind speed[J]. Journal of the Air & Waste Management Association, 2018, 69(2): 1-11. [23] Venterea R T. Simplified method for quantifying theoretical underestimation of chamber-based trace gas fluxes[J].Journal of Environmental Quality, 2010, 39(1), 126-135. [24] Butterbach-Bahl K, Kiese R, and Liu C Y. Measurements of biosphere-atmosphere exchange of CH4in terrestrial ecosystems[J]. Methods in Enzymology, 2011, 495: 271-287. [25] Hutchinson G L, Livingston G P, Healy R W, et al. Chamber measurements of surface-atmosphere trace gas exchange: Numerical evaluation of dependence of soil, interfacial layer, and source/sink properties[J]. Journal of Geophysical Research-Atmospheres, 2000, 105: 8865-8875. [26] Rachhpal S J, Black T A, Nesic Z, et al. Using automated non-steady-state chamber systems for making continuous long-term measurements of soil CO2efflux in forest ecosystems[J]. Agricultural and Forest Meteorology, 2012, 161: 57-65. [27] Bain W G, Hutyra L, Patterson D C, et al. Wind-induced error in the measurement of soil respiration using closed dynamic chambers[J]. Agricultural and Forest Meteorology, 2005, 131: 225-232. [28] 万运帆,李玉娥,林而达,等. 静态箱法测定旱地农田温室气体时密闭时间的研究[J]. 中国农业气象,2006,27(2):122-124. Wan Yunfan, Li Yu’e, Lin Erda, et al. Studies on closing time in measuring greenhouse gas emission from dry cropland by static chamber method[J]. Chinese Journal of Agrometeorology, 2006, 27(2): 122-124. (in Chinese with English abstract) [29] Reichman R, and Rolston D E. Design and performance of a dynamic gas flux chamber[J]. Journal of Environmental Quality, 2002, 31: 1774-1781. [30] Gao F, Yates S R. Simulation of enclosure-based methods for measuring gas emissions from soil to the atmosphere[J]. Journal of Geophysical Research, 1998, 103: 26127-26136. [31] Ding L, Lu Q K, Wang C Y, et al. Effects of configuration and headspace mixing on the accuracy of flux chambers for dairy farm gas emission measurement[J]. Applied Engineering in Agriculture, 2015, 31(1): 153-162. [32] Lai D Y F, Roulet N T, Humphreys E R, et al. The effect of atmospheric turbulence and chamber deployment period on autochamber CO2and CH4flux measurements in an ombrotrophic peatland[J]. Biogeosciences Discussions, 2012, 9(2): 1439-1482. [33] Lund C P, Riley W J, Pierce L L, et al. The effects of chamber pressurization on soil-surface CO2flux, and the implications for NEE measurements under elevated CO2[J]. Global Change Biology, 1999, 5: 269-281. Key factors affecting the measurement of N2O emission from dairy farm using static-chamber method Liu Yu1,2, Zhou Jing1, Li Keping1, Li Xinyu1, Wang Chaoyuan1,2,3※, Shi Zhengxiang1,2,3, Li Baoming1,2,3 (1.100083,; 2.100083,; 3.100083,) Open gas emission sources, such as open dairy lot and manure stockpile, are still challenge to directly measure the gas emissions, due to their fully open nature and the relatively low flux of gas emission, particularly interfering by other emissions sources, such as barns and animals. The detection accuracy of the commonly used closed-chamber method depends on the chamber configuration and the different external environment. Four key parameters were evaluated, including the disturbing fan, vent holes, surface wind speed of emission (0.0, 0.5, 1.0, 1.5, and 2.0 m/s) and deployment time (0 to 60 min) in the 300 mm (diameter) × 300 mm (height) (300×300) closed chamber using nitrous oxide (N2O) as reference gas. The experiment was carried out in a wind tunnel to adjust the wind speed in order to simulate the real environment of open dairy lots. A calibration system was designed to generate a reference flux, and the accuracy of chamber performance was defined based on the difference between the reference fluxes and the calculated fluxes in the closed chamber. The results showed that the deviation rates have the similar trends during the deployment time in the closed chambers with different configurations. The flux of gas emission that measured by the closed chamber was higher at the beginning of process, and then lower compared with that of the reference flux. The measurement accuracy of the closed chamber reached the maximum when the deployment time was 50 min, where the deviation rate of the closed chamber without the disturbing fan and vent was 1.02%-−29.06%, 12.29%-−47.92% without the disturbing fan and with the vent, −9.71%-−40.92% with the disturbing fan and without the vent, and 4.42%-−25.64% with the disturbing fan and vent. There was no significant difference in the deviation rates of the detected N2O emission fluxes under different wind speeds (>0.05) using the closed chamber with the disturbing fan and with/without vent, indicating these two types of chambers have better detection stability. However, the measurement accuracy of the D300 mm×H300 mm closed chamber with the disturbing fan and vent was significantly higher than that with the fan and without vent (<0.05). When the emission speed of surface wind was 0-2 m/s, the disturbing fan had no significant influence on the measurement accuracy of the closed chamber (>0.05), indicating the emission surface wind was affected by the Venturi effect through the vent. Both the deployment time and emission surface wind speed had significant negative correlation on the deviation rate of the closed chambers (<0.05). However, the correlation between the deployment time and emission surface wind speed was not obvious (>0.05). This study recommends to use a D300 mm×H300 mm closed chamber with the disturbing fan and vent to detect the N2O emission flux in an open gas emission system, such as dairy open lots without manure and emission sources with similar media, with the speed of emission surface wind less than 2 m/s, and the deployment time of 50 min. emission control; environmental engineering; dairy open lot; nitrogen oxide; emission flux; closed chamber method 10.11975/j.issn.1002-6819.2020.08.022 S815.4 A 1002-6819(2020)-08-0182-06 刘羽,周婧,李柯萍,等. 影响静态箱检测开放式气体排放源N2O排放通量的关键因子[J]. 农业工程学报,2020,36(8):182-187.doi:10.11975/j.issn.1002-6819.2020.08.022 http://www.tcsae.org Liu Yu, Zhou Jing, Li Keping, et al. Key factors affecting the measurement of N2O emission from dairy farm using static-chamber method[J]. Transactions of the Chinese Society of Agricultural Engineering (Transactions of the CSAE), 2020, 36(8): 182-187. (in Chinese with English abstract) doi:10.11975/j.issn.1002-6819.2020.08.022 http://www.tcsae.org 2019-12-29 2020-03-07 国家自然科学基金(31472132);北京市大学生创新创业训练计划(2018bj102);国家奶牛产业技术体系(CARS-36) 刘羽,博士生,研究方向为设施畜禽养殖环境与控制。Email:xiaohaizhibei@cau.edu.cn 王朝元,教授,博士生导师,研究方向为设施畜禽养殖过程控制与环境。Email:gotowchy@cau.edu.cn 中国农业工程学会高级会员:王朝元(E041200616S)
1.5 数据分析
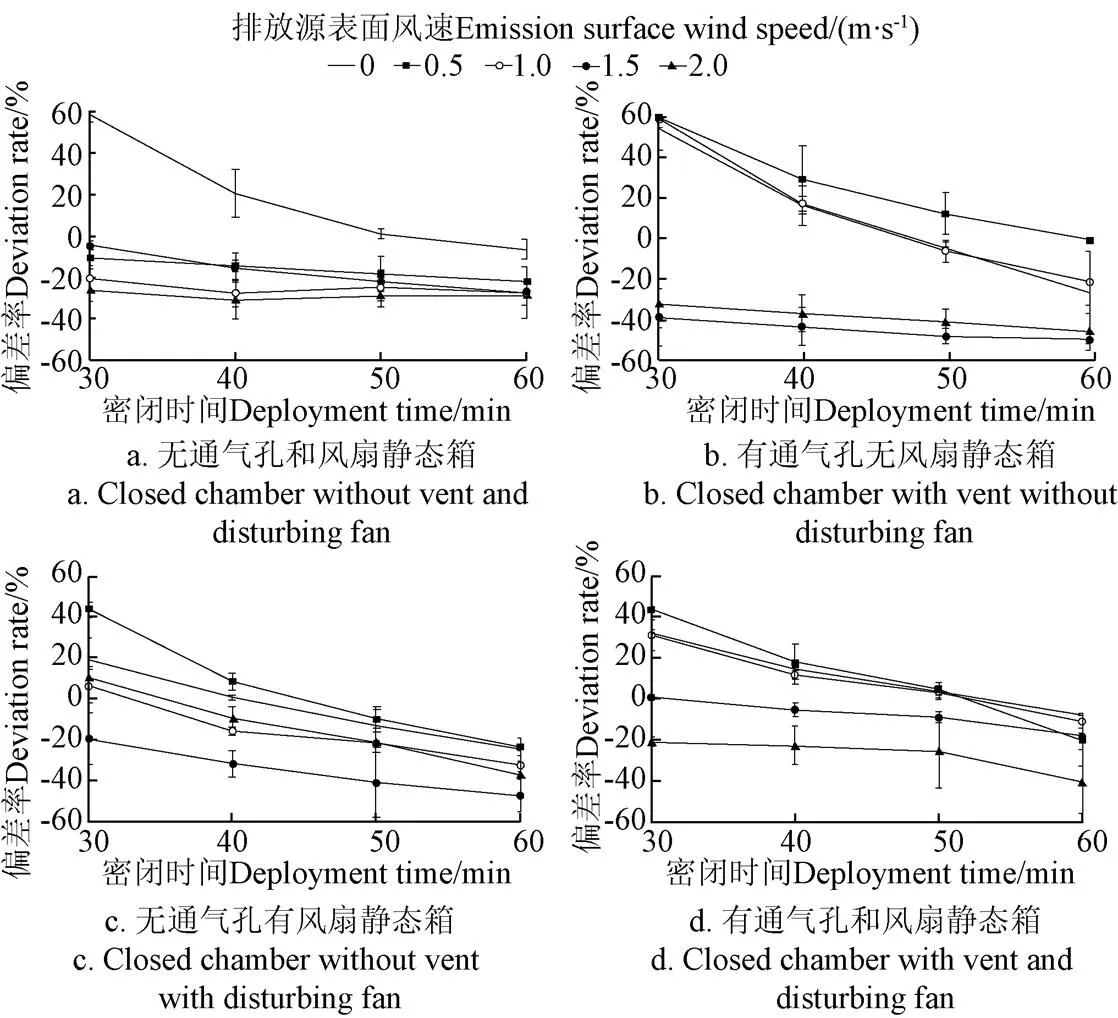
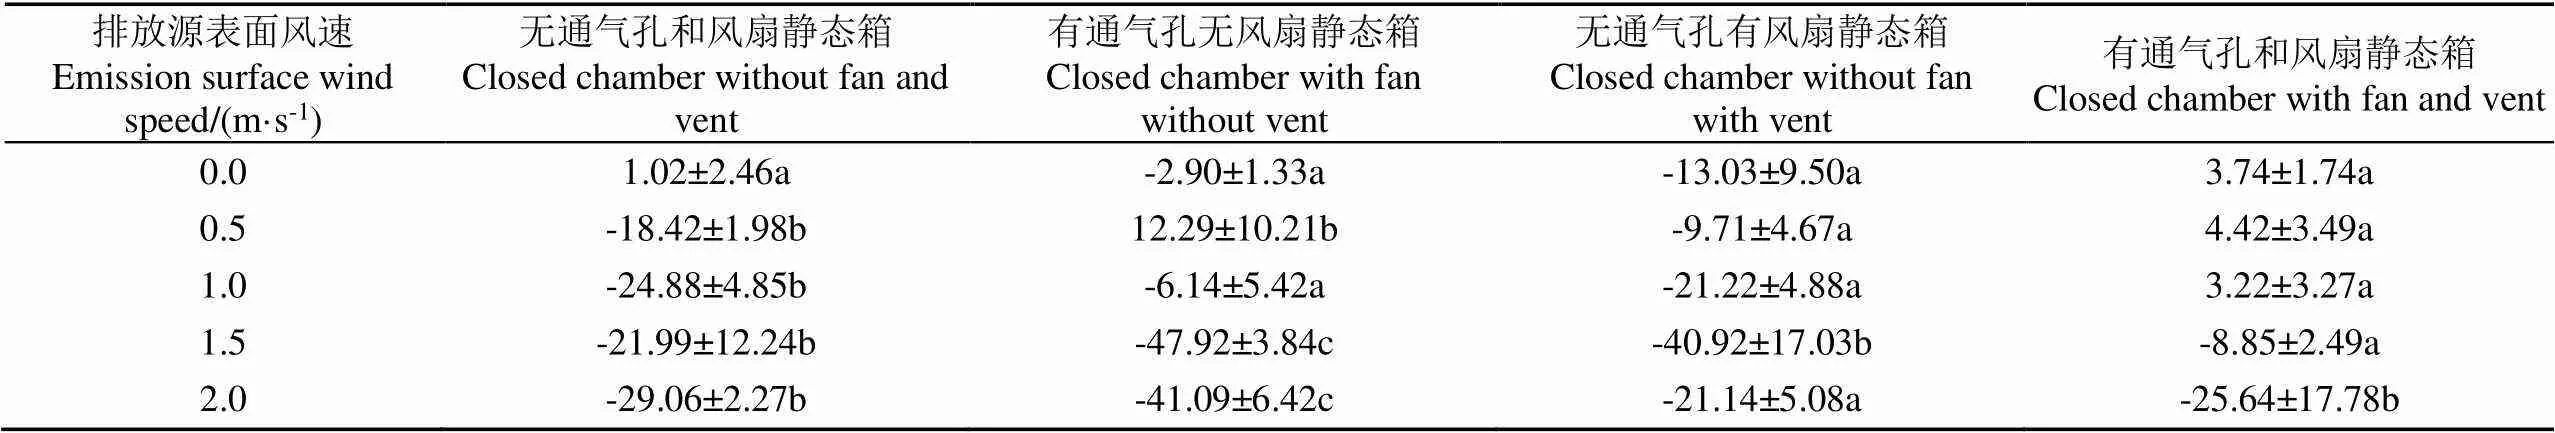
2 结果与分析
2.1 不同配置对箱体性能的影响
2.2 风速对箱体性能的影响
2.3 密闭时间与表面风速对静态箱检测气体排放通量准确度的影响

3 结 论