Continuous compositional spread investigation of SiC-based thin films prepared by MW-ECR plasma enhanced magnetron co-sputtering
2020-04-24HanghangWANG王行行LiyanZHANG张丽艳WenqiLU陆文琪andJunXU徐军
Hanghang WANG (王行行),Liyan ZHANG (张丽艳),Wenqi LU (陆文琪) and Jun XU (徐军)
1 Key Laboratory of Materials Modification by Laser,Ion and Electron Beams,Ministry of Education,School of Physics,Dalian University of Technology,Dalian 116024,People’s Republic of China
2 School of Chemical Engineering,Dalian University of Technology,Dalian 116024,People’s Republic of China
Abstract
Keywords:continuous compositional spread method,silicon carbide,optical band gap,magnetron sputtering,Raman and IR spectra
1.Introduction
Due to its excellent physical and chemical properties,silicon carbide(SiC)has been or is being widely used in most hi-tech fields such as aerospace,aviation,military,and nuclear power[1–4].The key properties of SiC include high melting point,high thermal conductivity,high hardness,resistance against corrosion and wear,low thermal expansion and semiconducting nature.The properties such as optical band gap of SixCythin films are strongly dependent on the Si−C bond density,and the formation of Si−C bonds is directly related to the composition of SixCythin films.
The composition change of SixCythin films not only determines the optical bang gap,but also determines other properties such as carrier density,conductivity and induced spin polarization,all these properties depend on the structure,which in turn depends on the composition.The change of the carbon content y of SixCythin films results in variations of its structure and leads to a complex relationship between the properties and compositions [5–7].In order to shed light on this relationship,SixCythin films with different compositions have been deposited by a variety of techniques,such as plasma enhanced chemical vapor deposition,radio frequency(RF) sputtering,pulsed laser deposition,ion implantation,direct current reactive magnetron sputtering [6–10].Among various methods,the magnetron sputtering appears to be very attractive due to its relative simplicity,high deposition rates and wide application in industry [11].Furthermore,magnetron sputtering technique can simplify the investigation of the relationship between the properties and compositions by depositing hydrogen-free SixCythin films.The compositions of hydrogen-free SixCythin films deposited by magnetron sputtering techniques can be changed by controlling the power of target,area ratio of silicon to graphite sections of a composite target and even the driving frequency of RF power supply [11–17].In the present study,continuous compositional spread method,a kind of combinatorial material methodology,has been used to deposit SixCythin films with different compositions by controlling deposition position.Compared with the conventional magnetron sputtering methods,the major advantage of the continuous compositional spread method is that a range of SixCythin films with different compositions can be prepared in a single deposition and the optimal parameters can be obtained quickly [18,19].
In this paper,the continuous compositional spread method is employed to investigate the relationship of optical band gap and compositions.The compositions of the thin films are changed by controlling the deposition position.The present work is focused on the variation of the composition with deposition position and the influence of compositions on chemical structure and the optical band gap of SixCythin films.
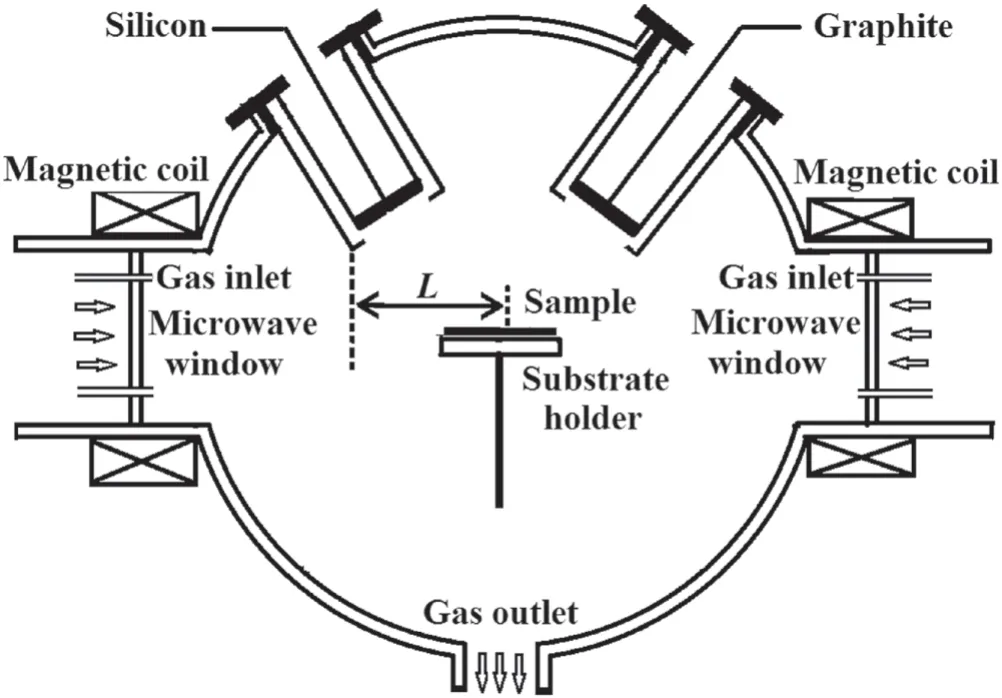
Figure 1.The schematic diagram of co-sputtering system.
2.Experimental details
The SixCythin films were deposited by Microwave Electron Cyclotron Resonance plasma enhanced RF (13.56 MHz)magnetron co-sputtering;the deposition system schematic is illustrated in figure 1.A horizontal deposition distance L is defined as the horizontal distance of sample to the left side of silicon target,as shown in figure 1.Both the angles between the targets and the substrates are 37°.The distance between the center of silicon target and substrate changes from 128.2 to 180.6 mm with the L changing from 85 to 175 mm,while the distance between the center of graphite target and substrate changes from 180.6 to 128.2 mm with L changing from 85 to 175 mm.The left silicon (diameter:68 mm,purity:99.999%) and the right graphite (68 mm,99.999%) magnetron targets were sputtered singly or simultaneously:(1) for silicon thin films,only the silicon target was sputtered and the RF power of target was set to 150 W;(2) for carbon thin films,only the graphite target was sputtered and the RF power of target was set to 500 W;(3) for SixCythin films,the two targets were sputtered simultaneously and the RF power of silicon and graphite targets was set to 150 W and 500 W,respectively.For all of the sputtering process described above,a microwave plasma source was set as 250 W to get high plasma density near the substrate and maintain discharge during sputtering process [20].Before introducing the sputtering argon gas (99.999%),the system was pumped to a pressure of 2.6×10⁻³Pa,and then the sputtering pressure was set as 0.22 Pa.The flow rate of the argon gas was kept constant at 20 sccm.All thin films were deposited on square Si and glass substrates,10 mm on a side,at room temperature for different characterizations:Si substrates deposited for 120 min were used for deposition rate,composition and chemical structure measurement,and the glass substrates deposited for 20 min were used for transmittance measurement.
The film thickness was measured by Dektak 6M surface profiler.The infrared absorption spectra of the SixCythin films were measured by Nicolet 6700 FTIR in the wavenumber range of 400–4000 cm−1with a spectral resolution of 4 cm−1.The Raman spectra were measured by Renishaw inVia instrument and a 532 nm line of a 10 mW laser as the exciting source.The Raman spectra range was 200–2000 cm−1and corrected by deducting the background signal.The optical transmittance of the films was investigated by a DH-2000-BAL type ultraviolet–visible spectrophotometer.The compositions were analyzed by ESCALABTM250Xi x-ray photoelectron spectrometer.
3.Results and discussion
Silicon (Si),carbon (C) and SixCythin films have been deposited on Si substrates,respectively.The deposition rate of these thin films is plotted as a function of horizontal deposition distance L in figure 2(a).It can be seen that the deposition rate of Si films decreases almost linearly with the increasing L.In contrast,the deposition rate of C films increases almost linearly with L.Similar results have been reported in [21,22].The co-sputtering of the silicon and graphite targets leads to the deposition rate of SixCyfilms as shown in figure 2(a),firstly decreases and then increases with the increasing L.Thus,we can expect that the compositions of the SixCythin films should gradually vary with L.In order to verify the expected result,the compositions of the SixCythin films obtained from x-ray photoelectron spectroscopy (XPS)measurements are plotted as a function of L in figure 2(b).It is clear that the carbon content increases linearly from 0.28 to 0.72 with the deposition position changed from 85 to 175 mm,and the stoichiometric SiC thin film could be found at the cross point of two dot lines shown in figure 2(b)with L value of 130 mm.The SixCythin film composition changes from C poor to C rich with increasing y.Due to a nearly linear relation between L and y,L can be used as a reference for the carbon content of the SixCythin films.
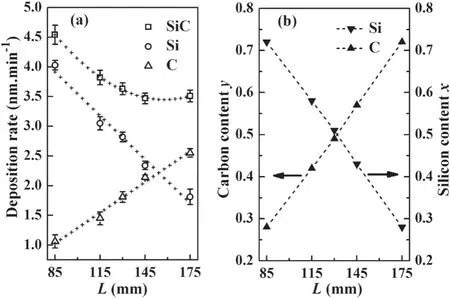
Figure 2.(a)The deposition rates of the thin films as a function of L,(b) the element content of the SixCy thin films as a function of L.
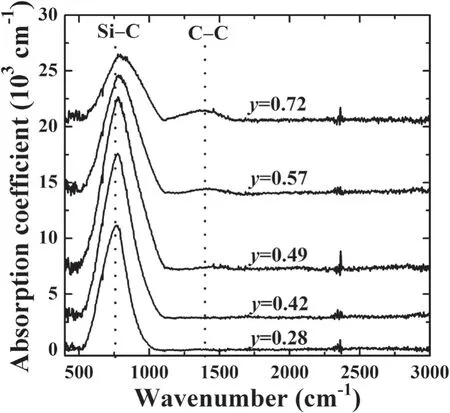
Figure 3.The infrared absorption spectra of the SixCy films with increasing y.
The infrared absorption spectra of the SixCythin films with increasing carbon content y are shown in figure 3.The spectra exhibit one main absorption band centered around 790 cm−1,which is assigned to vibrational modes of Si−C[8],while the weak band around 1400 cm−1appeared when y value is larger than 0.49 might due to sp2C−C bonds [12,23].
The Si−C bond density NSi−Ccan be calculated from the following formula based on the peak area of Si−C stretching mode [17]:
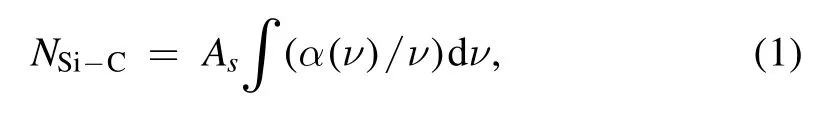
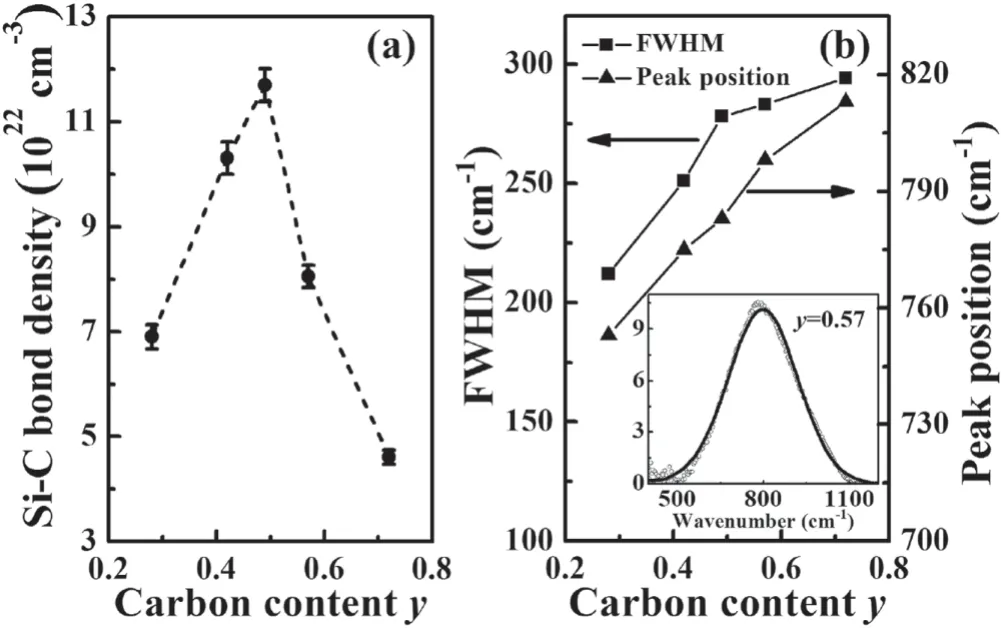
Figure 4.(a)The Si−C bond densities vary with increasing y,(b)the FWHM and peak position of Si−C bands vary with increasing y.The inset is a typical fitting result of the Si−C band.
where As=2.13×1019cm−2is the conversion factor of Si–C stretching bond,ν is the wavenumber and α(ν) is the absorption coefficient.
The Si−C bond density of the SixCythin films varying with increasing y is plotted in figure 4(a).Figure 4(a) shows that the Si−C bond density increases firstly and then decreases with increasing carbon content y.For y<0.5,C poor composition regime,the Si−Si bonds are replaced by Si−C bonds with increasing y;whereas for y>0.5,C rich regime,the Si−C bonds are replaced by C−C bonds with increasing y [6].The cross point of two regimes leads to a maximum Si−C bond density of 11.7×1022cm−3appearing at y=0.49.
The full width at half maximum (FWHM) and peak position of the Si−C bands varying with increasing y are plotted in figure 4(b).Both the FWHM and peak position were obtained from the peak fitting with a Gaussian function.A typical fitting result of the Si−C band with y=0.57 is given in the inset of figure 4(b).The experimental and fitted results are plotted by circle and solid lines,respectively.Figure 4(b)shows that the Si−C peak FWHM increases from 212 to 294 cm−1and peak position increases from 753 to 813 cm−1with increasing y.The increase of FWHM indicates that the degree of disorder for the SixCythin films increases with increasing carbon content y [16].The increase of peak position is due to the higher electronegativity of carbon respect to the substituted silicon atoms [24].
The Raman spectrum of the SixCythin films is shown in figure 5.The spectra exhibit three main bands located at 260–590 cm−1,590–1050 cm−1and 1100–1750 cm−1,respectively.The band centered around 468 cm−1is due to Si−Si bonds and the band centered around 800 cm−1is attributed to Si−C bonds [17,25].The last band centered around 1450 cm−1is due to the C−C bond [17,24,25].The C−C band is probably a result of intimately mixed diamondlike sp3and graphite-like sp2bonds in deposited films[9,25].The decrease of Si−Si bands intensity and the increase of C−C bands intensity indicate that the C atoms replace the Si atoms in the SixCynetwork with increasing y.This result agrees well with the infrared result discussed above.
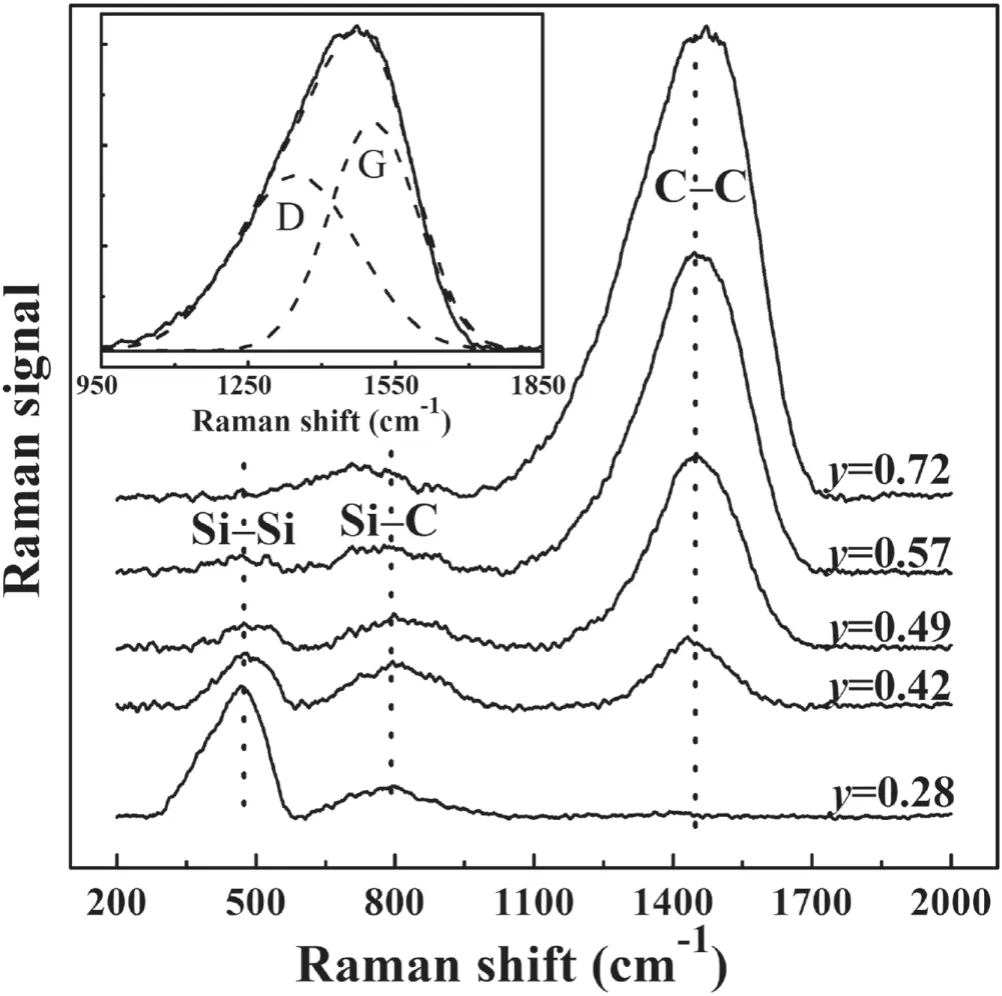
Figure 5.The Raman spectrum of the SixCy films with increasing y.
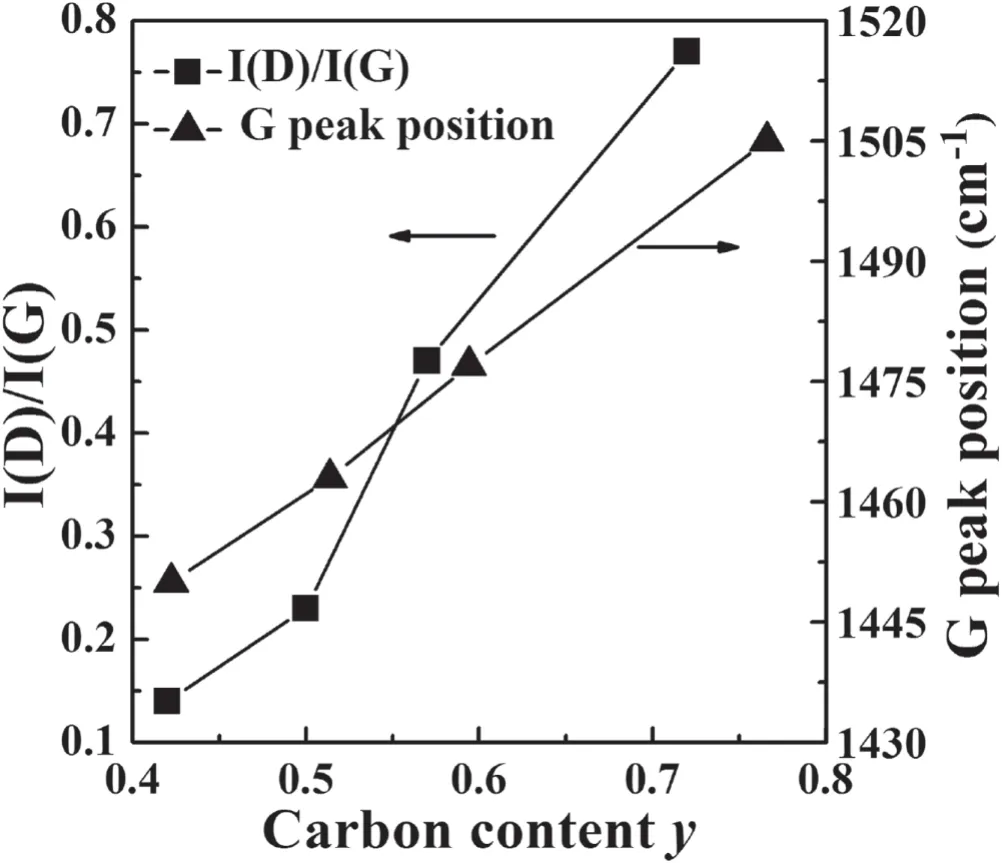
Figure 6.The G peak position and the intensity ratio I(D)/I(G)vary with increasing y.
The C−C band intensity and width increase significantly with carbon content y,and this band can be fitted by two Gaussian peaks labeled D and G,as shown in the inset of figure 5.The D peak centered around 1348 cm−1is due to disordered sp2C bonds in the graphitic structure,while the G peak is duo to ring-like and chain-like graphite structures[25,26].The G peak position and the intensity ratio I(D)/I(G)are the two key parameters to monitor carbon bonds.The G peak position and the intensity ratio I(D)/I(G) vary with increasing y are plotted in figure 6.It is shown that the G peak position linearly increases from 1450 to 1505 cm−1with increasing carbon content y.This phenomenon has also been reported for amorphous SixCy:H [27].The increase of intensity ratio I(D)/I(G)with y shown in figure 6 indicates that the disordered carbon in thin films increases and the sp3carbon content decreases [27,28].
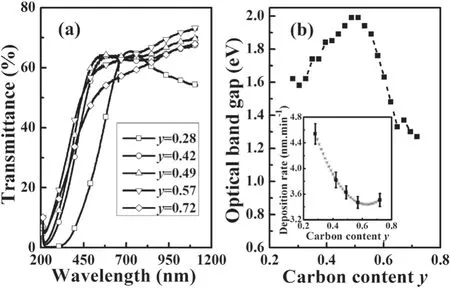
Figure 7.(a)The transmittance of the SixCy thin films,(b)the optical band gap varies with increasing y.The inset is the deposition rate of the SixCy thin films deposited on glass substrate.
The typical transmittance spectra of the SixCythin films are shown in figure 7(a),the marks on each spectrum act as the indicator of carbon content y.The deposition rate of the SixCythin films deposited on glass substrate is plotted as a function of carbon content y in the inset of figure 7(b).The optical band gap of the thin films was derived from the ultraviolet–visible spectroscopy (UV–vis) spectra by Tauc’s plotting method [6].The optical band gap of SixCythin films varying with carbon content y is shown in figure 7(b).It shows that the optical band gap increases initially and reaches to a maximum,and then it decreases rapidly.The maximum optical band gap value of 1.99 eV appears around y=0.5.Compare with figure 4(a),the variation of Si−C bond density and optical band gap with carbon content y are similar,which indicates that the optical band gap depends on Si−C bond density:at y<0.5 regime,the optical band gap increases with y due to the fact that the Si−Si bonds are gradually replaced by the Si–C bonds;at the C rich regime,y>0.5,the optical band gap decreases with y due to two reasons:(1)the sp3Si−C bonds are replaced by sp2C−C bonds [7],(2) the increase of disordered carbon and the decrease of sp3carbon content narrow the optical band gap [29].Above results demonstrate that the optical band gap of SixCyfilms could be changed in the range of 1.27−1.99 eV with carbon content y changing from 0.28 to 0.72.
4.Conclusions
SixCyfilms with different carbon contents have been prepared by the continuous compositional spread method.The carbon content y is changed from 0.28 to 0.72 by controlling the deposition position.Nearly linear relationship between L and y is obtained.When y<0.5,the Si−Si bonds are replaced by Si−C bonds with increasing y,which increases the Si−C bond density,leads to the optical band gap increase;whereas for y>0.5,the Si−C bonds are replaced by C−C bonds with increasing y,which reduces the Si−C bond density,leads to the lower optical band gap.The maximum optical band gap value of 1.99 eV appears around y=0.5.
ORCID iDs
杂志排行
Plasma Science and Technology的其它文章
- Three dimensional nonlinear shock waves in inhomogeneous plasmas with different size dust grains and external magnetized field
- Study of ionic wind based on dielectric barrier discharge of carbon fiber spiral electrode
- Theoretical research on the transport and ionization rate coefficients in glow discharge dusty plasma
- Study on plasma cleaning of the large-scale first mirror of the charge exchange recombination spectroscopy diagnostic on EAST
- Decomposition of dioxin-like components in a DBD reactor combined with Hg/Ar electrodeless ultraviolet
- Measurements of plasma parameters in a hollow electrode AC glow discharge in helium