基于手性MOF 与乙炔黑修饰电极对多巴胺和尿酸的同时检测
2020-02-11方智利刘胜东聂启祥杨绍明徐文媛周枚花
方智利 王 平 刘胜东 王 欣 聂启祥 杨绍明 徐文媛 周枚花
(华东交通大学材料学院,南昌 330013)
0 Introduction
Metal-organic frameworks (MOFs) have the advantages of large specific surface area, high crystallinity, adjustable pores and uniform pore distribution, and are expected to play a role in the recognition, exchange, adsorption and separation of molecules and ions[1-3]. However, poor conductivity and the weak adhesion properties to glassy carbon electrode(GCE) of MOFs limit seriously the direct application in sensors. To resolve this problem, there are two methods to improve the conductivity of MOFs: (1) one of the approaches is to design electrically conductive MOFs[4-8]; (2) the other is to mix MOFs with conductive materials[9-15]. In recent years, the application of MOFs materials to electrochemical sensor materials has attracted more and more attention[16-21]. Dopamine (DA)is a special catechol neurotransmitter in the human body. The amount of dopamine in the human body is closely related to physical health[22-27]. And uric acid(UA) is the major end product of the metabolism of purine nucleosides, adenosine and guanosine in organisms. Abnormal uric acid levels in the body can cause many diseases such as gout, hyperuricemia and chronic kidney disease[28-31]. Therefore, the detection of dopamine and uric acid is of great clinical significance in clinical diagnostic applications. Dopamine and uric acid have high electrochemical activity, so enormous efforts have been made into electrochemical approaches to develop sensitive and inexpensive devices for rapid detection of dopamine and uric acid[32-33]. For voltammetry detection, most of the stated electrodes have shown low selectivity, with DA signals (oxidation peak)overlapping with UA whose concentration are typically 102~103times higher than DA in a biological sample[33].Clearly, there is an urgent need for new electrode design and development to address the above challenge.
Based on the aforementioned points, a squareshaped channel chiral MOF, namely, HMOF-Zn[34]based on carnosine ligands was selected as electrochemical sensor materials to detect UA and DA. As shown in Fig.1(b~d),HMOF-Zn possesses a 1D squareshaped chiral channel extending along the b direction.The pore wall is composed of carnosine ligands, which can provide imidazole rings and hydroxyl groups to form supramolecular interactions. In order to increase the conductivity of HMOF-Zn, acetylene black (AB) is added as a sensitizer to ensure good conductivity and strong adhesion to the glassy carbon electrode (GCE).At the same time, The solution of Nafion polymer was added to improve adhesive attraction between GCE and the materials which could be used to modify electrode. Here, the highly sensitive and selective sensor based on HMOF-Zn@AB-Nafion hybrid as the modifier was fabricated for DA and UA detection for the first time. The results showed that the modified electrode has good selectivity and high sensitivity for DA and UA detection. In addition, the modified electrode has a very low detection limit for dopamine and uric acid, and good reproducibility in actual sample detection.
1 Experimental
1.1 Experimental reagents
L-carnosine, hexahydrate zinc nitrate, N,Ndimethylformamide (DMF), potassium ferrocyanide,potassium chloride, Disodium hydrogen phosphate,sodium dihydrogen phosphate, sodium chloride,dopamine hydrochloride, uric acid, all of which are of analytical grade were purchased from Aladdin Chemistry Co. Ltd. Acetylene black with diameter about 20~40 nm and electronic grade were obtained from Tianjin Aiweixin Chemical Technology Co. Ltd.Nafion polymer solution (5%(w/w)) was purchased from Beijing Branch, Du Pont China Holding Co., Ltd.All others reagents were of analytical reagent grade and used without further purification. Phosphate buffer solutions (PBS, 0.1 mol·L-1) were prepared from stock solutions of 0.1 mol·L-1NaH2PO4,Na2HPO4and H3PO4.Double distilled water was used in all experimental process.
1.2 Apparatus
X-ray powder diffraction (XRD) patterns were recorded with a D/max-2500 diffractometer (Rigaku,Japan)at 40 kV,40 mA by using Cu Kα radiation (λ=0.154 nm)with 2θ range from 5°~50°.The morphologies were examined using a SU8010 sca nning electron microscope (SEM, 5 kV, Hitachi). Electrochemical measurements were conducted on a CHI-660E electrochemical workstation with a three electrode system.The three electrodes system was composed of a platinum counter electrode, a saturated calomel reference electrode, and a modified glassy carbon electrode (GCE, Φ=3 mm) as the working electrode.
1.3 Synthesis of HMOF-Zn
HMOF-Zn was obtained by solvothermal reaction of Zn(NO3)2·6H2O and L-carnosine in the mixture solution of DMF (20 mL) and double distilled water (2 mL) according to the reported method[34]. The resulting mixture was transferred into a Teflon-lined stainlesssteel autoclave and heated at 100 ℃for 24 hours under static condition. Colorless schistose single crystals were washed thoroughly with DMF, dried in vacuum at room temperature, and characterized by XRD.
1.4 Fabrication of modified electrode
The GCE was pre-polished to obtain a mirror-like surface. The as-prepared HMOF-Zn (2 mg), AB (2 mg)and Nafion polymer solution (0.4 mL) were dispersed into 6 mL ethanol and 2 mL double distilled water under sonication with 60 minutes to obtain a homogeneous suspension. Then 5 μL of the suspension of corresponding materials was dropped onto the electrode surface of GCE and then dried under infrared lamp. Similar procedures were applied to prepare the HMOF-Zn@AB-Nafion-GCE and ABNafion-GCE sensor.
2 Results and discussion
2.1 Structure and characterization of chiral MOF (HMOF-Zn)
2.1.1 XRD analysis and pore structure
The experimental XRD pattern of HMOF-Zn crystals was in good agreement with the simulated one[34](Fig.1a). It can be seen from Fig.1a that the main diffraction peaks of the two are consistent, indicating that the HMOF-Zn was successfully synthesized with high phase purity. The arrangement of carnosine forms 1D square-shaped chiral pores, filled with DMF and running parallel to the crystallographic b axis (Fig.1b).The chiral shape of the 1D pore walls is depicted using the Connolly surface representation (Fig.1c). The 1D pores can be viewed as relatively large cavities,with diameters of 0.518 nm, connected in a zig-zag fashion by narrow channels with diameters of 0.378 nm (shown in pink in Fig.1d).
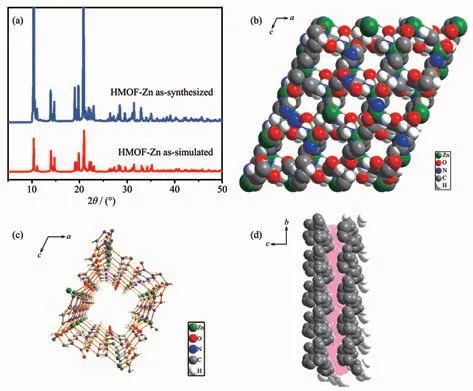
Fig.1 Simulation and measured XRD patterns of HMOF-Zn (a) and 1D square-shaped chiral pore structure (b~d)
2.1.2 SEM analysis of modified electrodes
Fig.2(a, b) shows the SEM images of the HMOFZn@AB-GCE. The spherical particles were AB, and the shape of rectangular prisms were HMOF-Zn. It can be clearly seen that the tiny AB particles disperse comparatively homogeneously around the HMOF-Zn,ensuring intimate contact between the HMOF-Zn and AB. SEM image (Fig.2c) showed that the Nafion layer has been successfully coated onto HMOF-Zn@AB materials.

Fig.2 SEM images of HMOF-Zn@AB-GCE (a, b) and HMOF-Zn@-AB-Nafion-GCE (c)
2.2 Electrochemical characterization
Electrochemical impedance spectroscopy (EIS)clearly characterized the conductivity and reaction rate of the modified electrode. The Nyquist plot is composed of a semicircle in the high frequency region and a straight portion in the low frequency region. The semicircle represents the charge transfer process, and its diameter is the charge transfer resistance Rct. The size of the semicircle indicates the change of the electrode surface during electrode modification, and the straight line indicates the control process. The EIS of the bare GCE and the different sensors are recorded in Fig.3. EIS is a powerful method to prove the interfacial changes of the sensor. The semicircle diameter at high frequencies equals the chargetransfer resistance (Rct), which controls the chargetransfer kinetics of the redox probe at the electrode interface[22]. The smaller the Rctmeans the faster the electron transfer between the electrode and electrolyte interface. As shown in Fig.3, HMOF-Zn was barely conductive due to its poor electrical performance (Rct=1.39×10³Ω). After adulterated with AB, the resistance of the HMOF-Zn@AB nanohybrid decreased to 41.42 Ω (about 3 orders of magnitude higher than that of HMOF-Zn). Consequently, the addition of AB could efficiently facilitate electron transfer rate between electrode surface and UA and DA. The Rctcan be estimated to be 95,1 388,19 and 41 Ω at bare electrode,HMOF-Zn-Nafion-GCE, AB-Nafion-GCE and HMOFZn@AB-Nafion-GCE sensors, respectively, revealing the low electron-transfer resistance on the AB-Nafion-GCE and HMOF-Zn@AB-Nafion-GCE sensors, which is resulted from the good conductivity of AB. The Rctvalues increase in the order of the AB-Nafion-GCE sensor <HMOF-Zn@AB-Nafion-GCE sensor <bare GCE <HMOF-Zn-Nafion-GCE sensor. Both CV curve and EIS curve indicate that HMOF-Zn adulterated with AB is beneficial to electron transfer.
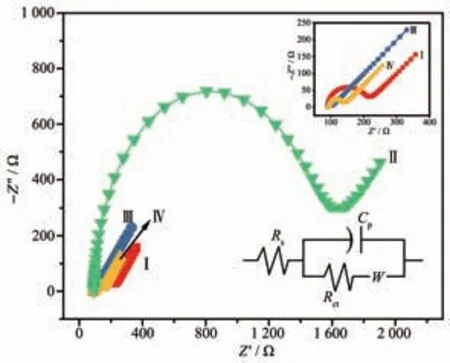
Fig.3 EIS represented by Nyquist diagrams of bare GCE(Ⅰ), HMOF-Zn-Nafion-GCE (Ⅱ), AB-Nafion-GCE(Ⅲ)and HMOF-Zn@AB-Nafion-GCE (Ⅳ)sensors in 5 mmol·L-1 K3[Fe(CN)6]/K4[Fe(CN)6] solution (1∶1,V/V) containing 0.1 mmol·L-1 KCl
2.3 Electrocatalytic oxidation of DA and UA
Fig.4(a~c) shows the CVs responses of dopamine,uric acid, and the binary mixture of DA and UA,respectively, at different modified electrodes. It can be seen from Fig.4a and 4b that the responses to DA and UA at the bare electrode were relatively low. For comparison, the redox peak currents of DA and UA were obviously improved when the electrode was modified by the HMOF-Zn in spite of the weak conductivity of the MOFs. It might be that the hydrogen bond between O or N (from -OH group and imidazole rings of HMOF-Zn respectively) and H(from DA and UA) could be helpful to improve the easy adsorption of DA and UA, and finally promoted the response of the electrode sensor towards determination of the two biomolecules, especially contributed to the appearance of oxidation peak of DA. Compared with the bare electrode and HMOF-Zn-GCE, the electrode modified used AB had a significant increase in peak current due to the strong conductivity of AB which can accelerate the transfer of current between the solution and the interface.Interestingly, by subtracting the background, the peak currents of DA at the HMOF-Zn@AB-Nafion-GCE sensor were found almost 1.8 and 1.2 times larger than that achieved at the HMOF-Zn-Nafion-GCE sensor or AB-Nafion-GCE sensor. Similar results were observed at different sensors for the detection of UA.The CVs responses of UA increase in the order of the bare GCE < AB-Nafion-GCE sensor < HMOF-Zn-Nafion-GCE sensor < HMOF-Zn@AB-Nafion-GCE sensor. Fig.4c shows the CVs responses of the binary mixture of DA and UA at different electrodes. In Fig.4c, it can be seen that the response of the bare electrode to DA and UA was weak, but also the two oxidation peaks of DA and UA overlap together when UA and DA were simultaneously measured. After the sensor was modified by HMOF-Zn or AB, the two oxidation peaks of DA and UA were relatively broad but separated obviously. For AB-Nafion-GCE sensor,the oxidation peaks of DA and UA at 0.24 and 0.37 V suggested that the electroactive area of the electrode sensor increased significantly. Surprisingly, there were two distinctly separated peaks of the two species at the HMOF-Zn@AB-Nafion-GCE sensor, indicating high electrochemical activities (sensitivity and selectivity) in response sensor to DA and UA. That the HMOF-Zn@AB-Nafion-GCE sensor possessed excellent electrochemical properties is due to the synergetic effect of HMOF-Zn and AB. In a word, the results demonstrate that the HMOF-Zn@AB-Nafion-GCE sensor effectively facilitates the individual and simultaneous determination of the small biomolecules.
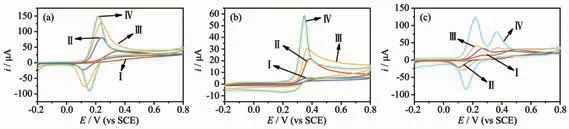
Fig.4 CV diagrams of bare GCE (Ⅰ), HMOF-Zn-Nafion-GCE (Ⅱ), AB-Nafion-GCE (Ⅲ)and HMOF-Zn@AB-Nafion-GCE (Ⅳ)sensor in (a) 50 μmol·L-1 DA, (b) 50 μmol·L-1 UA and (c) 50 μmol·L-1 UA and 50 μmol·L-1 DA
2.4 Optimization of experimental conditions
To obtain highly sensitive and better selective sensors, the experimental conditions were optimized to ensure that the HMOF-Zn@AB-Nafion-GCE sensor has the best electrochemical response to DA and UA.The ratio of HMOF-Zn to AB, solution pH and scan rate were investigated using the CV method.
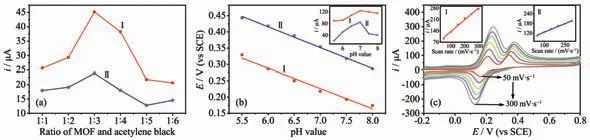
Fig.5 (a) Effect of radio of HMOF-Zn and acetylene black, (b) pH value and (c) scan rate on peak currents for the oxidation of 40 μmol·L-1 DA (Ⅰ)and 50 μmol·L-1 UA (Ⅱ)on HMOF-Zn@AB-Nafion-GCE sensor in 0.1 mol·L-1 PBS
The ratio of HMOF-Zn to AB has a great influence on the performance of the sensor. In this regard, the ratio of the two materials was changed while the other factors such as pH and scan rate kept constant. In Fig.5a it can be seen that in the ratio of 1∶1 to 1∶3, the peak currents of DA and UA increased with the increasing ratio of the two materials until 1∶3 at pH 7.0 and scan rate of 100 mV·s-1. Continuing increasing the ratio, the peak currents of the two biomolecules decreased sharply. For DA, the maximum of the peak current was achieved at the ratio of 1:3. The reason can be ascribed to the synergistic effect of the HMOF-Zn and AB. The low ratio indicated the amount of AB decreased, causing the conductivity of the fabricated sensor was poor and the electron transfer between the sensor and the analyte was impeded. By contrast, the high ratio meant the number of HMOF-Zn decreased, the hydrogen bond between MOFs and the analyte was weaker and the surface area of the sensor became smaller. Based on the above experiments, the ratio of 1∶3 was chosen for the following experiments.
The pH value has also a significant influence on the performance of the sensor. In Fig.5b the pH value ranging from 5.5 to 8.0 of PBS was recorded at HMOF-Zn@AB-Nafion-GCE sensor in this work while the ratio of HMOF-Zn to AB and scan rate were fixed at 1∶3 and 100 mV·s-1respectively in the experimental process. It can be seen from Fig.5b that the current peak of DA increased with the increase of the pH value ranging from 5.5 to 7, which is probably because the amino groups of DA were deprotonated with the increase of the pH value and the amino groups deprotonated are conducive to the formation of hydrogen bonds between MOFs and the biomolecules.Then it decreased from pH 7.0 to 8.0. Continuing increasing the pH value, the phenolic hydroxyl of DA is deprotonated and that are not be beneficial to the formation of hydrogen bonds between MOFs and the biomolecules on the contrary. Moreover, the oxidation peaks of UA and DA also shifted with the change of the pH value. And the slope of potential (E) vs pH was 62.0 and 64.2 mV for DA and UA, respectively,which was close to the theoretical slope of Nernst of 59 mV. It indicates that the same number of protons and electrons participate in the reaction. Hence, the pH value was chosen to be 7.0 in the subsequent tests.
To evaluate the reaction kinetics, the CV responses at different scan rates for the two compounds was investigated. In Fig.5c, the scan rate was changed while the ratio of HMOF-Zn to AB and pH value were fixed at 1∶3 and 7.0 respectively in the experimental process. Fig.5c shows that the oxidation peak currents of DA and UA gradually increased as the increase of scan rate, with a linear relationship between the peak currents and the scan rate in the range of 50~300 mV·s-1(the inset of Fig.5c). The regression equations were expressed as follows: iDA=6.24+0.072 4vDA(R2=0.998) and iUA=9.1+0.035vUA(R2=0.993) (v is the scan rate). It demonstrates that electrochemical reaction of the two biomolecules at HMOF-Zn@AB-Nafion-GCE sensor was a surfacecontrolled process.
2.5 Simultaneous detection of UA and DA
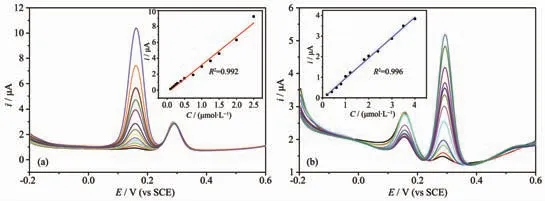
Fig.6 DPV plots with (a) different concentrations of DA (from inside to outside: 0.15, 0.2, 0.25, 0.3, 0.4, 0.5, 0.75, 1,1.25, 1.5, 2 and 2.5 μmol·L-1) and 2 μmol·L-1 UA; (b) DPV plots with different concentrations of UA (from inside to outside: 0.2, 0.4, 0.6, 0.8, 1, 1.2, 1.8, 2, 2.4, 3, 3.5 and 4 μmol·L-1) and 1 μmol·L-1 DA
To further investigate the feasibility of the sensor,differential pulse voltammetry (DPV) responses of the binary mixtures of DA and UA were recorded when the concentration of the detected analyte was changed with the other keeping constant at the optimized electrode sensor. The results are shown in Fig.6. The results showed that two substances could be detected simultaneously at the HMOF-Zn@AB-Nafion-GCE sensor. And the experiments indicated the HMOFZn@AB-Nafion-GCE sensor exhibited wide linear relationships between the oxidation peak current responses and the analytes concentrations, with the correlation coefficient of 0.992 and 0.996 for DA and UA, respectively. The following linear regression equations were expressed as iDA=3.515CDA-0.351 (R2=0.992) and iUA=0.988CUA-0.035 (R2=0.996). The detection ranges were 0.2~2.5 μmol·L-1for DA and 0.2~4 μmol·L-1for UA with the detection limits were 0.003 and 0.02 μmol·L-1, Respectively. It is worth mentioning that the DPV responses of DA was stronger than of UA at the same concentration of DA and UA.Namely, the DPV responses of DA and UA were 2.949 and 1.14 μA at the concentration of 1 μmol·L-1,respectively. The experimental phenomena can be ascribed that the side chain amino groups of the DA probably reach into the chiral pore of HMOF-Zn and form much more hydrogen bonds with the imidazole rings or hydroxyl groups of the inner wall of the pore.Because HMOF-Zn possesses 1D square-shaped pores with the diameters of maximum (0.518 nm) and minimum (0.378 nm), which are accessible to linear amino alkyl group. However, UA molecules could not reach into the chiral pore of HMOF-Zn on account of their large molecular size. So hydrogen bonds are formed only between UA molecules and N or O on the surface of HMOF-Zn. Compared with some existing sensors, the HMOF-Zn@AB-Nafion-GCE sensor is applied to the detection of DA and UA with low detection concentration and detection limit[10,22,31]. The HMOF-Zn@AB material is suitable as a sensor sensitizer for the detection of small biomolecules.
2.6 Reproducibility
The same HMOF-Zn@AB-Nafion-GCE sensor was used to detect DA or UA in five successive experiments and five different HMOF-Zn@AB-Nafion-GCE sensors in five successive experiments were for the DPV detection of the binary mixed system too (i1,i2, i3, i4, i5were the current from the five experiments,respectively). The results showed that the relative standard deviations (RSD) for the same sensor were 4.4%and 5.0%for DA and UA,respectively(Table 1).The RSD for five different sensors were 1.6% and 4.6% for DA and UA (Table 1), respectively. Based on the above experiments, the sensor has good reproducibility.
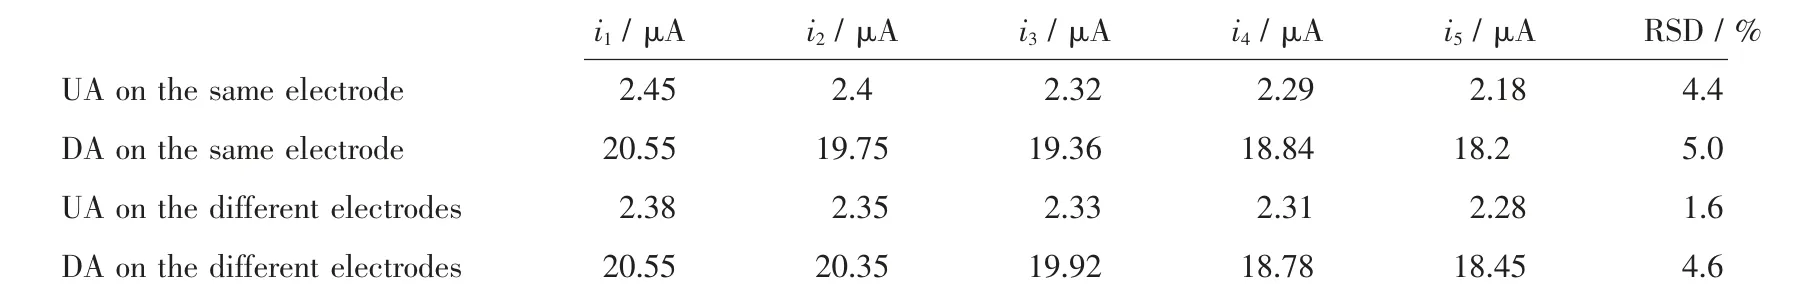
Table 1 Reproductivity of HMOF-Zn@AB-Nafion-GCE sensor towards DA and UA
2.7 Real sample analysis
To investigate the practicality of the HMOF-Zn@AB-Nafion-GCE sensor, the experiment was carried out to detect the DA content of dopamine hydrochloride injection and the UA content of human urine(Table 2). After the real samples of DA and UA were diluted 10 times and 100 times with PBS, a certain amount of standard solution was added and the test was repeated three times (n=3). It can be seen that the range of RSD was between 1.4% and 2.4%, and the recovery range were from 99.5 to 101.4% from Table 2. Experiments have shown that the HMOFZn@AB-Nafion-GCE sensor can be used for the determination of real samples of DA and UA. In order to ensure the practicality of the electrode, we took a certain amount of urine and added 20 μmol·L-1UA and 20 μmol·L-1DA for testing, respectively. The results showed that the recovery rates of 20 μmol·L-1UA and 20 μmol·L-1DA spiked samples were 101%and 98.5%, respectively (Table 3), which clearly indicate the applicability and reliability of the proposed method.
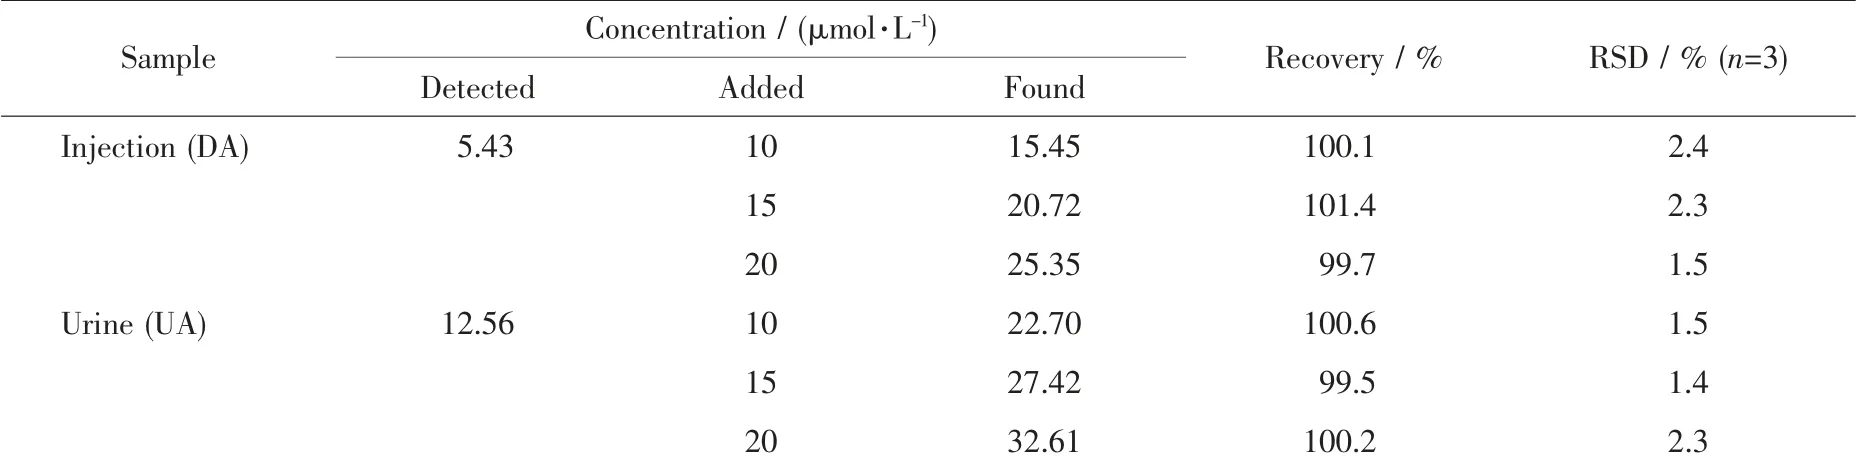
Table 2 Real sample analysis
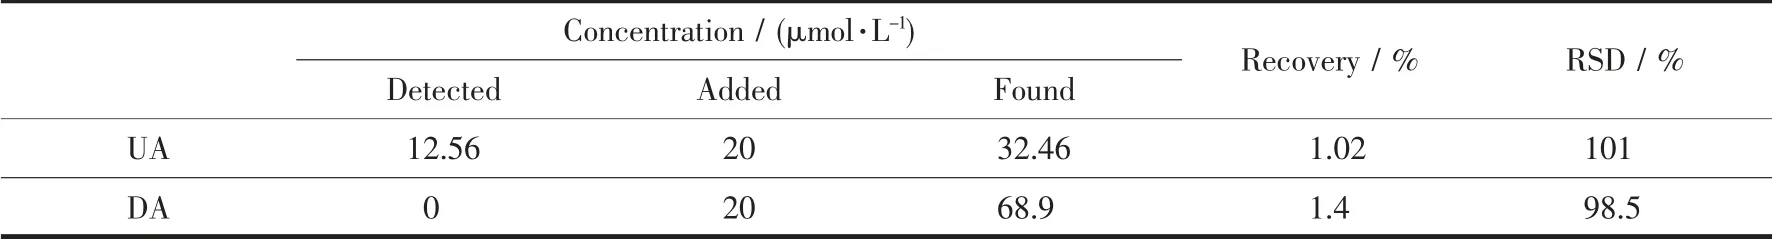
Table 3 Sample analysis after adding 20 μmol·L-1 DA and 20 μmol·L-1 UA to the urine
3 Conclusions
A chiral MOFs based on carnosine ligands adulterated with AB were used to modify the GCE electrodes which were used to detect DA and UA simultaneously for the first time in this work. The procedure of fabricating sensor was simple, convenient and rapid. It was found that the determination of DA and UA exhibited a wide detection range and low detection limit as well as good selectivity and reproducibility. The sensor was also successfully applied to detect UA and DA concentrations in real samples and received acceptable recoveries. This further proved that poor conductive MOFs mixed with high conductive nano-materials can be used as electrode materials from this work. Moreover, it also provides new ideas for the future application of more MOFs in electrochemistry.
Acknowledgments:This work was financially supported by the National Natural Science Foundation of P. R. China(Grant No.21365012).