CHT/CFD Analysis of Thermal Sensitivity of a Transonic Film-Cooled Guide Vane
2019-06-12PrasertPrapamonthonSoemsakYooyenandSuwinSleesongsom
Prasert Prapamonthon ,Soemsak Yooyen and Suwin Sleesongsom
Abstract: Thermal parameters are important variables that have great influence on life time of turbine vanes.Therefore,accurate prediction of the thermal parameters is essential.In this study,a numerical approach for conjugate heat transfer(CHT)and computational fluid dynamics(CFD)is used to investigate thermal sensitivity of a transonic guide vane which is fully film-cooled by 199 film holes.Thermal barrier coating(TBC),i.e.,the typical TBC and a new one as the candidate TBC,and turbulence intensity(Tu),i.e.,Tu=3.3%,10% and 20%,are two variables used for the present study.At first the external surface temperatures of the vane material are compared.Next,the TBC surface temperatures are considered.Results show the major role of the lower thermal conductivity of TBC which results in the lower and more uniform temperature on the external surface of the vane substrate.Finally,the thermal sensitivity is presented in terms of the percentage reduction of the external surface temperatures of the vane material and the structural temperatures of the vane material at midspan,including the variations of average and maximum vane temperatures.Results show that TBC and Tu have significant effects on the external surface and structural temperatures of the vane substrate.The lower thermal conductivity of TBC leads to the higher difference between the thermal conductivity of the vane substrate and TBC,the reduction of heat transfer and the more uniform temperature within the vane structure.The results also show more effective protection for the average vane temperature from the two TBCs at higher Tus.However,Tu does not significantly affect the reduction of the maximum vane temperature even though the new TBC,which has the very low thermal conductivity,is used.
Keywords: Conjugate heat transfer,film cooling,thermal sensitivity.
1 Introduction
Basically,the main approach to obtain high thermal efficiency and power output from gas-turbine engines is to increase turbine inlet temperature(TIT)of burned gas coming out of the combustion chamber.As TIT of gas turbines has gone far beyond the allowable temperature of the current materials of turbine airfoils,the development of turbine cooling techniques and the improvement of materials are key factors to solve this difficulty.More than fifty years in gas-turbine industry,complicated internal cooling and film cooling have been designed for turbine vanes and blades.However,it is still inadequate for maintaining life time of the vanes and blades.Therefore,the use of thermal barrier coating(TBC)is needed and indispensable to state-of-the art gas turbines.In fact,thermally protective ability of TBC depends on internal factors i.e.,phase stability,porosity,thermal conductivity and thickness,and external factors i.e.,temperature of hot gas,matching of thermal expansion coefficients with the coated metal surface and coating method.Therefore,the current material development and discovery of new materials for the turbine airfoils and TBC play leading roles of this achievement.Wang et al.[Wang,Guo,Zhao et al.(2016)]developed a new TBC called as LDZ based on La1.7Dy0.3Zr2O7,which was prepared by the air plasma spraying.With the advantages of thermal and mechanical properties of LDZ,they proposed that LDZ could be a candidate material for the TBC ceramic layer in gas turbine applications.They indicated that in a comparison with a typical TBC made of ZrO2with 8% Y2O3(8YSZ),LDZ had better phase stability,lower thermal conductivity,better actual heat insulation,especially when temperature was above 1773 K.Effects of TBC on turbine airfoils have been documented through experiments for many years,as seen in examples[Witz and Bossmann(2012);Maikell,Bogard,Piggush et al.(2011);Davidson,Dees and Bogard(2011)].However,at the present time the use of simultaneous calculation of conjugate heat transfer(CHT)analysis and computational fluid dynamics(CFD)is commonly employed in gas-turbine fields as well because there are many benefits to prediction of the mixing process of hot gas and cooling air,the solid temperature variation within structures and a more accurate approximation of convective boundary conditions,in comparison with given isothermal boundary conditions,as reported by Zhang et al.[Zhang,Xu,Wang et al.(2015);Ni,Humber,Fan et al.(2013);Yoshiara,Sasaki and Nakahashi(2011); Mangani,Cerutti,Maritano et al.(2010);Mazur,Herna´ndez-Rossette,Garcı´a-Illescas et al.(2006)].Hence,the combined CHT/CFD analysis has been applied to predict phenomena of heat transfer and fluid flow,including thermal sensitivity of gas turbines with TBC effects,as seen in Ji et al.[Ji,Ma,Ge et al.(2016);Alizadeh,Izadi and Fathi(2014);Rossette,Mazur,Demeulenaere et al.(2009);Lee,Kim,Shin et al.(2009);Takahashi,Watanabe,Fujii et al.(2008);Na,Williams,Dennis et al.(2007);Bohn and Tümmers(2003);Bohn and Becker(1998)].For instances,Lee et al.[Lee,Kim,Shin et al.(2009)]used a flat plate model for numerically thermal analysis in a film hole with TBC.Their conclusion indicated that the maximum temperature and maximum debonding stress values at the edge of film holes were functions of TBC thickness and the temperature of main flow.Na et al.[Na,Williams,Dennis et al.(2007)]used a flat plate model for numerically thermal analysis of the internal and film cooling with TBC effects.They drew the conclusion that TBC resulted in the surface temperature and the internal temperature because of the low thermal conductivity of the TBC ceramic top coat.Another observation was that thermal stress distribution was changed because temperature gradient turned towards the side of the flat plate with the internal cooling.Ji et al.[Ji,Ma,Ge et al.(2016)]used CHT analysis to investigate the effects of TBC and mass flow rate of coolant on cooling performances of a blade coated by a uniform TBC thickness of 0.3 mm.Their results indicated that TBC played a major role in the region cooled effectively by internal cooling,but TBC did not have the significant effect in the trailing edge(TE).Alizadeh et al.[Alizadeh,Izadi and Fathi(2014)]numerically studied effects of TBC thickness and thermal conductivity on temperature sensitivity of a nonfilm-cooled turbine blade using CHT analysis.Their conclusions indicated that the increase in TBC of 0.2 mm caused 19 K fall in the average blade temperature and 34 K fall in the maximum blade temperature.Also,about 10 K increment in the average blade temperature occurred when thermal conductivity of TBC increased from 1 to 3 W/m·K.Rossette et al.[Rossette,Mazur,Demeulenaere et al.(2009)]used CHT analysis to investigate the performances of a blade coated by TBC.They concluded that the surface temperature of the blade was reduced as much as 200°C by using a TBC thickness of about 100-400 µm.Moreover,TBC reduced 36% coolant consumption to preserve material creep life.Also,Bohn and Becker[Bohn and Becker(1998)]used CHT analysis to investigate the effects of TBC on surface temperature and heat transfer of a comprehensively non-film-cooled vane.Their results indicated that with a uniform TBC thickness of 300 µm,the temperature of the external surface of the coated vane was higher than that of the vane without TBC and TBC equalized the temperature of the external surface.Also,TBC could not reduce the heat flux on the whole vane surface.The heat flux increased in the location of the absolute temperature minima on the pressure side(PS)and the suction side(SS).
On top of that,the computational models were based on a flat plate,cylinder or a turbine airfoil without film cooling or with a small number of film holes.Therefore,it is important and unavoidable to provide gas-turbine designers and investigators with comprehensive studies of real turbine airfoils operating under real circumstances,especially various mainstream turbulence intensities(Tu).In fact,Tu is an important physical factor that affects the mixing between hot gas and cooling air emitted from film holes,and results in heat transfer mechanism and turbine cooling performances physically,as presented in Samson et al.[Samson and Sarkar(2016);Kingery and Ames(2015);Saumweber and Schulz(2012);Volino,Kartuzova and Ibrahim(2008);Ibrahim,Kartuzova and Volino(2008);Mayhew,Baughn and Byerley(2002);Thole,Radomsky,Kang et al.(2002);Ames(1996);Ames(1994)].This paper presents a three-dimensional CHT/CFD analysis of thermal sensitivity of a realistic transonic turbine vane which has a complicated configuration of a large number of film holes.TBC and Tu which affect thermal parameters on the vane are used as variables for this work.The thermal sensitivity is discussed in terms of percentage reduction of external surface temperatures of the vane material(substrate),structural temperatures of the vane material,and variations of average and maximum vane temperatures.
2 Vane model
The vane model is the transonic film-cooled guide vane which is modified from[Timko(1984)].This modified vane and its linear cascade are the same model as previously studied by[Prapamonthon,Xu,Yang et al.(2017)].The vane height is 40 mm with a constant cross-section area.Cooling air emitted from 199 film holes of 13 rows is supplied by forward and aft cavities,as shown in Fig.1. More details about the vane configuration and its film holes were reported in Prapamonthon et al.[Prapamonthon,Xu,Yang et al.(2017)]and[Timko(1984)].

Figure 1:Vane model and film-hole description at a cross section(Adapted from Prapamonthon et al.[Prapamonthon,Xu,Yang et al.(2017)]and[Timko(1984)])
3 Research description and thermal sensitivity parameters
To evaluate the thermal sensitivity of the film-cooled vane,TBC and Tu are chosen to be the key independent variables for the thermal sensitivity analysis.At first,external surface temperatures of the vane material are compared,and then TBC surface temperatures are discussed.Finally,the thermal sensitivity is presented in terms of the percentage reduction of the external surface temperatures of the vane material(substrate),the structural temperatures of the substrate,and the variation of the average and maximum vane temperatures.To be clear,it should be noted that(1)the term “substrate”is used to refer to the vane material when the vane is coated with TBC.(2)The term “the external surface temperature of vane substrate” is the temperature below the TBC layer which is computed at the interface of the vane substrate and TBC,and the percentage reduction of the external surface temperature of the vane substrate is calculated as R=[(TTTBC)/T]×100%,where T and TTBCare the external surface temperature of the vane material without TBC and with TBC as defined in Figs.2(a)and 2(b),respectively.(3)The term “average vane temperature” is the volume-weighted average temperature of the vane material,excluding TBC and it is computed by dividing the summation of the product of the temperature and vane cell volume by the total volume of the vane cell domain as Tav=(1/V)Σ(TiVi)where i=1,2,3,…,n.

Figure 2:Definition of external surface temperature of vane material without TBC and with TBC
4 Computational setup
The computational setup in this work was done as previously studied by Prapamonthon et al.[Prapamonthon,Xu,Yang et al.(2017)].Therefore,only important parts are mentioned in this section.Computational hexahedral meshes in solid and fluid domains are generated by ANSYS ICEM CFD.To improve the quality of all meshes near vane surfaces,O-Grid refinement technique is used.To confirm the independence of mesh numbers on numerical results,coarse mesh of 9,143,910 elements(9.1 M),medium mesh of 10,672,683 elements(10.6 M),and fine mesh of 13,171,055 elements(13 M)are compared to one another.After comparing thermal and aerodynamic results in terms of dimensionless pressure and surface temperature,as seen in Fig.3,the medium mesh,10.6 M is chosen as the computational mesh for the following simulations because the maximum difference of the surface temperature obtained by this mesh is less than 2%.Figs.4 and 5 show details of the computational mesh of the medium mesh of 10.6 M.The value of y+ in the simulation is less than 5,which is generally acceptable for resolving flow of boundary layer close to the walls.
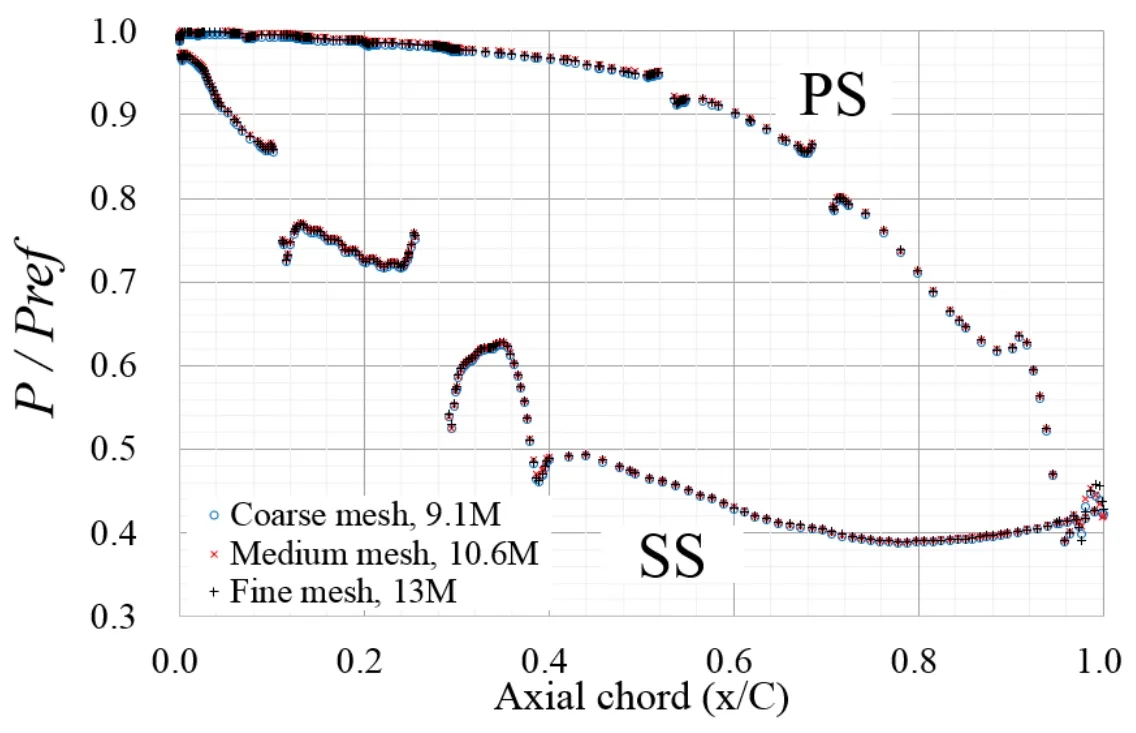

Figure 3:Mesh independence of aerodynamic and thermal results(Adapted from Prapamonthon et al.[Prapamonthon,Xu,Yang et al.(2017)])
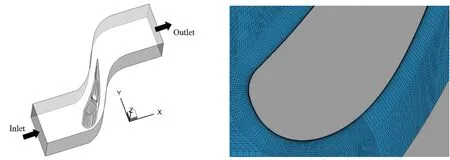
Figure 4:The computational mesh of mainstream(Adapted from Prapamonthon et al.[Prapamonthon,Xu,Yang et al.(2017)])
CHT/CFD analysis is used by means of ANSYS FLUENT with SST k-ω turbulence model.This turbulence model has shown good capability of aerothermal prediction on Mach number,pressure and thermal results,as seen in previous published literatures[Ke and Wang(2016);Ke and Wang(2015);Zhang,Xu,Wang et al.(2015);Alizadeh,Izadi and Fathi(2014);Yoshiara,Sasaki and Nakahashi(2011)].Fourier's law is used to solve heat conduction within the solid domain.Equations of mass,momentum and energy are solved within fluid domains.The mesh interface technique with coupled wall is applied at all interfaces of fluid and solid to ensure that the temperature and heat flux on both fluid and solid sides are equivalent.Convergence criteria of numerical results are set by the maximum scaled continuity and energy residuals of 10-3and 10-6,respectively.The balance of mass flow rate between all inlets and outlets,and residuals of six-point temperatures on the vane surface are monitored to confirm the convergence of the results.Details of thermal properties of air and steel are listed in Tab.1.
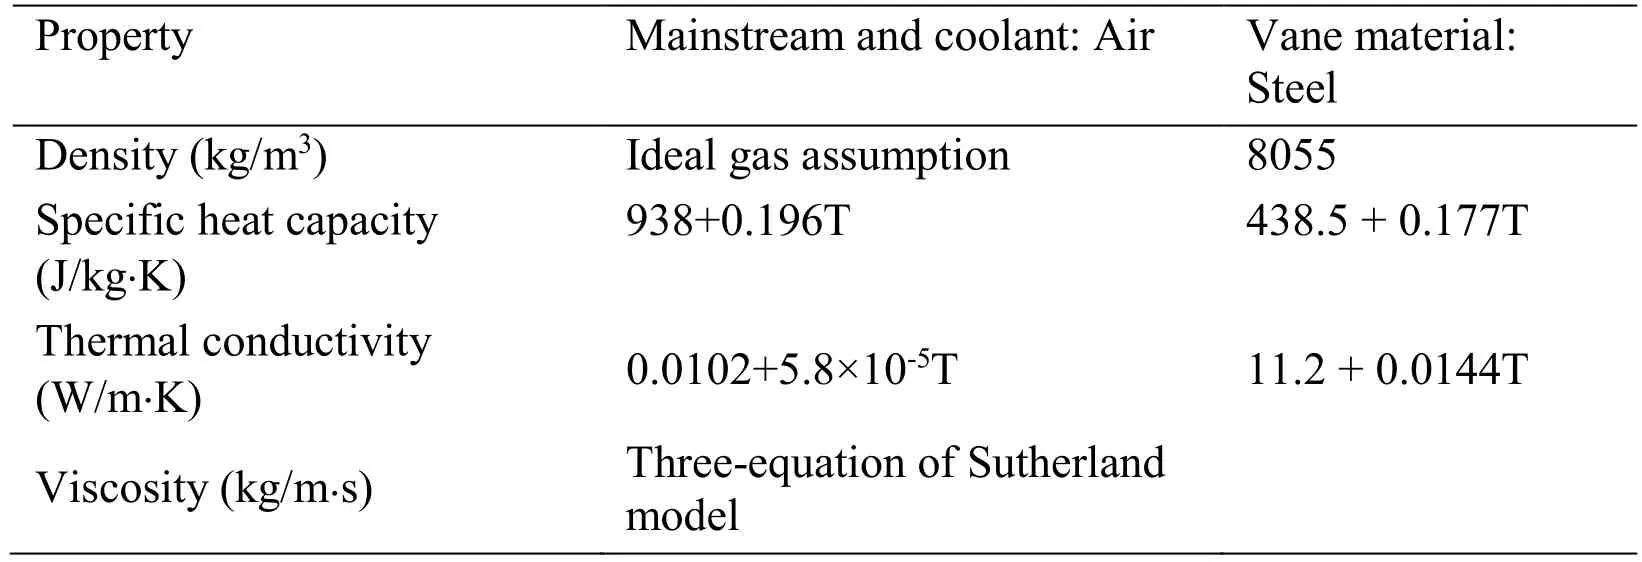
Table 1:Properties of air and steel*
Effects of TBC are considered by using a typical TBC(TBC1)made of ZrO2and a new TBC(TBC2)made of LDZ as proposed by Wang et al.[Wang,Guo,Zhao et al.(2016)].A TBC thickness of 0.3556 mm is used for the two TBCs,as reported by Halila et al.[Halila,Lenahan and Thomas(1982)].Because of the very thin thickness of the TBC layer,only 1D conductive heat equation is solved inside TBC by means of the technique of thin wall thermal resistance.Thermal properties of the two TBCs are given in Tab.2.

Table 2:Properties of TBCs
A comparison between thermal conductivity of the vane material and the two TBCs is depicted in Fig.6. It can be seen that the thermal conductivity of steel is much higher than that of the typical TBC(TBC1)and the new TBC(TBC2)in the range of temperature from 300 K to 800 K where is the temperature range of the present study.
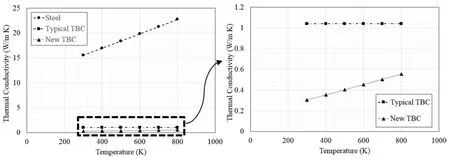
Figure 6:Thermal conductivity of steel,typical TBC and new TBC versus temperature
For boundary conditions,all simulations are set as based on the experimental conditions reported by Timko[Timko(1984)],as listed in Tab.3.The pressure ratio(PR)is defined by the ratio of the total pressure at mainstream inlet to the static pressure at mainstream outlet.It should be noted that the outlet of the forward and aft cavities is given as the adiabatic wall with non-slip condition,so it causes the coolant in the cavities to flow out of film holes only.This provides the highest potential of cooling air emitted from the film holes.Additional conditions for the present study are that mainstream Tuis set as 3.3%,10% and 20%,and length scale(Lu)is 6 cm.

Table 3:Boundary conditions used in this work
The solver used in the present work was validated by comparing Mach number distributions predicted by CHT/CFD analysis with SST k-ω turbulence model with Mach number distributions obtained by experiments of Timko[Timko(1984)]at PR=1.67,2.3 and 2.7,as seen in Prapamonthon et al.[Prapamonthon,Xu,Yang et al.(2017)].The validation indicated that the Mach number obtained by SST k-ω model increased with PR and was close to the experimental Mach number with a maximum error of about 10%.The numerical results of the present study are not validated by comparing thermal results due to lack of heat transfer data obtained by the experiments.However,according to the governing equations of fluid flow and heat transfer and equation of state for compressible flow,the method which demonstrates the ability to get a good aerodynamic agreement on the results of Mach number,pressure,and velocity distributions could result in a reasonable and acceptable thermal field,as can be seen in previous literatures[Yoshiara,Sasaki and Nakahashi(2011);Zhang,Zou,Li et al.(2013);Alizadeh,Izadi and Fathi(2014)].So far,the success in using SST k-ω to predict heat transfer in transonic cascades has been presented continuously[Mangani,Facchini and Bianchini(2009);Alizadeh,Izadi and Fathi(2014);Ke and Wang(2015);Ji,Ma,Ge et al.(2016);Ke and Wang(2016)].Therefore,the validation of the aerodynamic results shown in the present study is still meaningful and acceptable under this consideration,and CHT/CFD analysis with SST k-w turbulence model can be used for prediction of thermal sensitivity.In the following simulations,the numerical results are conducted by this approach at PR=1.67,which was designed by Timko[Timko(1984)].
5 Results and discussion
5.1 Temperature distribution
5.1.1 External surface temperature of vane material
Figs.7-12 show contours of the external surface temperature distributions of the vane material at Tu=3.3%,10% and 20%.Unsurprisingly,the results indicate that at the same Tu,the vane with the new TBC(TBC2)provides the lowest external surface temperature of the vane material and the highest external surface temperature of the vane material exists when the vane is not coated with TBC.It is clear that these phenomena happen because the TBC2 has the lowest thermal conductivity,while the vane material has the highest thermal conductivity.This also indicates that the TBC2 blocks the heat flux transferring into the vane structure most effectively.Another observation is that no matter whether TBC is used,at each Tu,the relatively high temperatures always happen in the tip and hub regions of the vane,and the maximum vane temperatures happen at the hub in the TE region.These can be explained by the fact that those regions cannot be cooled effectively by cooling air emitted from film holes,particularly the hub in the TE where falls under the influences of the highest temperature of coolant at the end of aft cavity and flow of passage vortices transporting towards the surfaces.The regions with the relatively high temperatures at the tip and hub expand significantly when Tu increases,because heat transfer from hot gas to the solid vane increases at higher Tus.Besides,one can observe that the TBC2 makes the external surface temperature of vane material more uniform.

Figure 7:External surface temperature distributions on PS vane material at Tu=3.3%
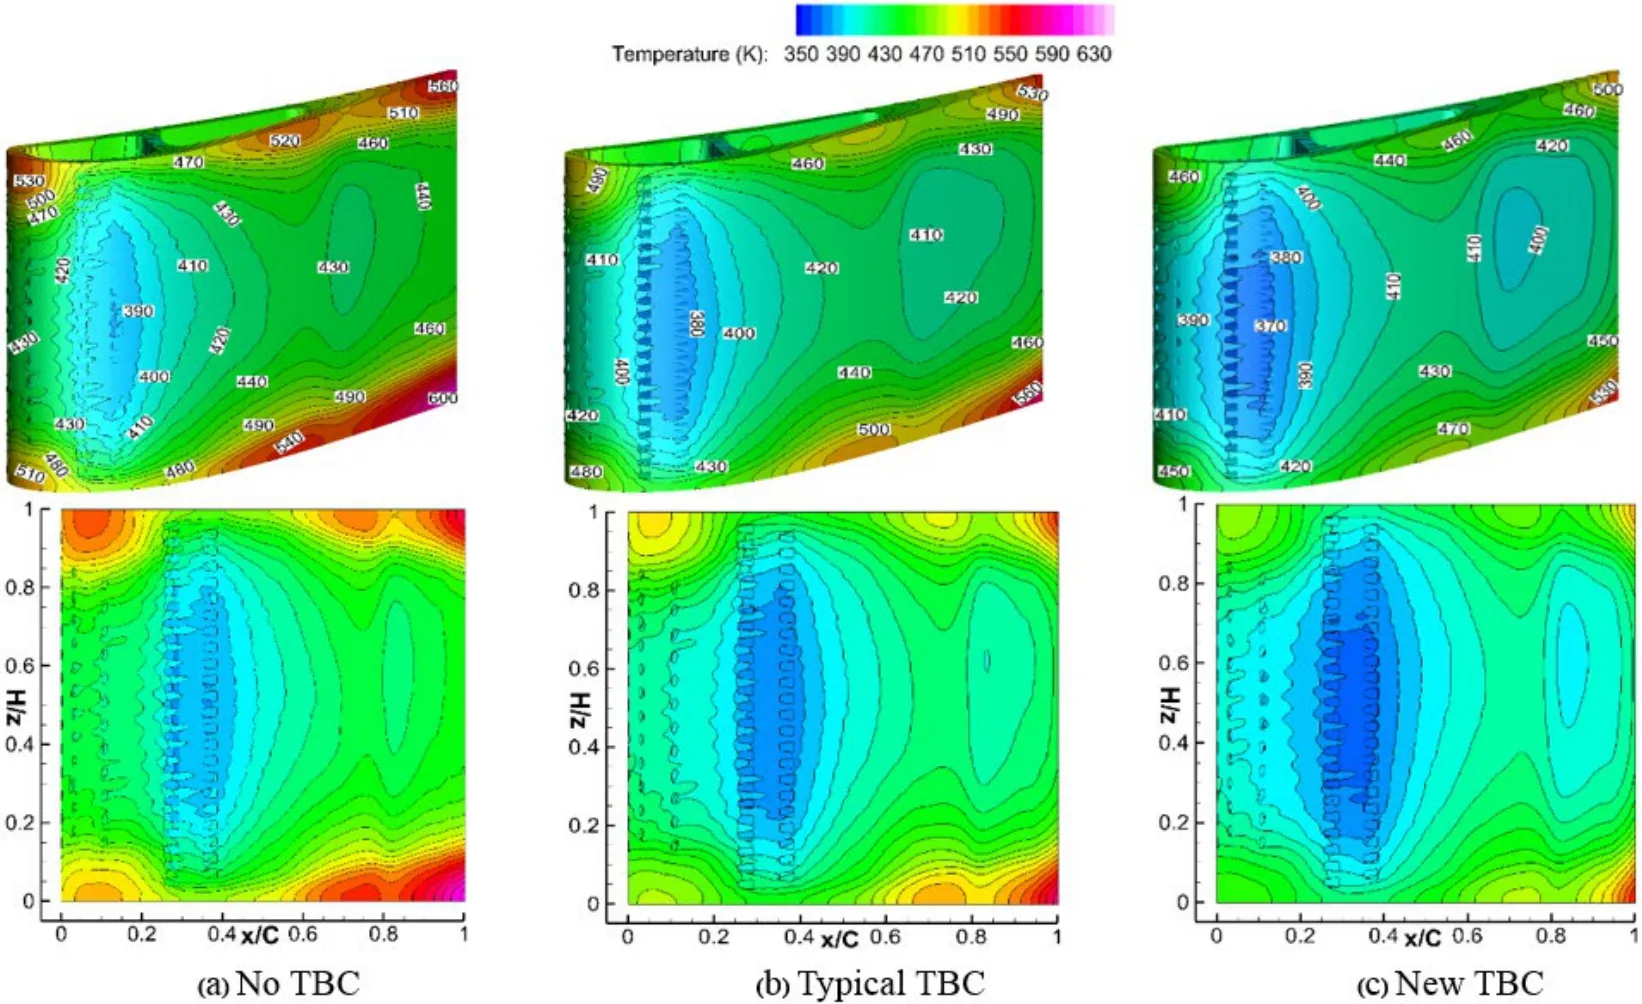
Figure 8:External surface temperature distributions on SS vane material at Tu=3.3%

Figure 9:External surface temperature distributions on PS vane material at Tu=10%

Figure 10:External surface temperature distributions on SS vane material at Tu=10%

Figure 11:External surface temperature distributions on PS vane material at Tu=20%

Figure 12:External surface temperature distributions on SS vane material at Tu=20%
5.1.2 Surface temperature of thermal barrier coating
In order to reflect on how Tu and TBC affect the external surface temperature of the vane material,surface temperature distributions on the two TBCs are discussed,as shown in Figs.13-14.From the figures,one can observe that at each Tu,the TBC surface temperature distributions are similar to those of the adiabatic wall case as reported by[Zhang,Xu,Wang et al.(2015)],especially,when the new TBC(TBC2)is used.Additionally,the surface temperatures of the TBC2 are higher than those of the typical TBC(TBC1)in most parts of the surfaces for each Tu.This phenomenon happens because of higher thermal resistance of the TBC2.As a result,the external surface of the vane substrate with the TBC2 has the lowest temperature when comparing to the other cases,as seen previously in Figs.7-12.Besides,it is found that for both TBCs,the TBC surface temperatures increase with the level of Tu.This phenomenon is obvious on the PS because of the stronger sensitivity to Tu on the PS.Such phenomenon is more serious when Tu rises because the cooling air emitted from film holes on the PS is increasingly blended with hot mainstream at higher Tus.

Figure 13:TBC surface temperature distributions on PS(a)-(c)TBC1 and(d)-(f)TBC2

Figure 14:TBC surface temperature distributions on SS(a)-(c)TBC1 and(d)-(f)TBC2
5.2 Thermal sensitivity
As well known that accurate prediction of turbine temperature is very important,thermal parameters such as heat transfers coefficient have significant effects on the surface temperature which results in predicting thermal stress and thermal damage of turbine airfoils.In fact,several factors,e.g.,turbine inlet temperature,pressure gradient,and turbulence intensity,affect the thermal parameters. In this section,a study of effects of TBC and Tu variables which have great influence on a turbine vane with film cooling is conducted.Effects of the two variables are determined using the CHT/CFD analysis as mentioned previously in the boundary conditions.The discussion of the thermal sensitivity is divided into four parts,namely,(1)the percentage reduction of the external surface temperatures of the vane substrate,abbreviated by R as definition in Section 3,at midspan(2)the structural temperatures of the substrate at midspan,(3)the variation of the average vane temperatures and(4)the variation of the maximum vane temperatures.
5.2.1 Reduction of external surface temperature of vane substrate
The percentage reduction of the external surface temperatures of the vane substrate(R)at midspan where is usually used to be the vane representative is presented as shown in Fig.15.It is clear that for both TBCs,R distributions are similar to one another and at each Tu,R obtained by the new TBC(TBC2)is higher than that by the typical TBC(TBC1).Another observation is that R increases when the level of Tu increases,especially on the PS where is more seriously sensitive to Tu than the SS.The figure also indicates that the range of R increases,specifically,the TBC2 provides R from about 2.5% to 10.5%,while R obtained by the TBC1 is from about 1.1% to 6%.These can be explained by the fact that because the thermal conductivity of the TBC2 is lower than that of the TBC1.Another reason is that the TBC2 may lead to more reduction in heat transfer coefficient(HTC)than the TBC1 for all Tus,as shown in Figs.16-18.The HTC is calculated by HTC=q/(T∞-Tw)where q is heat flux.The positive value means that heat transfers from the fluid to the solid and the negative value means that heat transfers from the solid to the fluid.

Figure 15:Reductions of substrate material temperature at midspan

Figure 16:Heat transfer coefficient distributions at midspan at Tu=3.3%

Figure 17:Heat transfer coefficient distributions at midspan at Tu=10%

Figure 18:Heat transfer coefficient distributions at midspan at Tu=20%
Besides,contours of heat flux at the lowest and highest Tus are presented in Figs.19-20.
The contours indicate that these phenomena suggest that in general the thermal sensitivity to the external surface temperature of the vane substrate is more dampened by using a lower thermal conductivity of TBC.This leads to the higher difference between the thermal conductivity of the vane substrate and TBC,and the decrease in heat transfer.
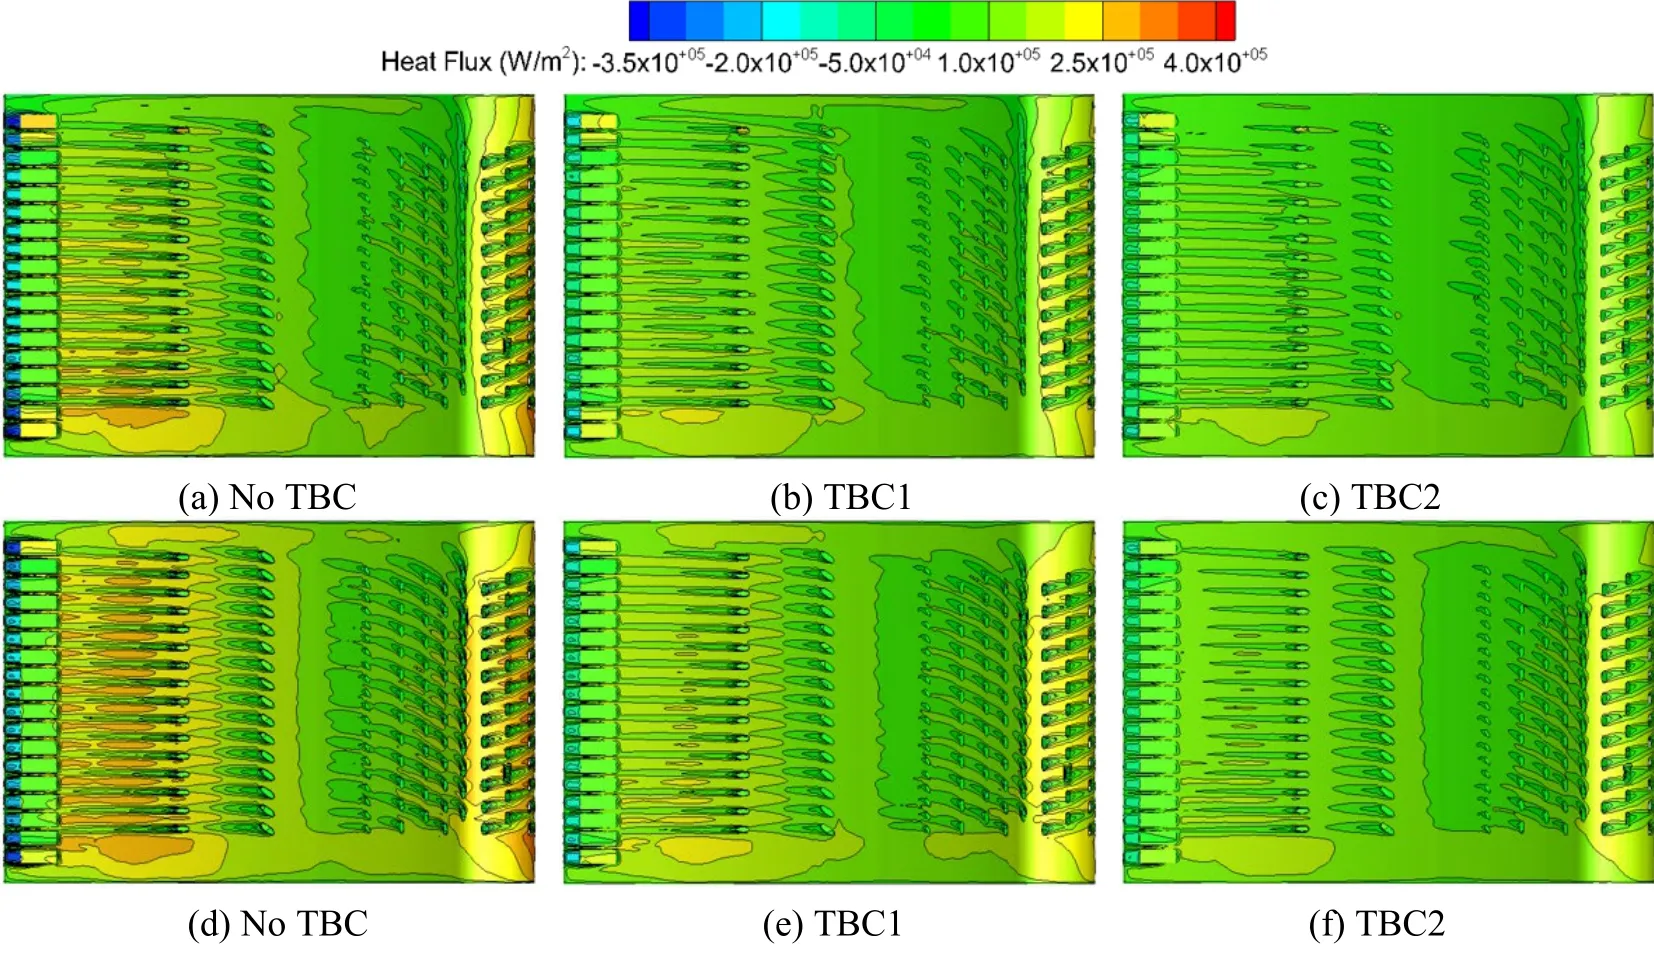
Figure 19:Heat flux distributions on PS at(a)-(c)Tu=3.3% and(d)-(f)Tu=20%
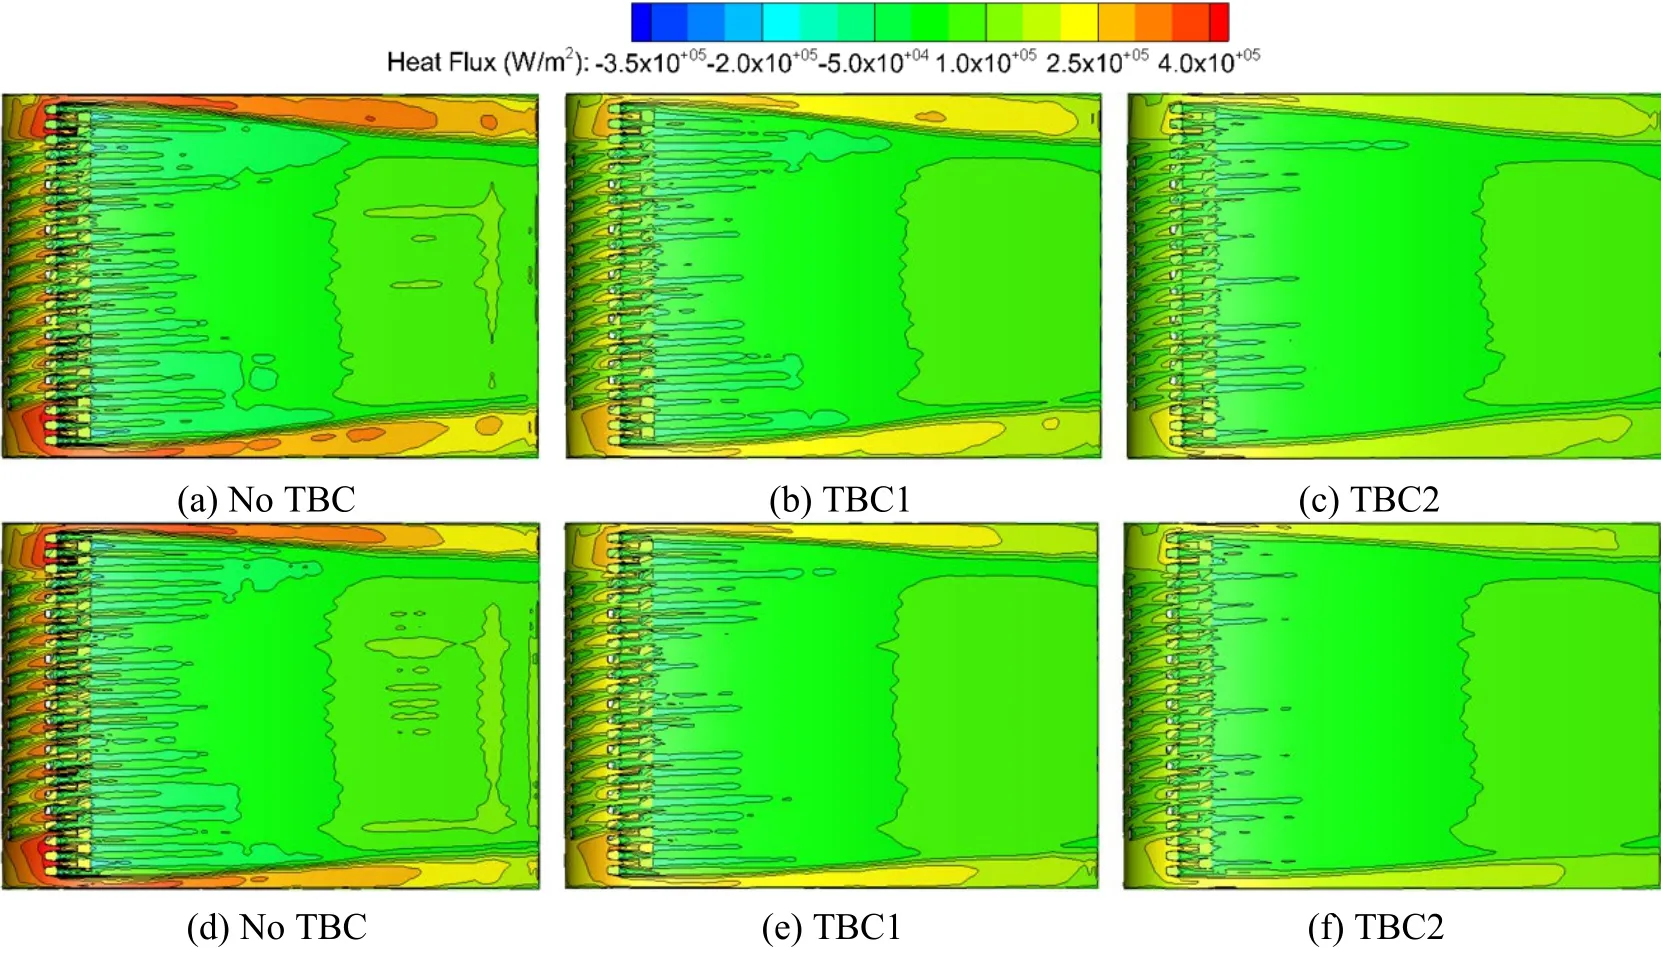
Figure 20:Heat flux distributions on SS at(a)-(c)Tu=3.3% and(d)-(f)Tu=20%
5.2.2 Structural temperature
Contours of the structural temperatures at midspan are used to indicate the effects of TBC and Tu by means of CHT/CFD analysis,as presented in Fig.21.
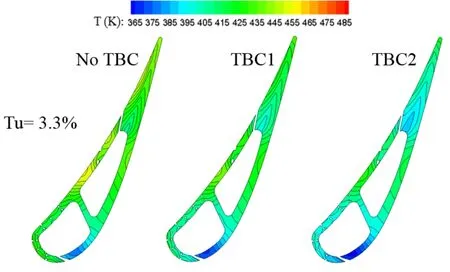
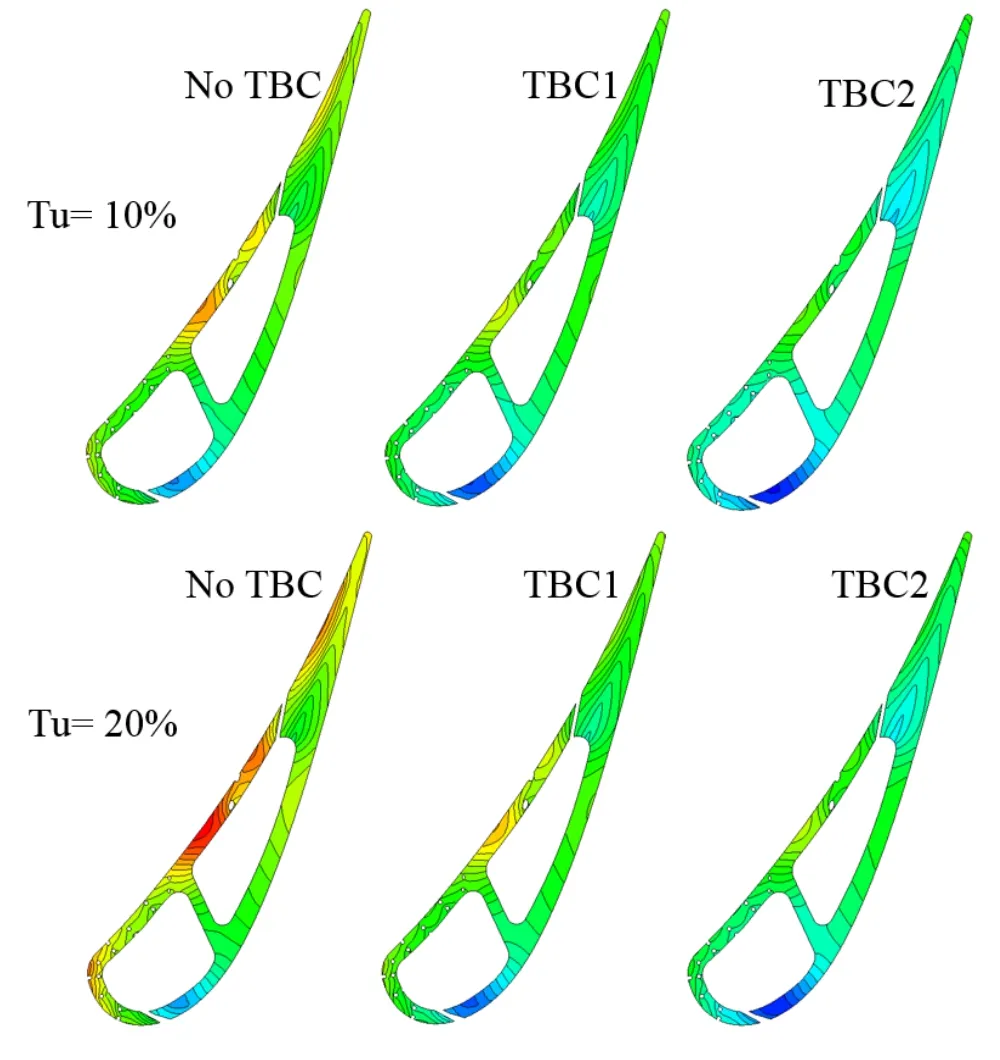
Figure 21:Structural temperature distributions at midspan
It is found that all distributions of the structural temperatures relate to the external surface temperatures of the vane material shown previously.It is clear that the lowest structural temperatures always happen at the downstream region of the diffusion shaped holes,row R1 and R2,on the SS because that region has the lower pressure and is cooled by the cooling air from a larger number of film holes.This causes not strong effects of Tu and TBC on R and HTC at that location,as shown in Figs.15-18.Meanwhile,the highest structural temperatures do not happen at the stagnation in the LE because the LE is cooled by the cooling air provided by a large number of film holes there.Yet,the highest structural temperatures always happen at the downstream region on the PS where is located between the film-hole row R10 and R11.Oppositely,at that downstream region the effects of Tu and TBC on R and HTC are serious.Besides,the more uniform structural temperatures are obtained by using the TBC2.This corresponds to the temperature distributions on the external surface of the vane substrate.
5.2.3 Variation of average vane temperature
The variation of the average vane temperature is evaluated by the reduction of the average vane temperature.Fig.22(a)plots the reductions of the average vane temperatures with the thermal conductivity of the materials under the effects of Tu.The abscissa of the figure is ordered from the lowest thermal conductivity to the highest thermal conductivity,namely,from the new TBC(TBC2),the typical TBC(TBC1)to the steel(vane material).However,it is not scaled because the thermal conductivity of the steel and the TBC2 varies in the range of temperature from 300 to 800 K.With using the uncoated vane as the reference for all Tus,the figure indicates that the TBC2 leads to the fall in the average vane temperature about 30 K at Tu=3.3%,and 36 K at Tu=20%.The reduction of the average vane temperature of the vane substrate coated with the TBC2 is more than that with the TBC1 for all Tus.This may be explained by the fact that the impedance of thermal load conducting through the TBC layer to the vane substrate surface coated with the TBC2 is higher than that with the TBC1 due to the higher thermal resistance of the TBC2.Therefore,it causes higher temperatures on the surface temperature of the TBC2,as previously seen in Figs.13-14.However,both TBCs can be more effective at higher Tus.Fig.22(b)shows that when using Tu=3.3% as the reference and Tu increases from 3.3% to 20%,the TBC2 protects the vane material most effectively,namely,only about 9 K of the increment in the average vane temperature happens when Tu changes from 3.3% and goes up to 20%.This indicates that the lower thermal conductivity of TBCs,especially the TBC2,can reduce the average vane temperature even though the augmentation of heat flux between hot gas and the vane surface is caused by Tu.It seems that this difference is not much dramatical,but it can prolong life time of the turbine vane.
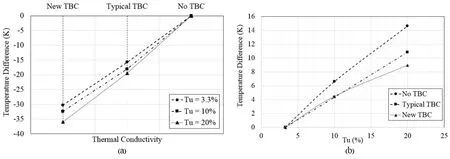
Figure 22:Reduction of average temperature versus(a)thermal conductivity and(b)Tu
5.2.4Variation of maximum vane temperature
In case of the uncoated vane,the vane material is not protected by the TBC layer,so the external surface of the vane material is the first region where gains thermal load from hot gas directly.Therefore,the maximum vane temperature should be located on the external surface of the vane material.However,although TBC is used to protect the vane material from contacting hot gas directly,the maximum vane temperature is still located on the external surface of the vane substrate,as shown previously in Figs.7-12.Similarly,Fig.23(a)plots the reductions of the maximum vane temperatures with the thermal conductivity of the materials at each Tu.Fig.23(a)points out that the new TBC(TBC2)decreases the maximum vane temperature about 55 K,while 30 K fall is caused by the typical TBC(TBC1).However,no matter the vane is coated with the TBC2 or the TBC1,the increment of Tu does not significantly affect the reduction of the maximum vane temperature.Fig.23(b)indicates that when the level of Tu increases from 3.3% to 20%,the reductions of the maximum vane temperatures are quantitatively similar to each other.This may imply that the reduction of the maximum vane temperature may be independent of the thermal conductivity of TBC.The reason may be explained by the fact that the reduction trends of the external surface temperatures of the vane material are similar to each other when Tu rises up.

Figure 23:Reduction of maximum temperature versus(a)thermal conductivity and(b)Tu
6 Conclusions
In this study,a numerical approach for the CHT/CFD analysis is used to investigate influence of TBC and Tu which affect heat transfer of the transonic vane with full film cooling.The vane is coated with the typical TBC(TBC1)or a candidate TBC(TBC2)and all simulations are conducted at Tu=3.3%,10% and 20%.The external surface temperatures of the vane material are compared,and then the TBC surface temperatures are considered.The results indicate the major role of the lower thermal conductivity of TBC which results in the lower and more uniform temperature on the external surface of the vane substrate.For the thermal sensitivity,it is discussed in terms of the percentage reduction of the external surface temperatures of the vane material and the structural temperatures of the vane material at midspan,including the variations of average and maximum vane temperatures.The results show that the thermal sensitivity to the external surface temperature of the vane substrate is more dampened by using a lower thermal conductivity of TBC which leads to the higher difference between the thermal conductivity of the vane substrate and TBC,the decrease in heat transfer and the more uniform temperature within the vane structure.The reduction of the external surface temperatures of the vane material obtained by the new TBC is from about 2.5% to 10.5%,while that obtained by the typical TBC is from about 1.1% to 6%.The results also indicate that both TBCs can have more effective protection for the average vane temperature at higher Tus.When Tu increases from 3.3% to 20%,the new TBC protects the vane material most effectively,namely,the average vane temperature increases only about 9 K when Tu changes from 3.3% to 20%.However,Tu does not significantly affect the reduction of the maximum vane temperature even though the new TBC,which has the very low thermal conductivity,is used.When Tu increases,it does not have a significant difference between the reductions of the maximum vane temperatures of the vane with TBCs and without TBC.
Acknowledgments:The authors would like to thank KMITL Research Fund of King Mongkut's Institute of Technology Ladkrabang for financial support under the program of Research Seed Grant for New Lecturer(Contract No.KREF186015).The first author would like to thank Professor Guowei Yang and Associate Professor Bo Yin,Institute of Mechanics,Chinese Academy of Sciences(CAS),for their extraordinary support.Additionally,the first author would like to express gratitude to Professor Jianhua Wang and Dr.Huazhao Xu,University of Science and Technology of China(USTC)for their support and guidance.
杂志排行

Computer Modeling In Engineering&Sciences的其它文章
- An Automated Approach to Generate Test Cases From Use Case Description Model
- Hybrid Deep VGG-NET Convolutional Classifier for Video Smoke Detection
- A Normal Contact Stiffness Model of Joint Surface Based on Fractal Theory
- Design of Smith Predictor Based Fractional Controller for Higher Order Time Delay Process
- Experimental Study and Finite Element Analysis on Ultimate Strength of Dual-Angle Cross Combined Section Under Compression
- IoT Based Approach in a Power System Network for Optimizing Distributed Generation Parameters