Ternary phase diagrams and solvate transformation thermodynamics of omeprazole sodium in different solvent mixtures☆
2019-03-20MeitangJinZhaoXuYingBaoLongLiLipingWangHaijiaoLuChuangXieHongxunHao
Meitang Jin,Zhao Xu,Ying Bao,*,Long Li,Liping Wang,Haijiao Lu,Chuang Xie,Hongxun Hao
1School of Chemical Engineering and Technology,Tianjin University,Tianjin 300072,China
2Collaborative Innovation Centre of Chemical Science and Engineering,Tianjin 300072,China
Keywords:Omeprazole sodium Solvate Phase equilibria Ternary phase diagram Chemical reaction Thermodynamics
A B S T R A C T Omeprazolesodium(OMS),atypicalnon-hydrogenbonddonorsAPI,isonlyavailableinsolvatessofar,including monohydrate,ethanol solvate and methanol solvate.The methanol solvate was found for the first time.Solvate transformation thermodynamics of OMS was studied in this paper.First,the ternary phase diagrams forming two solvates for OMS in binary solvent mixtures including methanol+water,ethanol+water,and methanol+ethanol were measured at temperature ranging of T=(278.15 to 313.15)K under atmospheric pressure.Further,the standard equilibrium constants of the solvate transformation reactions were evaluated accordingto the chemical reaction isothermal equation.The standard molar Gibbs free energy,the standard molar enthalpy,and the standard molar entropy of solvate transformation reactions were then calculated based on van't Hoff equation.Moreover,the thermodynamic stability of the OMS solvate was analyzed based on phase diagram.The results are of great importance to develop a crystallization process for manufacturing OMS solvate,and could be helpful to other solvate transformation research.
1.Introduction
Active pharmaceutical ingredients(APIs)are usually prepared as crystals due to its advantages in purity and chemical stability.Solvates(including hydrates)are common forms of drug crystals[1-3].It has been reported that about 85,000 compounds are able to form solvates[4].APIswhichareshortof hydrogenbonddonors tendtoformsolvates[5,6].
Omeprazolesodium(OMS,C17H18N8NaO3S,Fig.1)isoneofthemost essential potent non-reversible inhibitors of the gastric proton-pump H+/K+-ATPase.It serves as an effective and widely used drug worldwide in the treatment of acid peptic disorders over the past decade[7].As OMS molecule contains no conventional hydrogen bond donors,crystalline OMS is only available in solvates so far,including the commercial form of monohydrate(CAS No.95510-70-6)and ethanol solvate[8].In our research,two new crystal forms of OMS including methanolsolvate[9]and1,2-propyleneglycolsolvate[10]werediscovered.The stability of different solvates and the transformation between them are crucial to both manufacturing and storage.The solvate transformation is determined by the solid-liquid phase equilibrium and the chemical reaction equilibrium.However,there is a lack of information on both phase diagrams of OMS in solvent mixtures and the thermodynamic properties of OMS solvate transformation reaction.
In this work,firstly the ternary phase diagrams of OMS in binary solvents mixtures of methanol+water,ethanol+water,and methanol+ethanol were determined at different temperatures under atmospheric pressure.Secondly,the OMS solvate transformation was investigated.The standard equilibrium constant and the standard molar thermodynamic properties of OMS solvate transformation reactions were calculated based on van't Hoff equation.On the basis of the above results,the thermodynamic stability of the OMS solvate was analyzed.
2.Theory
2.1.The thermodynamics of solvate transformation
Thesolvatetransformationswereusuallyregardedaschemicalreactions[11-18].Thetransformationamongmethanolsolvate,ethanolsolvate,and monohydrate are represented by the following reaction equations,


Fig.1.Chemical structure of OMS.

The formation of OMS methanol solvate from monohydrate crystals istakenasanexampletoillustratethethermodynamicequationsdueto their similarities.When the solvate transformation of Eq.(1)is in equilibrium,the standard equilibrium is constant.

where αW,αMare the thermodynamic activities ofwater andmethanol,respectively,and subscript E represents the equilibrium state of solvate transformation reaction Eq.(1).
van't Hoff equation gives the relationship among(J·mol−1)or,the standard molar enthalpy(J·mol−1),and the standard molar entropy(J·mol−1·K−1),of the transformation reactions,
where R(J·mol−1·K−1)and T(K)are the universal gas constant and kelvin temperature,respectively.(J·mol−1)and(J·mol−1·K−1)are regarded as constants due to similar components and narrow temperature range.According to Eq.(6),the plot ofversus T−1yields a straight line with a slope given byas well as a y-intercept given by
2.2.Calculation of the solvent activities
The solvent activities of the solvent mixtures,as well as the temperature and pressure,are the determinant factor of the stability of different solvates.Under a certain temperature and pressure,the thermodynamicsstabilityofthesolvatescanbedeterminedbasedonthesolventactivitiesofthesolventmixtures[1,19-23].Itiswellknownthatthe dissolveddruginthesolventmixturesinfluencesthesolventactivitiesto a much smaller extent when the concentration of the dissolved drug is not high[13,24,25].The three investigated ternary systems are consideredquasi-binarysystemsbyignoringtheinfluenceofOMSontheactivitiesofsolventsduetolowOMSmolefractionwhenthesolventactivities are calculated.Therefore the values of the activity coefficients in methanol+water,ethanol+water,and methanol+ethanol solvent mixtures at different temperatures can be obtained by the Non-Random Two Liquid(NRTL)equations(Eqs.(7)-(12)),the parameters of which have been reported previously and are listed in Table 1.

In the above equations

where x and γ are the mole fraction and the activity coefficient of the solvent,respectively.Thesubscripts1and2representsolvent1andsolvent 2.a12is a nonrandom parameter between solvent 1 and solvent 2.g12(J·mol−1)=g21(J·mol−1)is the interaction energy between the two solvent molecules.g11(J·mol−1)and g22(J·mol−1)are the solvent interaction energies of pure solvent 1 and pure solvent 2,respectively.Based on the activity coefficients,the activities of the solvents can be given as:
where α1and α2are the activities of the solvent 1 and solvent 2.
3.Experimental
3.1.Materials
OMS monohydrate(purity>99.85%)was purchased from Hubei Widely Chemical Technology Co.,Ltd.,Hubei,China.Methanol and ethanol were purchased from Tianjin Kewei Chemical Co.Ltd.,China.All the solvents are of analytical reagent grade(purity>99.5%).Deionized water was prepared using a Millipore system(Beijing Oriental Science and Technology Development Ltd.).
3.2.Preparation of OMS methanol solvate and OMS ethanol solvate
3.2.1.Methanol solvate
At T=298.15 K,about 2.4 g OMS monohydrate and 10 mlmethanol were mixed in a jacketed vessel(50 ml).The slurry was agitated by magnetic stirrer for 8 h for transformation.Afterwards,the OMS methanol solvate was obtained by filtration and dryingatroom temperature.

Table 1 NRTL equation parameters of the three binary systems[26]
3.2.2.Ethanol solvate
At T=298.15 K,about 7.5 g OMS monohydrate and 10 ml ethanol were mixed at 298.15 K in a jacketed vessel(50 ml).The slurry was agitated by magnetic stirrer for 8 h for transformation.Afterwards the OMS ethanol solvate was obtained by filtration and drying at room temperature.
3.3.Characterization of OMS solvates
X-ray powder diffraction(XRPD)data were collected on a D/MAX-2500 diffractometer using Cu-Kα radiation(λ =0.154056 nm).Samples were measured in the 2θ range of 2°to 40°with a step size of 0.02°and at rate of 8(°)·min−1.
Thermal gravimetric(TG)data was obtained by Mettler-Toledo TGA 1/SF.5-10 mg samples were heated from T=(298.15 to 523.15)K at heating rate of 10 K·min−1.
Differential scanning calorimetry(DSC)measurements were performed on a DSC 821(1/500,Mettler-Toledo,Switzerland).The instrument was first calibrated using indium and the precision of temperature was±0.3 K.Samples(5 to 10 mg)were put in aluminum DSC pans and scanned at heating rate of 10 K·min−1over the temperature range of T=(298.15 to 523.15)K.
The crystal habit was observed using an optical microscope(BX51 Olympus).
3.4.Measurement of ternary phase diagrams
According to the phase rule[13,27],the freedom degree of a ternary system at constant temperature and pressure is written as.

where F and P refer to the degree of freedom and the number of the phase respectively.For a ternary phase diagram containing two completely miscible solvents,there are two kinds of(liquid+solid)regions.Oneisliquid+onesolidphase,i.e.F=1.Anotherisliquid+two solid phases,i.e.F=0.For the former,the phase region is defined by a solid point and a solubility curve of the corresponding solid phase.For the latter,the phase region is determined by two single solid points and an invariant point which is obtained by linking two solubility curves.Examples of the ternary phase diagram forming two kinds of solvates[28]are given in Fig.2.So the ternary phase diagrams can be determined by two steps.Firstly,identify the solid phase in equilibrium and confirm the phaseregionsin the phasediagram.Secondly,measure the solubility curve of the single solid phase.
3.4.1.Determining the phase regions in the diagram
To detect different equilibrium solid phase inthe diagrams,a series of preliminary experiments were implemented.Ternary system of OMSMethanol-Waterwastakenasanexample.Aseriesofwater+methanol mixtures with different water/methanol ratios ranging from 0 to 1 were prepared and mixed with different amounts of OMS monohydrate inflat bottom flasks(50 ml).Then,the flat bottom flasks were put into a shaking bath(HNY-200B,Tianjin Honor Instrument Co.Ltd.,China)at the experimental temperature for 8 h to reach equilibrium.After filtration,the wet solid was sampled for XRPD analysis and the solid,after being dried,was analyzed by DSC and TG to determine the solid phase.The procedures of the preliminary experiments of OMS-Ethanol-Water system and OMS-Methanol-Ethanol system were the same to that of OMS-Methanol-Water system.The preliminary experimental results indicated that there are three kinds of equilibrium solid phases for all three of these ternary systems.They are two pure solvates and the mixture of them.The phase diagram was similar to Fig.2(b).The raw data of the preliminary experiments are displayed in the Tables S1-S3.
3.4.2.Measurement of solubility curves in phase diagram
The solubility curves of different solvates were measured using dynamic method under atmospheric pressure[29-34].Pre-weighed solvents were mixed with known amount of solid solute in jacketed glass vessels(50 ml)at fix temperature which was controlled using circulating water bath(CHY1015,Shanghai Shunyu Hengping Scientific Instrument Co.Ltd.,China)with an accuracy of±0.1 K.A laser beam penetrating the vessels was used to monitor the dissolution process.The laser intensity reached maximum when the solid dissolved completely.After that,small amount(less than 1%of the dissolved fraction)of solid with known weight was added into the solution.Repeat adding small amount of solid until the laser intensity cannot return to the maximum.The solubility can then be calculated based on the total amount of solid.For each point,the above measurement was repeated for 3 times.The solid and solvent were weighed by an electronic analytical balance(AL204,Mettler-Toledo,Switzerland)with an accuracy of±0.0001 g.The solubility data are available in the Supplementary Information and displayed in the Tables S4-S6.The component compositions at the invariant points are given in Tables S7-S9.
4.Results and Discussion
4.1.Characterization of the OMS monohydrate,OMS methanol solvate and OMS ethanol solvate

Fig.2.Schematicoftwotypicalternaryphasediagramscontainingtwocompletelymisciblesolventswith(a)andwithout(b)API-solutionregion.S1,S2,AS1,AS2,andAPIrepresentsolvent 1,solvent 2,API solvate 1,API solvate 2 and non-solvate,respectively.

Fig.3.The microscope photo of OMS crystals obtained by suspending monohydrate in methanol.
The crystals obtained by slurry experiment in methanol are blocklikeasshowninFig.3.ItsXRPDpatterninFig.4showsthecharacteristic peaksat2θof5.7°,11.04°,17.06°and22.62°,whichareobviouslydifferent from that of the OMS monohydrate.There are also distinct differences of the characteristic peaks between the patterns of OMS monohydrate andthe crystals obtained by slurry experimentin ethanol whose characteristic peaks appear at 2θ of 5.68°,11.26°,12.18°and 22.58°.
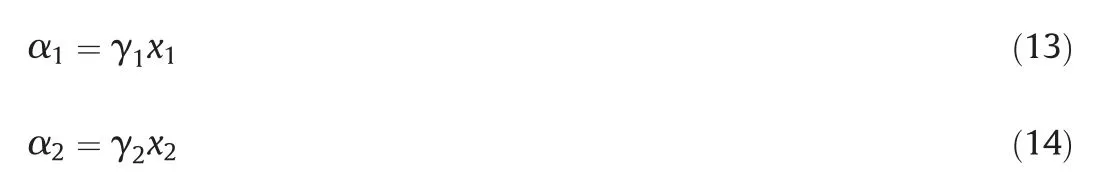
The TG curve of crystals obtained from methanol shows a weight loss of 8.13%(Fig.5).And DSC curve(Fig.6)has an endothermic peak at the corresponding temperature range,indicating that the crystal is a kind of OMS solvate.The DSC thermograms show an exothermic peak at T=485 K,which can be explained by the decomposition of OMS.The TG and DSC curves of crystals which were prepared from ethanol have similar characteristics.Assuming that the two kinds of crystals are OMS methanol solvate and OMS ethanol solvate respectively,andthestoichiometricratioofsolventtoOMSis1:1,thetheoreticalcontents of solvent were 8.01%and 11.13%respectively.Since they are in accordance with the results of the TG experiments,the two crystals canbeconfirmedasOMSmethanolsolvateandOMSethanolsolvaterespectively.The theoretical calculation value of water content of OMS monohydrate is 4.67%,which is also consistent with the measured value by TG.By the characteristic peaks of XRPD and the weight loss of the TG curves,the equilibrium solid phases of the preliminary experiments can be identified.

Fig.4.The XRPD patterns of a:OMS monohydrate,b:the crystals obtained by suspending OMS monohydrate in ethanol,c:the crystals obtained by suspending OMS monohydrate in methanol.
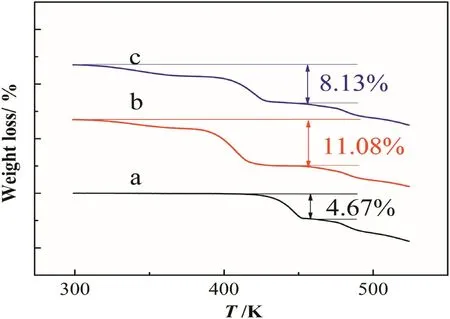
Fig.5.The TGA curves of a:OMS monohydrate,b:the crystals obtained by suspending OMS monohydrate in ethanol,c:the crystals obtained by suspending OMS monohydrate in methanol.
4.2.Ternary phase diagrams
From the OMS-Methanol-Water ternary phase diagram in Fig.7,it can be seen that crystallization region of the OMS monohydrate is narrower than that of the OMS methanol solvate.With the increase of the temperature,the solubilities of the monohydrate and the methanol solvate increase.And the crystallization region of the monohydrate also becomes smaller and smaller as the water/methanol ratio at the invariant point increases,which suggests a greater chance to obtain the OMS methanol solvate at higher temperature.The ternary phase diagram of OMS-Ethanol-Water in Fig.8 is similar to that of OMS-Methanol-Water ternary system.The ternary phase diagram of OMS-Methanol-Ethanol is shown in Fig.9.The crystallization region of theOMS ethanol solvate is narrower than that of the OMS methanol solvate.And it becomes smaller and smaller with the increase of the temperature as the ethanol/methanol ratio at the invariant point increases.

Fig.6.The DSC curves of a:OMS monohydrate,b:the crystals obtained by suspending OMS monohydrate in ethanol,c:the crystals obtained by suspending OMS monohydrate in methanol.

Fig.7.Ternary phase diagram of OMS-Methanol-Water at temperatures range of T=(278.15 to 298.15)K.OS1and OS2represent OMS monohydrate and OMS methanol solvate,respectively.
4.3.Thermodynamic functions of the solvate transformation
The activities of the solvents at the invariant points of OMSMethanol-Water system are calculated by NRTL Eqs.(7)-(12).The molar fractions(OMS free)and the activities of the solvents are displayed in Table 2.As the temperature increases,the activity ratio of water/methanol increases.The data of the other two systems is displayed in Tables S10-S11.On the basis of the activities of thesolvents at the invariant points,andof reaction Eqs.(1)-(3)were obtained by Eq.(4)-(6).Theandof reaction Eqs.(1)-(3)were listed in Tables S12-S14.According to Eq.(6),fitting the lnand T−1data with liner equations givesandof the reactions Eqs.(1)-(3).The results are listed in Table 3.It can be seen thatofbothreactionsEq.(1)andEq.(2)arebothgreaterthanzero,indicating thattheforwardreactionsareendothermic.Withtheincreaseoftemperature,the chemical equilibrium moves toward the positive direction accordingtoLeChatelier'sprinciple.Coupledwiththeincreaseofsolubility,the crystallization region of the monohydrate becomes smaller.In addition,of both reactions Eq.(1)andEq.(2)are both positive,implying that the formations of methanol solvate and ethanol solvate from monohydrate are entropy-driving processes[13].

Fig.8.Ternary phase diagrams of OMS-Ethanol-Water at temperatures range of T=(278.15 to 313.15)K.OS1and OS3represent OMS monohydrate and OMS ethanol solvate,respectively.
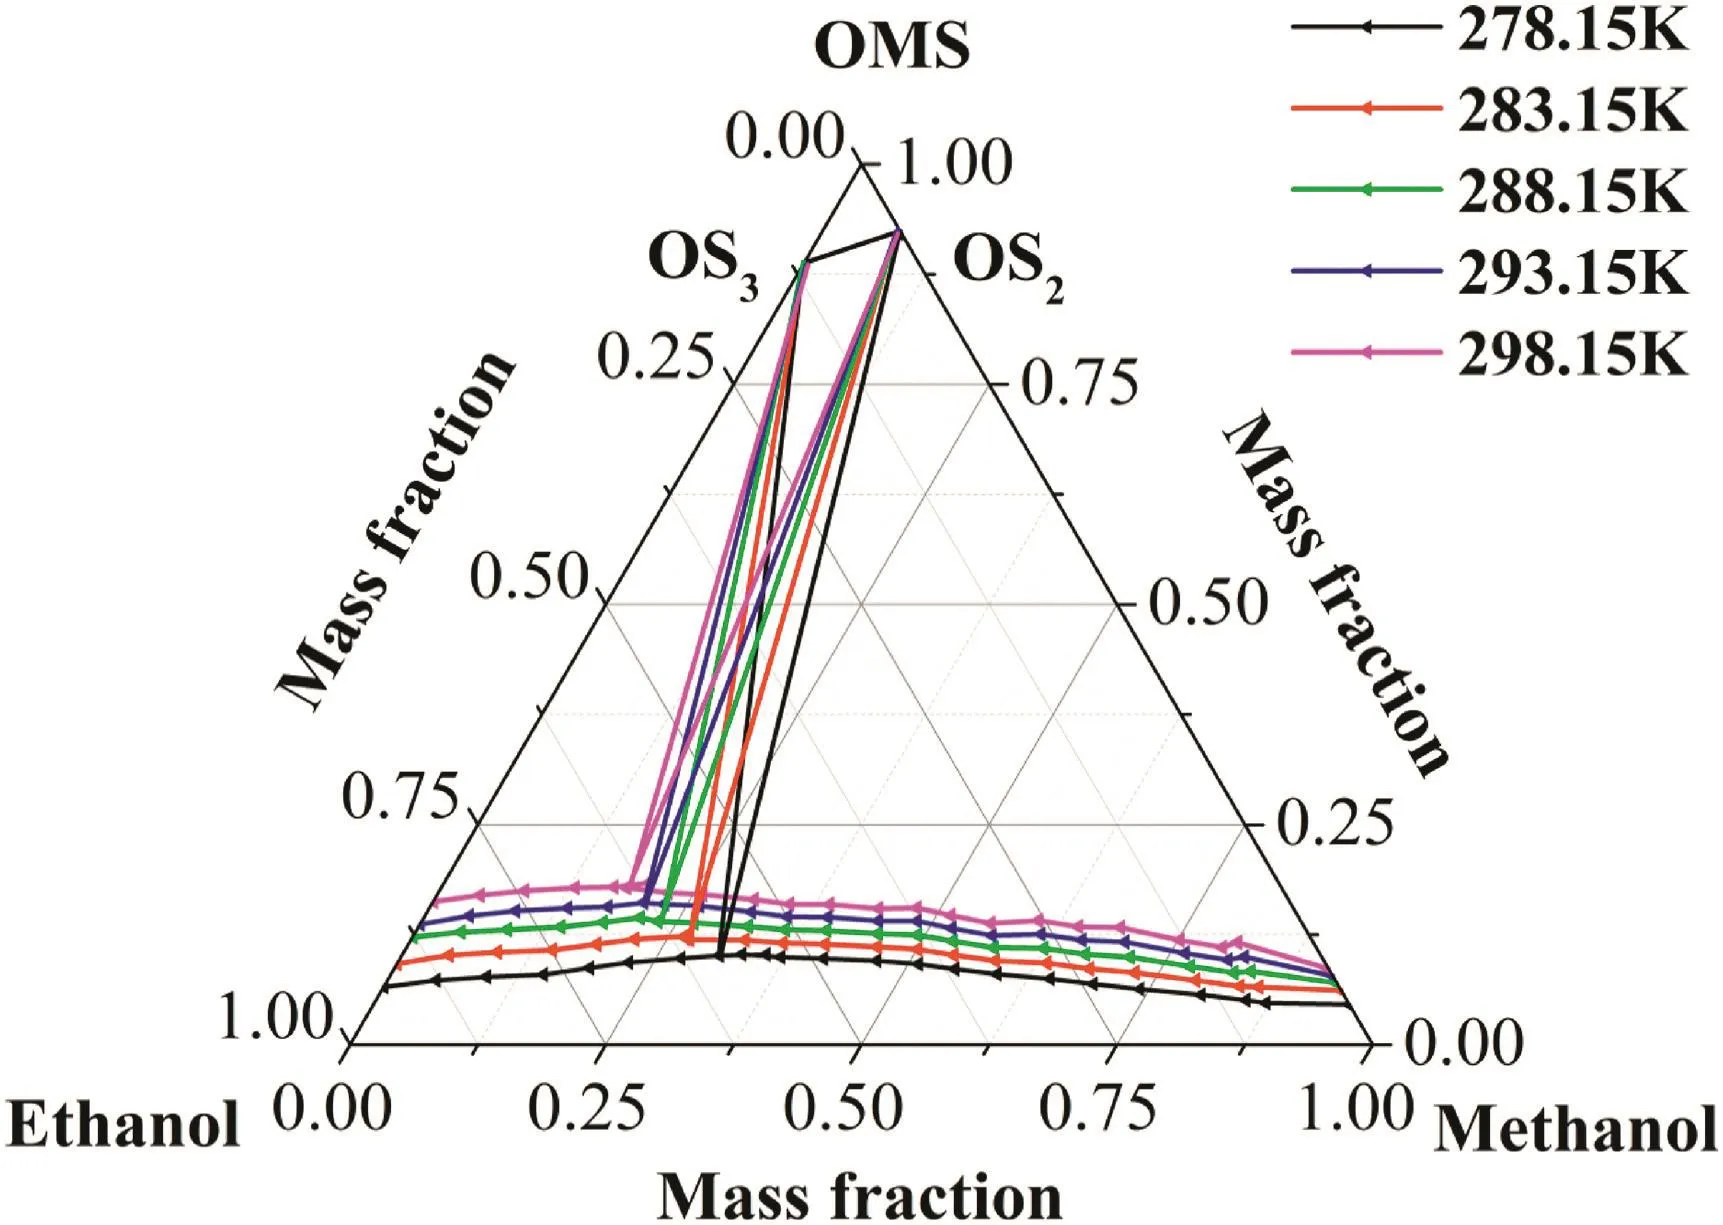
Fig.9.Ternary phase diagrams of OMS-Methanol-Ethanol at temperatures range of T=(278.15 to 298.15)K.OS2and OS3represent OMS methanol solvate and OMS ethanol solvate,respectively.
The linear relations[12,13]of Eqs.(1)-(3)between lnand T−1which are known from Eq.(6)are displayed in Figs.S1-S3 of the Supplementary Information.And the slope,intercept,andof the reactions Eqs.(1)-(3)are listed in Table 3.
4.4.Thermodynamics analysis of the OMS solvates transformation
Due to the similarity of the three ternary systems,the ternary phase diagram of OMS-Methanol-Water system at 278.15 K is taken as an example,as shown in Fig.10.Point I is the invariant point,and curve IF1and IF2represent the solubility curve of monohydrate and methanol solvate,respectively.In the phase region 1,the solvent activity ratio of the equilibrium liquidQα=,which means that the OMS methanolsolvateisthestableformandmonohydratewilltransformstomethanol solvate if monohydrate is added to this region.In the phase region 4,Qα>,the OMS monohydrate is the stable form and methanol solvate transforms to monohydrate.In the two regions,although the solid-liquid phase equilibrium can reach,the equilibrium of thetransformation between the solvates has not achieved.In the phase region3,theQαoftheequilibriumliquidoftheinvariantpointIisequalto,which implies that the monohydrate and methanol solvate will still coexist if more monohydrate or methanol solvate is added to the phase region 3.In this region,both the solid-liquid phase equilibrium and the transformation reaction equilibrium of the solvates have achieved becausetheequilibriumliquidcompositionofthesolid-liquidequilibrium is thesame asthat of the solvatestransformation.Itcanbeseen that the ternary phase diagram with solvate formation is not only an intuitive representation of the solid-liquid phase equilibrium but also the chemical reaction equilibrium of solvates transformation.Both these two equilibriums are important parts of thermodynamics and together determine the phase diagrams.

Table 2 The molar fractions(OMS free)and activities of methanol and water at the invariant points of OMS-Methanol-Water system(p=0.1 MPa)a,b
Table 3 The slope,intercept,(kJ·mol−1)and (J·mol−1·K−1)of reactions Eqs.(1)-(3)

Table 3 The slope,intercept,(kJ·mol−1)and (J·mol−1·K−1)of reactions Eqs.(1)-(3)
Reactions (1) (2) (3)Slope −2062.4966 −584.7353 1442.8430 Intercept 8.4982 2.8804 −5.4915 ΔrHm⊖/kJ·mol−1 17.15 4.856 − 12.00 ΔrSm⊖/J·mol-1·K-1 70.65 23.95 −45.66

Fig.10.Analysisofthesolvatethermodynamicstabilityusingtheternaryphasediagramof OMS-Methanol-Water system at T=278.15 K.The numbered areas refer to different equilibrium regions:1.OMS·MeOH+solution,2.OMS·MeOH+OMS·H2O+OMS,3.OMS·MeOH+OMS·H2O+solution,4.OMS·H2O+solution,5.solution.
5.Conclusions
Anew1:1OMSmethanolsolvatewasdiscoveredandverifiedforthefirst time.The ternary phase diagrams forming two solvates of OMS were measured experimentally at T=(278.15 to 313.15)K in binary mixed solvents of methanol+water,ethanol+water,and methanol+ethanol under atmospheric pressure.Only one invariant point exists in each investigated system.In both methanol+water and ethanol+water solvent systems,the solubility of OMS monohydrate increases and the crystallization region for OMS monohydrate decreases with increasing temperature.The thermodynamic properties of the solvate transformation reactions were calculated based on van't Hoff equation.It shows that the transformations from monohydrate to both methanol solvate and ethanol solvate are endothermic while the transformation of methanol solvate to ethanol solvate is exothermic.The thermodynamic stability of the OMS solvate was analyzed by the ternary phase diagram.This paper provides an original perspective to analyze and understand ternary phase diagrams with solvate formation by combining solid-liquid phase equilibrium and solvate transformation equilibrium.
Supplementary Material
The preliminary experiments data of OMS-Methanol-Water system(Table S1),the preliminary experiments data of OMS-Ethanol-Water system(Table S2),the preliminary experiments data of OMSMethanol-Ethanol system(Table S3),the raw solubility data of OMS monohydrate and OMS methanol solvate in the phase diagrams over temperatures rangeofT=(278.15 to298.15)K(TableS4),therawsolubility data of OMS monohydrate and OMS ethanol solvate in thephase diagrams over temperatures range of T=(278.15 to 313.15)K(Table S5),the raw solubility data of OMS methanol solvate and OMS ethanol solvate in the phase diagrams over temperatures range of T=(278.15 to 298.15)K(Table S6),the component compositions of OMS-Methanol-Water system at the invariant points(Table S7),the component compositions of OMS-Ethanol-Water system at the invariant points(Table S8),the component compositions of OMSMethanol-Ethanol system at the invariant points(Table S9),the mole fraction(OMS free)and activities of ethanol and water at the invariant points in the phase diagrams ofOMS-Ethanol-Water system(Table S10),the mole fraction(OMS free)and activities of methanol and ethanol at the invariant points in the phase diagrams of OMSMethanol-Ethanol system(Table S11),theandof reaction Eq.(1)(Table S12),and theandof reaction Eq.(3)(Table S14),the linear relations of Eqs.(1)-(3)betweenand T−1(Figs.S1-S3)are available in theSupplementaryInformation.Supplementary data to this article can be found online at https://doi.org/10.1016/j.cjche.2018.07.016.
杂志排行

Chinese Journal of Chemical Engineering的其它文章
- Review on application of nanoparticles for EOR purposes:A critical review of the opportunities and challenges
- Drawdown mechanism of light particles in baffled stirred tank for the KR desulphurization process☆
- Optical inline analysis and monitoring of particle size and shape distributionsformultipleapplications:Scientificandindustrialrelevance
- Experimentalstudyofpowerconsumption,localcharacteristicsdistributions and homogenization energy in gas-liquid stirred tank reactors☆
- Molecular simulation of penetration separation for ethanol/water mixtures using two-dimensional nanoweb graphynes☆
- Chaotic characteristics of pseudoplastic fluid inducedby 6PBTimpellerin a stirred vessel☆