Optimization of the gas separation performance of polyurethane–zeolite 3A and ZSM-5 mixed matrix membranes using response surface methodology
2019-02-15HajarTaheriAfaraniMortezaSadeghiAhmadMohebEbrahimNasrEsfahani
Hajar Taheri Afarani*,Morteza Sadeghi*,Ahmad Moheb Ebrahim Nasr Esfahani
1 Department of Chemical Engineering,Tennessee Technological University,Cookeville 38501,United States
2 Department of Chemical Engineering,Isfahan University of Technology,Isfahan 84156-8311,Iran
Keywords:Response surface method(RSM)Mixed matrix membranes Analysis of variance(ANOVA)Optimum conditions
ABSTRACT In the present work,the response surface method software was used with five measurement levels with three factors.These were applied for the optimization of operating parameters that affected gas separation performance of polyurethane–zeolite 3A,ZSM-5 mixed matrix membranes.The basis of the experiments was a rotatable central composite design(CCD).The three independentvariables studied were:zeolite content(0–24 wt%),operating temperature(25–45°C)and operating pressure(0.2–0.1 MPa).The effects ofthese three variables on the selectivity and permeability membranes were studied by the analysis of variance(ANOVA).Optimal conditions for the enhancement of gas separation performances of polyurethane–3A zeolite were found to be 18 wt%,30 °C and 0.8 MPa respectively.Under these conditions,the permeabilities of carbon dioxide,methane,oxygen and nitrogen gases were measured at 138.4,22.9,15.7 and 6.4 Barrer respectively while the CO2/CH4,CO2/N2 and O2/N2 selectivities were 5.8,22.5 and 2.5,respectively.Also,the optimal conditions for improvement of the gas separation performance of polyurethane–ZSM 5 were found to be 15.64 wt%,30 °C and 4 bar.The permeabilities of these four gases(i.e.carbon dioxide,methane,oxygen and nitrogen)were 164.7,21.2,21.5 and 8.1 Barrer while the CO2/CH4,CO2/N2 and O2/N2 selectivities were 7.8,20.6 and 2.7 respectively.
1.Introduction
Membrane processes are commercially demonstrated technologies for the separation of processes.Each process needs its own special membrane material and structure,which must be compatible with the requested separation.Also,the yield of the process and the membrane performance should be high.Thus,the membranes should be prepared under optimized conditions for each process application in order to meet the desired requirements[1].
Polymeric membranes sufferfromthe trade-offbetween permeability and selectivity.This limitation can be overcome by the addition of inorganic fillers to form a mixed matrix membrane.These membranes can have both high permeability and selectivity compared to a nonmodified polymer.Mixed matrix membranes(MMMs)have gained attention these days,because these materials exhibited enhanced mechanical and/or gas permeation properties.Incorporation of inorganic fillers such as titania,silica,zeolite and carbon molecular sieves(i.e.porous or nonporous materials)into polymeric membranes have been investigated greatly in the previous works[2–9].The majority of these works involve embedding zeolites because of their pore size and their ability to separate molecules based on size and shape;this is named the molecular sieving effect of zeolites,which leads to high separation performance[10].Therefore,embedding zeolites as filler into polymer matrices may improve separation performance of polymeric membranes because of their high selectivity in comparison to pure polymers[10].
Marjani etal.investigated aboutthe effectofdifferentfeed pressures on polydimethylsiloxane(PDMS)membranes for gas separation.A mathematical model was expanded to calculate the permeation of gases through the PDMS membrane[11].Saedi et al.[12]studied the effect of different parameters during membrane preparation such as polymer concentration in casting solution,solvent type,evaporation time,coating polymer concentration and number of sequentialcoatings on selectivity of PDMS coated asymmetric polyethersulfone(PES)membranes.The results showed that as temperature increased in binary CO2/CH4,the permeability of CO2and CH4improved while CO2/CH4selectivity decreased.Sadeghi et al.[13]used TiO2nanoparticles to improve the gas separation properties of polyurethane;with increasing titania content,selectivity of CO2/N2,O2/N2and CO2/CH4increased,but the permeability decreased.Sadeghi et al.,studied the gas(CO2,CH4,O2and N2)transport properties of composite membranes prepared from polyurethane and epoxy nanoparticles[14].Epoxy addition caused permeability to decrease and selectivity to increase.Laghaei et al.[15]used MCM-41 particles to improve the CO2/CH4/N2/O2gas separation performance of PES membranes.The results showed severe reduction in the selectivity of different gas pairs in the MMM with 20 wt%calcined MCM-41.In contrast,the addition of each type of MCM-41 into the PES matrix resulted in higher gas permeation.MCM-41 loaded PES membranes had higher gas permeability compared to neat PES[15].
Pournaghshband et al.[16]used different chain extenders to study their effect on the phase separation and gas transport properties of PU and PUU membranes.The results showed that the existence of ethereal groups increased phase mixing.Phase separation and permeability of the PU and PUU membranes decreased with the existence of the ethereal linkages in the chain extenders.In contrast,the gas separation properties enhanced in the presence of diamine or longer chain extenders[16].Khosravi et al.[17]incorporated silica nanoparticles into PU membranes for separation of methane,ethane,and propane.The results revealed that in the silica loaded membranes permeability first increased,and then decreased.The enhanced gas permeability due to increasing silica content was attributed to the formation of active sites at the polymer-silica interface,in contrast,decline in the permeability by loading silica nanoparticles was attributed to creation of tortuous paths in membranes and reduction of gas diffusivity[17].
Response surface methodology(RSM)is a statistical method that uses quantitative data from proper experiments to determine multiple regression equations between the factors and experimental results[18].Shekarriz et al.[19]used response surface method to estimate the interaction and cross effects,and to find optimum process factors,when all the factors are changing simultaneously.
Rahmani et al.[20]used a combination of pristine and brominated matrimid o prepare modified membranes due to the fact that brominated matrimid membranes were too delicate.Modified membranes were much more permeable and less selective than pristine membranes.They attributed this to the rise in the fractional free volume of modified membranes.Xiangli et al.[18]used RSM to tailor preparation conditions for the PDMS/ceramic composite membranes.The results revealed that polymer concentration,crosslink agent concentration,and dip-coating time had significant impacts on the permeability and the selectivity.The regression models predicted by RSM were in accordance with experimental results[18].Ismail and Lai applied response surface method to optimize preparation circumstances for preparing defect-free asymmetric membranes[21].These membranes had selectivities even higher than selectivities for corresponding dense films.Azmier Ahmad et al.[22]applied response surface methodology to optimize preparation variable and investigate their effect on CO2/CH4selectivity.
Sadeghian et al.[23]used response surface method to optimize the operating variables(i.e.transmembrane pressure(TMP)and velocity).The results showed that experimental outcomes and model estimates were in accordance with each other.
Taheri Afarani et al.[24]used zeolites 3A,4A,and ZSM-5 to improve the gas(CO2,N2,O2,and CH4)transport properties of the polyurethane(PU)membrane[26].The results showed excellent improvement in permeabilities of all of gases and CO2/N2,CO2/CH4,and O2/N2selectivities by increasing zeolite content.In addition to improving the gas separation performance of the prepared mixed matrix membranes,we tried to optimize the operating variables:zeolite content(wt%),operating temperature(°C)and operating pressure(MPa).Tirouni et al.[25]studied the separation of gases(C2H6and C3H8from CH4)through polyurethane–zeolite(0.4 nm and ZSM-5).Zeolite loaded polyurethane membranes had higher permeability and selectivity compared to pure membrane[25].
Until now,no research had been done on using RSM to optimize the separation performance of polyurethane(PU)/zeolite membranes.Therefore,the purpose of this study is to investigate the effects of operating conditions on separation properties of mixed matrix membranes(MMMs).
2.Experimental
2.1.Material
Polypropylene glycol(PPG)with an average molecular weight of 2000 g·mol-1(Sigma-Aldrich)was dried at 80 °C under a vacuum for 48 h to remove any trace of water.1,4-butanediamine(BDA)was dried overa 0.4 nm molecular sieve prior to use.N,N-Dimethylformamide(DMF)was purchased from Merck and used as a solvent.The zeolite 3A was purchased from Merck,and ZSM-5 zeolite was purchased from the Saman Pajuhan Aria Gostar Co.(SPAG)in Science&Technology Park,located in Iran.CO2,N2and O2gases(purity 99.99%)used for the gas permeation tests were purchased from the Ardestan Gas Co.in Iran,while the CH4(purity 99.9%)was purchased from the Technical Gas Service Co.,Iran[26].
2.2.Polymer synthesis and membrane preparation procedure
The synthesis of polymer was described in detail in our recent work.Moreover,membranes were prepared by the dry phase inversion technique which was explained comprehensively in our previous work[24].The prepared membranes are presented in Table 1.

Table 1 Sample name of prepared membranes and their zeolite contents
2.3.Characterization
To characterize the prepared membranes,scanning electron microscopy(SEM)and Fourier transfer infrared spectroscopy(FTIR)analyses were performed.The obtained results were described in detail in our previous work[24].
2.4.Gas transport performance
The permeability and selectivity of the prepared membranes(pure PU and PU–zeolite membranes)were assessed for pure CO2,CH4,O2,and N2gases at different operating conditions of temperature and pressure.
2.5.Experimental design
Based on our previous studies we found that gas separation properties of mixed matrix membranes are most dependenton zeolite content(A),operating temperature(T,°C)and feed pressure(P,MPa)(i.e.the most important factors which we investigated here and represented in Table 2)[23,25].So,we studied the effect of these three variables in five levels on the gas separation performances of MMMs based on two types of the zeolites that we used in our previous work(i.e.zeolite 3A and ZSM-5),Table 3.For these aforementioned variables,we used eight factorial points,six axial points and six replicates at the center.Therefore,twenty experiments based on the above-mentioned conditions were performed on MMMs.The results obtained from permeability and selectivity of gases passing through mixed matrix membranes in 20 differentconditions are reported in Table 4 and Table 5,respectively.Moreover,permeabilities and selectivities are symbolized for further usage in the text and for ease of following and represented in the table(Table 6).The center points are used for the specification ofexperimental error and the repeatability of the results.The axial points are placed at(±α,0,0),(0,±α,0)and(0,0,±α)where α is the distance of the axial point from the center.The seven responses shown in 1–7 and 9–15 represent the permeability of gases(i.e.CO2,CH4,O2and N2)and their selectivities(i.e.CO2/CH4,O2/N2and CO2/N2).
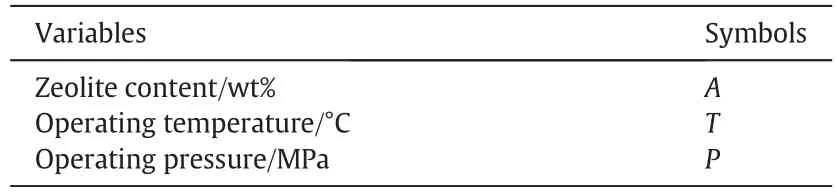
Table 2 Symbols of variables(factors)

Table 3 Independent variables and their coded levels

Table 6 Symbols of responses
By using the following generic model,a quadratic modelwas created from the CCD for each response as given in Eq.(1)[27–29]:


Table 4 Experimental design arrangement and results(for 3A zeolite)

Table 5 Experimental design arrangement and results(for ZSM-5 zeolite)
In this model,Y is the predicted response,Xi,Xj,…,Xkare the input variables which affectthe response Y,Xi2,Xj2,…,Xk2are the square effects,XiXj,XiXkand XjXkare the interaction effects,β0is the intercept,βi(i=1,2,…,k)is the lineareffect,βii(i=1,2,…,k)is the squared effect,and βij(i=1,2,…,k;j=i+1,…,k-1)is the interaction effect[27–30].
The Design Expert6.0 software was applied foranalysis ofthe experimental data.In this research CCD was utilized to probe the effective parameters on the gas separation performances of MMMs by fitting a quadratic surface,which is the common tool for process optimization.

Table 7 Condensability and kinetic diameter of studied gases[41,42]
3.Results and Discussions
3.1.Analysis of variance(ANOVA)
Tables(S1–S7)and(S8–S14)are the ANOVAtables for the selectivity and the permeability coefficients of 3A and ZSM-5 zeolites containing polymers respectively.The factors with a P-value lowerthan 0.1 demonstrate that model terms are significant,however values greater than 0.1,pointoutthatthe modelterms are insignificant.Therefore,for the model term to be significant at this confidence level the calculated probability should be lower than 0.05(“Prob > F”less than 0.05).In Tables(S1–S7)and(S8–S14),each response's model that has P-value<0.05 is the statistically significant terms.Therefore Y can be expressed in Table S15 in terms ofoperating parameters(i.e.temperature and pressure)and zeolite concentration.

Table 8 Optimization criteria at desired goal for the separation studies(for 3A zeolite)
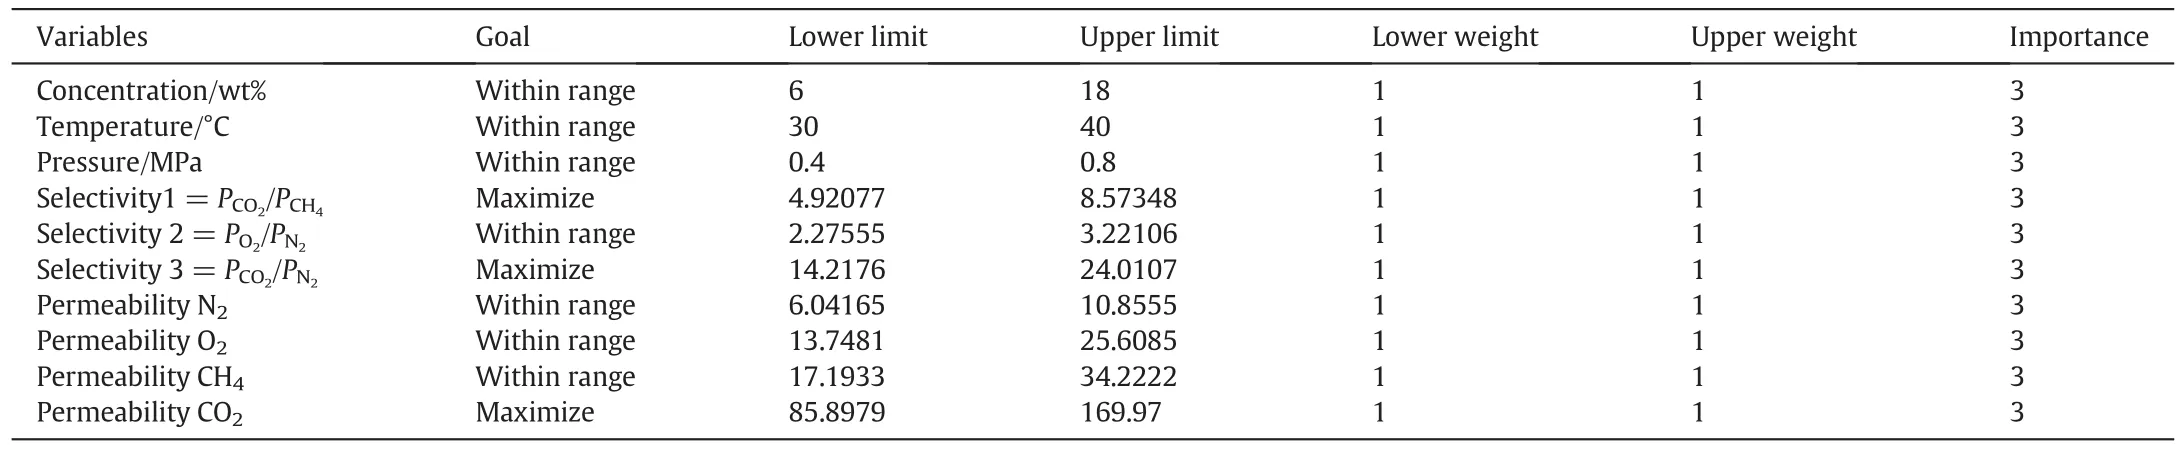
Table 9 Optimization criteria at desired goal for the separation studies(for ZSM-5 zeolite)

Table 10 Solutions for optimum operation conditions(for 3A zeolite)

Table 11 Solutions for optimum operation conditions(for ZSM-5 zeolite)
3.2.Effects of zeolite content,feed temperature and pressure on gas permeability and selectivity

Fig.1.3D surface plot(a)and contour plot(b)showing the effect of zeolite content,temperature and pressure on the response 1,Selectivity 1=P CO2/P CH4 for zeolite 3A.

Fig.2.3D surface plot(a)and contour plot(b)showing the effect of zeolite content,temperature and pressure on the response 2,Selectivity 2=P O2/P N2,for zeolite 3A.
Response surface method(RSM)wasused here in order to study the relationship between responses and input variables in a favored range.In order to obtain a function relationship,the three dimensional surface and contour plots werefitted.The three investigated factors were:zeolite content,operating temperature and operating pressure;analysis of variance(ANOVA)was used to investigate the main effects,the quadratic effects,and the interactions of the above-mentioned factors on the permeability and the selectivity of the membranes.The 3D surface and contour plots showing the effect of the aforementioned factors(i.e.zeolite content(A),operating temperature(T,°C)and operating pressure(P,MPa))on the permeability and the selectivity of gases through zeolites 3A and ZSM-5 which contained MMMs are presented in Figs.1–14,respectively.As shown in Figs.1 and 8,the CO2/CH4selectivity decreases with temperature,and selectivity reaches its maximum value as temperature and zeolite content reach their minimum and maximum values,respectively.It is apparent from Figs.4–7 and Figs.2–15 that the permeability of pure gases increased with temperature which could be attributed to an increase in the mobility of polymer chains and the fraction of free volume in membrane structure.Fig.2 shows that the selectivity increased by pressure in 6 wt%zeolite 3A containing polymer.While,at the constant pressure of 0.8 MPa with increasing the zeolite content,the same trend is observed more intensely.From Fig.2,it can be seen that the selectivity increases with the increase in zeolite content and pressure.From Figs.2 and 9 it can be observed that at a constant temperature,increasing the zeolite content causes the O2/N2selectivity to increase.The possible reason for this was that the increase in the zeolite content causes the formation of cavities with tiny pores which leads to a channeling phenomenon.As can be seen from Fig.2,increasing the temperature and pressure showed no effect on the selectivity when the zeolite content was held constant with the exception at 30°C and 0.4 MPa.This can be ascribed by the point that the permeability of non-condensable gases did not improve more than condensable gases.Thus,no significant changes in the selectivity of O2/N2with temperature and pressure were observed.In Fig.9,it can be observed that at a constant zeolite content of 18 wt%,the selectivity increases by pressure and selectivity also increases by zeolite content at 0.8 MPa pressure.It can be concluded that the selectivity increases by zeolite content and pressure.
Fig.3 showed that the lowest CO2/N2selectivity was obtained at 0.4 MPa and 6 wt%and the highest one was obtained at 0.8 MPa and 18 wt%.However as described before,the zeolite content is more effective than pressure on selectivity,which can be attributed to the molecular sieve effect of zeolites.In this situation,the hybrid membrane prevents the permeation of larger gas molecules.Also from Fig.3,it was observed that the maximum selectivity of CO2/N2at constant pressure is achieved at the lowest temperature(30°C)and the highest percentage of zeolite content(18 wt%).This result clearly confirms the fact that the selectivity decreases with increasing the temperature.From Fig.3,it can be observed that the lowest selectivity of CO2/N2is at 30°C and of 0.4 MPa at a constant zeolite concentration of 12 wt%(i.e.the lowest temperature and pressure).Also,from Fig.10,it is obvious that the highest selectivity of CO2/N2is obtained at 30°C and 0.8 MPa.Increasing the pressure leads to an increase in the amount of gas in the polymer.Thus,condensable gases which have higher solubility in rubbery urethane polymer become more soluble and permeable.
As we know,change in the feed side pressure may cause great permeability variations.Pressure changes affect permeability in four types of patterns[31]:
(a)Linear,with slope approximately zero.This shows the ideal case thatis compatible with the hypothesis thatdiffusion and solution are independent of gas pressure(i.e.,low sorbing penetrants,such as He or N2in rubbery or glassy polymers).
(b)Almost linear increase of permeability with increasing pressure.This often explains the permeability ofan organic vapor into a rubbery polymer.
(c)Adecreasing trend ofpermeability with increasing pressure.This is typically observed in glassy polymers.
(d)Concave upwards.This can be supposed as a combination of(b)and(c),and is typical of a plasticizing penetrant such as organic vapor in a glassy polymer[31].

Fig.5.3D surface plot(a)and contour plot(b)showing the effect of zeolite content,temperature and pressure on the response 5 for zeolite 3A.
As seen in Fig.4,the pressure had a slight effect on the permeability of the nitrogen gas.It can be attributed to the ideal case(case(a)mentioned above)where diffusion and solution are independent of gas pressure.The pressure had little effect in comparison with temperature and zeolite content in Fig.11.Figs.4 and 11 showed that with increasing temperature,the nitrogen permeability increases which leads to an increase in molecular mobility of polymer chains.As we know,the configuration of the pore opening depends on different factors[32],such as shape of the T and O atoms in relation to each other,ratio ofSi/Al,size ofthe cations,location ofthe cations,and temperature.
Thus,based on the above description,temperature has a significant effect on size of the pore opening.Increasing the temperature causes the vibration of atoms in the ring to increase.This may cause a slightincrease in the size of the pore.Since the kinetic diameter of nitrogen is larger than the pore size of zeolite 3A,zeolite blocks the nitrogen molecules at extremely low temperatures.Therefore,as the temperature is increased,the lattice vibrations increase as well,and N2can now enter the zeolite[32].

Fig.6.3D surface plot(a)and contour plot(b)showing the effect of zeolite content,temperature and pressure on the response 6 for zeolite 3A.

Fig.7.3D surface plot(a)and contour plot(b)showing the effect of zeolite content,temperature and pressure on the response 7 for zeolite 3A.
From Figs.5 and 12,it can be seen that the highest permeability of the oxygen was at 40°C and 18 wt%of zeolite content.The diversion graph of response 5 shows that,in this case,temperature is the mostinfluential factor.This is due to an increase in molecular mobility of the polymer chains and also to an increase in gas solubility in the polymer molecules.It was observed that the zeolite content in the membranes has a higher impact than pressure.The highest oxygen permeability was at a pressure of 0.4 MPa and 18 wt%,respectively because the created channels cause an increase in permeability.Thus,the composite phase is controller[32].There were dramatic changes in the permeability of O2by pressure;this means that while the pressure increased,the oxygen permeability decreased and the molecular sieving of matrix(screening matrix)and selectivity of polymer increased.The effect of feed pressure is attributed to competing hydrostatic pressure and plasticization effects.High pressures increase the compaction in the polymer,thereby reducing its free volume and rate of diffusion.However,plasticization increases permeability due to the increase in penetrant solubility[33].Therefore,the decrease in permeability with increasing pressure can be attributed to the dominance of the static pressure of non-condensable penetrants over plasticization effects.In such a case with increasing the pressure,the free volume in the polymer matrix decreases and leads to reduction of the gas diffusivity.This condition is known as compaction or compression of the polymer matrix[33].Because the plasticization effect of oxygen gas is very low,the membrane compaction is governing and the membrane permeability will decrease due to an increase in gas pressure[34].

Fig.8.3D surface plot(a)and contour plot(b)showing the effect of zeolite content,temperature and pressure on the response 1 for zeolite ZSM-5.
Fig.6 showed the 3D plot and its equivalent contour plot of the effects of the zeolite loading,temperature,and pressure on the permeability of CH4when keeping operating pressure(0.6 MPa),zeolite content(12 wt%),and operating temperature(35°C)at the central level,respectively.From these figures it can be observed that the maximum permeability of the methane was at 0.8 MPa pressure and 18 wt%of zeolite contentwhile the lowestpermeability was at0.8 MPa pressure and 6 wt%of zeolite content.As mentioned before,the gas permeability increased with pressure when the plasticization effect is governing.Thus,higher permeability of methane at higher pressure can be attributed to the plasticization effect of methane gas.As shown in Fig.6,the maximum permeability of 32.5 was obtained when the operating temperature,zeolite content,and operating pressure were 40°C,18 wt%,and 0.8 MPa,respectively.In Fig.13,itis obvious thatthe highestpermeability of methane(32.9),was observed at a temperature of 40°C and zeolite concentration of 18 wt%.As seen in Fig.13,the permeability of methane increased by zeolite content at constant temperature and pressure,which can be attributed to higher segmental mobility of polymer chains[32].

Fig.9.3D surface plot(a)and contour plot(b)showing the effect of zeolite content,temperature and pressure on the response 2 for zeolite ZSM-5.

Fig.10.3D surface plot(a)and contour plot(b)showing the effect of zeolite content,temperature and pressure on the response 3 for zeolite ZSM-5.
The effects of the zeolite content,temperature and pressure on the permeability of CO2are clearly presented in Figs.7 and 14.As mentioned before,some penetrants such as carbon dioxide have a tendency to reduce rigidity of polymers and therefore to plasticize or swell polymers,which lead to an increase in chain motions and permeability.Therefore,when the most in fluential effect is the plasticization effect,permeability increases with pressure[34].From Fig.7,it can be seen that the highest permeability of CO2was at a zeolite content of 18 wt%and pressure of 0.8 MPa.This is reasonable,because the plasticization and swelling ofmembrane which is due to adsorption ofpenetrantmolecules,increases the gaps between polymer chains and therefore the penetrant moves through the polymer matrix easier.This is in accordance with previous descriptions that a higher permeability can be achieved at a higher feed pressure because of the enhanced diffusivity through the membrane[34].From this figure it is observed that CO2permeability significantly increased with increasing pressure,leading to an increase in selectivity of CO2/N2.In the case of ZSM-5 zeolite,however,the permeability of CO2decreased with an increase in pressure,as shown in Fig.14.From this figure,it is obvious that at 18 wt%and 30°C,with increasing pressure from 4 to 0.8 MPa,pressure decreased from 167 to 154.This phenomenon is related to the effect of pressure on the interactions between the dispersed phase and the rigidified interfacial matrix chain layer in mixed matrix membranes which describes the decrease in the mobility of chains and why the polymer chains turned to a glassy form leading to the reduction of the permeability of gas through MMMs.It can be seen from Figs.7 and 14 that the permeability of carbon dioxide increases sharply with temperature increases.This observation is typically,due to an increase in the mobility of polymer-segment which creates the free volume of polymeric networks to make the transport of permeates easier[35].As mentioned before[32],by increasing the temperature,the vibration of atoms in the ring increased.Thus,this results in an increase in the size of the pore and higher absorption of gases and eventually leads to an increase in the permeability of gases.
Because of high condensability and low molecular size of CO2,its permeability is high in comparison with other gases.The structure of polyurethane is such that they have polar ether groups(C--O--C)in their soft segments that can create suitable sites for the sorption of CO2polar molecules in the polymer matrix which results in an increase in its permeability[36].Furthermore,the higher solubility of CO2in the membranes can cause the higher CO2permeability in comparison with otherstudied gases[37].Moreover,CO2has a smallmolecularsize and a high condensation temperature in comparison with other gases[42].Also,CO2is a polar gas that can interact with polar chain polymers.Therefore,due to these features of CO2,the permeability of CO2is much higher than other gases in membranes that have polar groups in the main chain of the polymer[42,43].
3.3.Comparison of three variables(temperature,pressure,and zeolite content)on permeability and selectivity of studied gases
An investigation of the effects of three aforementioned factors(i.e.temperature,pressure,and zeolite content)on the gas permeability and selectivity shows that,in almost all of the studied cases,the zeolite content in the polymer matrix is the most effective factor.The existence of the continuous path in the polymer matrix and high content of zeolite allow molecular gases to pass through the zeolitic phase effectively which can cause an increase in the permeability of gases[40,41].
With the addition of zeolite content at different temperatures and pressures,the permeability of condensable gases(i.e.CO2and CH4)increased more in comparison with non-condensable gases(i.e.N2and O2)which confirms that the solubility mechanism was the dominant mechanism in the polymer[42].Furthermore,the higher increase in the permeability of CO2than CH4is due to the higher solubility of CO2and higher interaction of this gas with polar groups in the polymer matrix.Moreover,the higher permeability ofmethane compared to smaller molecules of nitrogen and oxygen in the membranes revealed that the solubility mechanism was the dominant mechanism in these membranes(Table 7)[38,39,43].
Also,with increasing the temperature,the mobility of polymer chainsand thusthe permeability increased greatly.The orderofchanges in the membrane permeability of studied gases in both pure and mixed matrix membranes(for all percentages)at different temperatures and pressures is as follows[44,45]:

Fig.11.3D surface plot(a)and contour plot(b)showing the effect of zeolite content,temperature and pressure on the response 4 for zeolite ZSM-5.

With increasing pressure and increasing zeolite content,CO2/N2and CO2/CH4selectivities increased more,while for O2/N2itcan be seen that the impactofthe zeolite contentwas greaterthan the pressure.Itmeans that forthe selectivity of O2/N2,zeolite contentwas only the most in fluential factor,but,in the case of CO2/N2and CO2/CH4selectivity both of the zeolite content and pressure were in fluential.Also,it was observed that in the case of O2/N2selectivity,any increase in temperature and pressure did not result in any significant changes.
3.4.Process optimization using response surface methodology(RSM)

Fig.12.3D surface plot(a)and contour plot(b)showing the effect of zeolite content,temperature and pressure on the response 5 for zeolite ZSM-5.
In the numericaloptimization ofDesign Expertsoftware,we selectthe favorite goal for each factor and response from the menu.The numerical optimization found a point that maximizes the desirability function.Always,it is important to specify a set of operating conditions that all responses(PCO2/PCH4,PO2/PN2,PCO2/PN2,PN2,PO2,PCH4,and PCO2)are optimized or located in desired ranges.Tables 8 and 9 show the optimization conditions used to get the optimum value for the responses for 3A zeolite and ZSM-5 zeolite,respectively.The main goal was to maximize the permeability of CO2and therefore perm selectivity of PCO2/PN2and PCO2/PCH4as you can see the optimum amounts in the Fig.16.

Fig.13.3D surface plot(a)and contour plot(b)showing the effect of zeolite content,temperature and pressure on the response 6 for zeolite ZSM-5.
The Design Expert software package calculates the desired solution by using a direct search procedure[46].The possible solutions are summarized in Tables 10 and 11 for 3A zeolite and ZSM-5 zeolite respectively.Table 10 showed that the most desired operating conditions were the zeolite content of 18 wt%,operating temperature of 30°C and operating pressure of 0.8 MPa for both of the zeolites.When the values ofeach factor(i.e.temperature,pressure,and zeolite content)werefixed as the optimum values,the results show that the maximum permeability and selectivity were gained.The results represent the following deviation between experimental and predicted values(Tables 10 and 11):In the case of 3A zeolite,it was 1.57,9.57,10.7,-4.13,3.61,-1.38,and 3.69 for PCO2/PCH4,PO2/PN2,PCO2/PN2,PN2,PO2,PCH4,and PCO2,respectively;But,in the case of ZSM-5 zeolite it was 6.49,7.71,0.18,1.2,8.46,-4.28,and 2.25 for PCO2/PCH4,PO2/PN2,PCO2/PN2,PN2,PO2,PCH4,and PCO2,respectively.The results obtained from confirmation experiments are within 95%of predicted values.This indicates the suitability of the developed regression model.This indicates that the experimental data and results gained from model prediction agree.
4.Conclusions
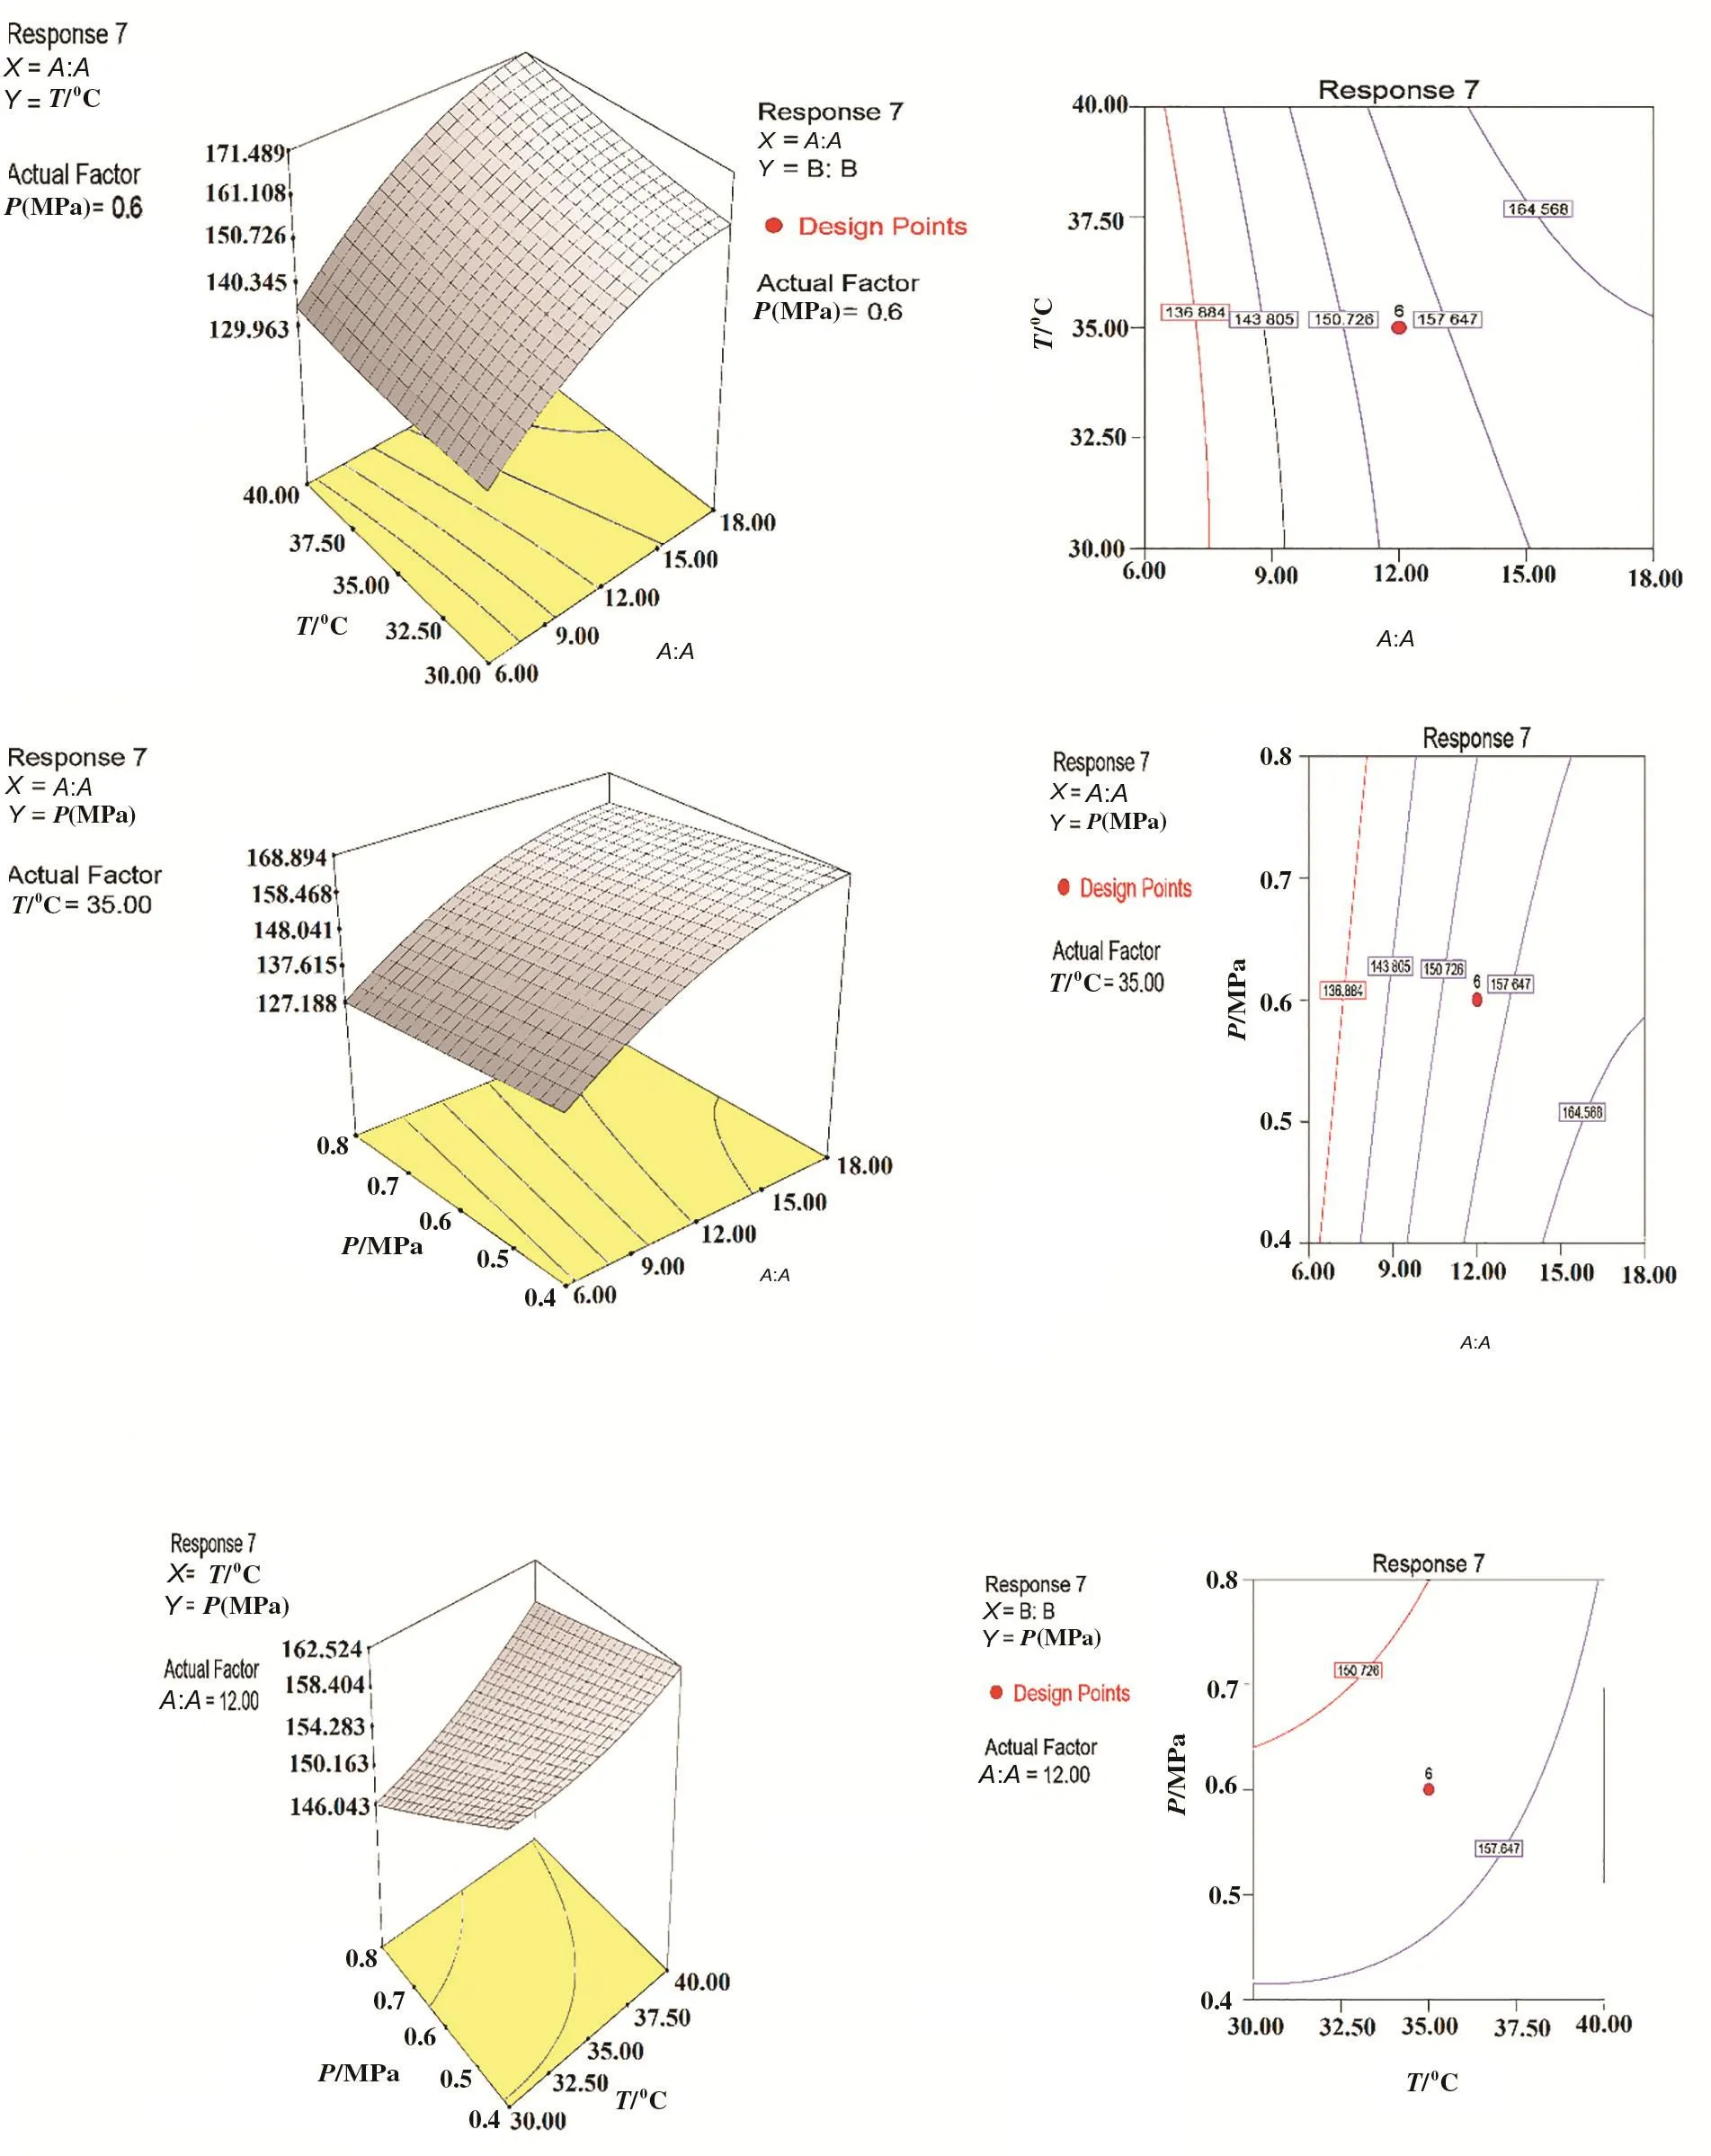
Fig.14.3D surface plot(a)and contour plot(b)showing the effect of zeolite content,temperature and pressure on the response 7 for zeolite ZSM-5.
The application of response surface methodology based on central composite design to investigate PU–zeolite mixed matrix membranes for the separation of gases has been successfully proven in this work.The studied factors were the zeolite content,operating temperature,and operating pressure.The results revealed that the three factors had important effects on the permeability and the selectivity whether individual in fluences(main effects and quadratic effects)or interaction effects were considered.Among these factors,the zeolite content was more significant than the temperature and pressure.Based on desirability function in RSM,the optimum conditions for both of the zeolites were found as follows:zeolite concentration(18 wt%),temperature(30°C),and pressure(0.8 MPa);the optimum results based on these optimum conditions were obtained for both of the zeolites which was confirmed experimentally with a percentage deviation of 1.57,9.57,10.7,-4.13,3.61,-1.38,and 3.69 for PCO2/PCH4,PO2/PN2,PCO2/PN2,PN2,PO2,PCH4,and PCO2,respectively(for 3A zeolite);and 6.49,7.71,0.18,1.2,8.46,-4.28,and 2.25 for PCO2/PCH4,PO2/PN2,PCO2/PN2,PN2,PO2,PCH4,and PCO2,respectively(for ZSM-5 zeolite).Thus,the predicted values by the software confirmed the experimental results.

Fig.15.Desirability ramp for numerical optimization for zeolite 3A.

Fig.16.Desirability ramp for numerical optimization for zeolite ZSM-5.
Supplementary Material
Supplementary data to this article can be found online athttps://doi.org/10.1016/j.cjche.2018.03.013.
杂志排行

Chinese Journal of Chemical Engineering的其它文章
- Experimental investigation on flow characteristics in circular tube inserted with rotor-assembled strand using PIV☆
- PIVexperimentand large eddy simulation ofturbulence characteristics in a confined impinging jet reactor☆
- CFD predictions for hazardous area classification
- Hydrate agglomeration modeling and pipeline hydrate slurry flow behavior simulation☆
- Improving the performance of a thermoelectric power system using a flat-plate heat pipe☆
- Extending the EMMS/bubbling model to fluidization of binary particle mixture:Formulation and steady-state validation☆