The effect of multi-orifice plate configuration on bubble detachment volume☆
2019-02-15JimingWenQiunanSunZhongningSunHaifengGu
Jiming Wen,Qiunan Sun,Zhongning Sun,Haifeng Gu*
Fundamental Science on Nuclear Safety and Simulation Technology Laboratory,Harbin Engineering University,Harbin 150001,China
Keywords:Multi-orifice plate Aeration performance Bubble detachment volume The number of open orifices
ABSTRACT The multi-orifice plate gas sparger,mainly composed ofa multi-orifice plate and a gas chamber,is one ofthe most common sparger facilities.The aeration performance of multi-orifice plate has a close relation with the multiorifice plate configuration.In addition,the weeping phenomenon has a considerable in fluence on the gas chamber condition which affects the bubble detachment volume directly.This paper conducts a set of visual experiments to study the in fluence of multi-orifice configuration and gas chamber condition on the aeration performance of gas sparger.For multi-orifice plate,an improved theoretical model is proposed which considers the wave effectofthe previous bubbles generated fromadjacentorifices and the variance ofthe number ofactive bubbling orifice.A parameter is proposed to evaluate the aeration performance in order to overcome the dif ficulty caused by the randomness of bubble formation process.The experimental results suggest that the gas chamber filled with water is in favor of large bubble formation.The in fluence of the pitch of orifice on aeration performance can only be observed in high-restricted case.According to the theoretical model and experimental results,the in fluences ofgas flow rate and the number of open orifices on the aeration performance are analyzed and a design criterion for the number of open orifice is proposed.
1.Introduction
Bubble column is a kind ofefficientmultiphase contactorand reactor which has been applied in many industries such as chemical,coalliquefaction,metallurgy and waste water treatment[1,2].The work performance of bubble column has a close relation with bubble size distribution(BSD).Smallbubbles can provide higher interface area concentration which is beneficial to mass,momentum and energy transfer between phases[3].Besides the terminal rise velocity decreases as bubble size decreases[4].According to Besagni,when bubble size is large,the lift coefficient is negative and bubbles move toward the center of bubble column,so in large bubble case the homogeneous flow regime is destabilized[5].Therefore the performance of bubble column can be improved effectively by reducing bubble size.
Due to the significant in fluence of BSD on the work performance of bubble column,many researches have paid attention on this issue.It has been proved that BSD is affected by many factors including bubble formation,bubble coalescence and break-up rate,mass transfer and gas–liquid physical property[6–8].A number of expressions have been proposed to calculate BSD based on the physical property of gas/liquid system,gas super ficial velocity and bubble column diameter[9,10].According to population balance model which is an effective method of analyzing BSD[11–13],BSD is depends on the balance between the coalescence rate and the breakup rate under mostconditions.Guédon and Besagniconcluded thatthe prevailing regime can be distinguished in the homogeneous flow regime and heterogeneous flow regime.The homogeneous flow regime is further distinguished into“pure-homogeneous” flow regime and “pseudo-homogeneous” flow regime.In the homogeneous flow regime associated with low super ficial gas velocity,it is agreed generally that there is no coalescence-induced bubble[5,14].Besides,it has been reported that bubble coalescence rate decreases dramatically and even to zero in inorganic solution[15,16].Under non-coalescence condition,the BSD right behind the gas sparger can represent for the BSD in the entire bubble column reactor[17].The aeration performance of gas sparger plays a crucial role on BSD.Additionally,gas sparger has in fluence on other character parameters of bubble column.Many researchers have studied the relationship between gas sparger and the transition gas flow rate which separates the homogenous regime and the heterogeneous regime[18,19].Wilkison studied the column design for engineering application.He concluded that the gas sparger with small diameter orifice in laboratory can result in a higher gas hold up compared to the one with large orifice diameter in industry.So the effect of gas sparger on gas hold up is nonignorable[20].
Due to the importance of gas sparger,many researchers have paid attention to it.In practical application,multi-orifice plate is a kind of widely used sparger due to the advantages in both design and operation:simplicity of construction,lack of mechanically operated parts,low energy input requirements,etc.The work principle of multiorifice plate is to homogenize gas flow into each active bubble orifice and reduce the average gas velocity through orifice which leads to the decrease of bubble detachment volume(BDV).For the same gas flow rate,the average BDV decreases with the number of active bubble orifices.However,during bubble formation,the bubbles generated from two adjacentorifices can coalesce with each other.The coalescence ef ficiency ofbubbles atadjacentorifices increases with decreasing the pitch of orifices[21].Therefore it is crucial to determine the suitable number ofopen orifices.When the number ofopen orifices is significantly small,the gas flow rate through each orifice is too high which leads to a large BDV,but when the number of open orifices is much larger than the number of active bubble orifices(NABO),the pitch of orifices is so close that bubble coalescence at adjacent orifices occurs more frequently.
For the single-orifice gas sparger,BDVcan be predicted accurately under different conditions refer to orifice diameter,gas chamber volume,gas flow rate and liquid physical property[22–25].However,the bubble formation behavior of multi-orifice plate is obviously distinctive from the one of single-orifice spargers.CFD simulation is usually regarded as a kind of effective method to study the multiorifice plate.Guan proposed a new method to establish the relationship between chord length distribution and bubble size distribution[26].The experimental results of Guan provided a benchmark data for validation of CFD simulation.Dhotre made a significant attempt to simulate the flow pattern on the upstream and downstream of the distributor.He analyzed the effects of opening area and hole diameter on the flow patterns of bubble column and gave a design guidance of distributor based on bubble column diameter and height,super ficial gas velocity and liquid velocity[27].Shi proposed a new inlet model for CFD simulation which is able to achieve a good balance between simulation accuracy and computational cost[28].Bahadori investigated 2-and 3-D simulations and analyzed the relation of gas hold up and the number of open orifice[29].In addition,the bubble characteristic of multi-orifice plate has been studied by experimental methods[30]and some regressive calculation expressions were proposed for predicting the Sauter diameter generated by multi-orifice plate[31,32].As far as the authors can see,there is few mechanism analysis for the relation of BDV and multi-orifice plate configuration.According to the theoretical model proposed by Loimer et al.,the minimum gas volume flux above which NABO increases is obtained according to orifice diameter,gas density and liquid surface tension[33].However the NABO predicted by Loimer model is proved to be not absolutely applicable in this work.
Apart from multi-orifice plate configuration,the gas chamber condition also has a significant in fluence on BDV.According to Hughes,the bubble formation type is classified according to the capacitance number defined by Eq.(1),Bubble formation is under constant flow condition for Nc<1 and under constant pressure conditions for Nc>10[34].Gaddis proposed an accurate calculation for bubble detachment volume under constant flow condition.The application range of calculation can be up to transition to the jetting regime[35].Under constant pressure condition,Park considered that the gas chamber volume can be divided into three levels and proposed different BDV calculation expressions[22].Weeping is a kind of disadvantage phenomenon for aeration which occurs under some specific conditions.The volume of gas space in gas chamber is reduced by weeping phenomenon[35].
In this work,the in fluences of gas chamber condition and gas chamber volume on BDV are studied experimentally with multiorifice plate sparger.A set of experiments have been conducted to study the relation between multi-orifice plate configuration and the average BDV.A theoretical model is improved to analyze bubble detachment volume of multi-orifice plate.In addition,the effect mechanism of gas flow rate and sparger configuration are discussed and a design criteria for the number of open orifice is proposed.

2.Experimental
2.1.Experimental facility
The schematic of test facility is shown in Fig.1.This test facility is designed to conduct visual experiment.The main test section located on an aluminum alloy shelf is a cuboid pool which is 1 m tall and has a rectangular cross section(200 mm×150 mm)which can protect bubble from wall disturbance.Stalinite,a kind of hard and transparent glass,is selected to be made as the visual faces and other two side faces are made of stainless steel.In Fig.1,the portion marked by blue color is the transparent field.Orientated to the visual fore-face,a high speed camera,PHANPOM V641,is seated on a platform which is installed on guide rails.The high speed camera takes images at 1000 frames per second.The scale of taken image is calibrated by a long straightedge.A 12 W LED light source is employed as the light source.In order to make the subsequent image process simpler,the light generated directly from light source should be homogenized.So a piece of hiramitsu slice which possesses the ability of homogenizing light is located between the visual after-face and LED.Air and distilled water are employed as the working fluids.A multiorifice plate whose submerged depth is 0.3 m is fixed by inner hexagon screws on the top of the gas chamber which is installed at the baseboard of tank by bolts.This design provides the convenience for achieving different combinations of the multi-orifice plate and the gas chamber.The multi-orifice plate is shown in Fig.2 and the construction parameters are listed in Table 1.The bubble coalescence near sparger has been studied systematically in other work.The pitch of orifice in this work is set to guarantee that there is rarely bubble coalescence near sparger.Air is pumped into to an air storage tank 2 m in height and 1 m in diameter which is so large that the tank pressure maintains almost constant during experimental period.A needle throttling valve is employed to realize throttling and adjusting gas flow rate.The differential pressure through the needle valve is large enough,so the gas flow rate is not affected by the slight fluctuation of the gas chamber pressure.The gas flow rate below 0.5 L·min-1is measured by a mass flow meter produced by Bronkhorst and an AALBORG mass flowmeter is employed to measure flow rate which is above 0.5 L·min-1.It should be noted that because this work is mainly on the mechanism effect near sparger configuration on bubble detachment size,the experimental condition has a large difference from industry.The sparger is located in the center of pool and the area of sparger is only 6×10⁻⁶m2.The super ficial gas velocity is only from 5.55×10⁻⁵to 1.67×10⁻³m·s-1.A PID controller is applied to maintain water temperature at 25°C by switching on/off a heating rod whose heating power is 1000 W.A platinum thermal resistance located at the same level as the orifice is employed to detect solution temperature and feedback temperature information to PID controller.
2.2.Experimental result disposal

Fig.1.Schematic of experimental facility.

Fig.2.Construction of multi-orifice plate.
NABO and bubble detachment time are recorded manually with PCC,a bundled software with high speed camera.In order to obtain focused bubbles,the orifices are ranged in the line which is located in the focused plane of high speed camera.The BDV of some bubbles is obtained with the help of self-designed arithmetic which consists mainly of three steps as shown in Fig.3.The concept of image processing method is to cut bubble projection in a suitable direction and calculated the total volume sum of every divided piece.The first step,pre-processing step,aims to enhance the quality of raw images.Background noise and non-uniform brightness are eliminated in pre-processing step.In the second step,the bubble geometric center is selected out.After determining mass center,a straight line through bubble mass center rotates and scans the bubble projection as shown in Fig.4.When the straight line rotates to a certain position,the bubble symmetry for this straight is best and this straight is regarded as the symmetry axis of bubble projection.Bubble deformation has close relation with the circularity of bubble circularity defined by Eq.(2).When circularity is above 0.6,bubble shape belongs to ellipsoid.On the contrary,bubble shape is disk for circularity below 0.6.As shown in Fig.5,for different bubble geometries the segmentation direction is different.For ellipsoid bubble,segment direction is perpendicular to the longer bubble symmetry axis.But for disk bubble,segment direction is parallel to the longer bubble symmetry axis.If interested in this image processing method,please review our another work[36].It should be noted that image processing method is limited in the range of low gas velocity(<0.5 L·min-1in this work),because many overlapped bubbles appear when gas flow rate is high.where A and Lbare the projection area and projection perimeter of bubble in the recorded images respectively.

Table 1 The structure parameter of multi-orifice plate and gas chamber


Fig.3.Flowchart of the image processing algorithm.
2.3.Error estimation

Fig.4.Sketch map of determining bubble symmetry axis.
The error of photography process comes from three sources,i.e.,calibration,resolution ratio,and refraction.As mentioned above,one pixel corresponds 0.015 mm and the error of length in image is±0.03 mm.Because of the limit of resolution ratio accuracy,the uncertain value of bubble volume is 1.8%for bubble diameter in 5 mm and 0.9%for bubble diameter in 10 mm.During calibration process,straightedge is not completely parallelto the visualface and the intersection angle between straightedge and lens is less than 1°.What's more,there is a reading error within 1 mm.So the total calibration uncertain is within±2.8%leading to bubble volume uncertain to be±8.6%.As shown in Fig.6,the object image forms because of different intensities of the light transporting into camera lens.The light transporting into camera lens normally plays a major role on shadow formation.In Fig.6,if the actual length ofobjectis L,the length ofobjectshadow in image L′has relationship with L as Eq.(3).The incline angle is no larger than 5°and the bubble volume uncertain resulting from camera lens incline is less than 1.15%which is much smaller than calibration uncertain.Therefore the integral error of image is calculated as Eq.(4).The integral error of image processing methods is within 9%.

whereαis the included angle between lens and the visualface ofexperimental tank,β and γ are the refraction angle of light in water and stalinite respectively.

3.Theoretical Model
The modelof Wenxing Zhang has been proved to be accurate to predict the bubble formation at single-orifice plate[37],but this model should be modified in orderto be applied formulti-orifice plate.The improved theoretical model in this work employs a more suitable method to calculate the gas flow resistance through orifice and improves the force balance acting on bubble.In addition,the variationalnumberofactive bubble orifice can be simulated in the improved model.Fig.7 displays the improved theoretical model brie fly.

Fig.5.Schematic diagram of segmentation method:(a)bubble projection,(b)horizontal segmentation,(c)horizontal segmentation result for ellipsoidal bubble,and(d)horizontal segmentation result for disk-shaped bubble.
The growing bubbles are considered to be spherical.Because the work gas is ideal and compressible,the chamber pressure obeys an adiabatic equation as Eq.(5).

where the overdot denotes time derivative throughout the paper.
The increase rate of bubble volume is determined by the gas flow rate through orifice which depends on the differential pressure at two sides of orifice and the flow resistance of orifice.


Fig.6.Schematic diagram of refraction error.
Around a rising and expanding spherical bubble,the liquid potential function is


Fig.7.Diagram of the improved model.
Following Bernoulli's equation,during bubble formation,the liquid pressure at the orifice can be obtained

The bubble pressure can be considered to be uniform and the average pressure is equalto the sum ofsurface tension,the static liquid pressure and wave effect of the detached bubbles.


Fig.8.The flow diagram of solving theoretical model.
where the wave pressure of one detached bubble at orifice can be obtained according to potential function:

Refer to Eq.(12),the wave pressure of one detached bubble at s distance to orifice calculated as:

where ascis the cap radius of the spherical-cap bubble.
For multi-orifice plate,the previous bubble whose wave effect acts on following bubble doesn't come from the unique orifice but also the adjacent orifices.The model in this work considers the combined wave effect of the detached bubbles from different orifices on the following bubble.Refer to Eqs.(5),(9),(10)and(11),the NABO,N,is very important.It will be discussed in Section 4.1 that N is varying which bring a challenge for accurate prediction.In this work,two methods are employed to determine NABO for different purposes.When the calculated values by theoretical model is compared to experimental results,the bubble detachment volume for a specific number of active orifices is obtained under the assumption that the gas flux of each active orifice is identical.Because the bubble detachment volumes for different active orifices are not identical to each other,the average bubble detachment volume is calculated refer to Eq.(14).The time portion of each number of active orifices is set to be equal to the experimental values.When the theoretical model is employed just for analysis,the number of active orifices is considered to be changed automatically.For this type of solution,the bubbling order is set from left to right namely the foremost satisfying bubbling requirement is the left orifice and then is middle orifice and right orifice in order.As shown in Fig.1,it has been proved in other work that the wave pressure of previous bubbles is similar when the number of active orifice is fixed.Therefore the bubbling order is suitable to represent different bubbling situations.When the gas chamber pressure achieves bubble requirement,the bubble at left orifice begins to grow.When the number of active orifice is 1 and the gas chamber pressure increases gradually,the number of active orifice should switch to 2.The switch condition is the minimum gas chamber pressure achievedWhen the number of active orifice is 2 and gas chamber pressure decreases to,the number of active oriif ce switch from 2 to 1.Similarly,the switch criterion from 2 to 3 isand the one from 3 to 2 is

where χkis the time portion of the number of active bubble orifice which is equal to k and the definition and interpretation for χkwill be introduced in Section 4.1.
Compared to Wenxing Zhang's model,Lei Zhang has given a more perfect overall force balance acting on bubble[38].The theoretical expression is stated respectively as follows:
Buoyancy force:

Surface tension force:

Added mass inertia force:

where ε1is the added mass coefficient.Milne-Thomson[39]proposed an expression for ε1:

when a=h,ε1=
Drag force:

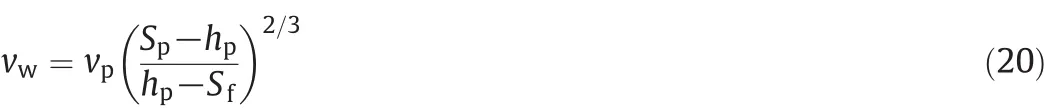
Sekoguchi studied systematically the drag force of the bubbles whose Re is 1–1000 or above 1000 and the bubble Re in this work is from 40 to 2300[40].Therefore the calculation expression proposed by Sekoguchi is adopted to calculate drag force coefficient as:CD=18.5/ReB0.6for 1<ReB<1000 and CD=0.44 for ReB>1000.vwis the average impressed velocity resulted from the wake of the previous detached bubble.It has been proposed that the velocity attenuation behind a circular wake is proportional to the-2/3 power of the axial distance[41].

Fig.9.The variance of NABO with statistic order.

Fig.10.The in fluence of gas chamber condition on TPNABO.
During bubble growth,the force balance always remains as

Compared to Zhang model,the improved modeladded the effects of drag force and surface tension.It has been proved that drag force plays an important role on bubble detachment volume at high gas flow rate[35].When gas flow rate is high,bubble grow rate is fast,which leads to large action area ofdrag force and high relative velocity between bubble and the surrounding liquid.So the in fluence from drag force is considerable.Compared to other forces,surface tension is weak at high gas velocity.However,according to Marmur,the in fluence of surface tension at initial period is non-negligible[42].So surface tension is fatal to describe the bubble growth at initial stage.
The criterion of bubble detachmentis following McCann and Prince:bubble detaches at s=a if Po>Pcor at s>a when Po=Pc[43].
Fig.8 is the flow diagram forsolving the improved theoreticalmodel.Firstly,the structure parameters of multi-orifice plate and the initialoperation parameters are given,which include orifice diameter,the pitch of orifice,plate thickness,gas flow rate,submerged depth,etc.Then an iterative calculation is carried out in each time step.When the iterative calculation is converge,many variables have been obtained,such as bubble pressure,the center location of bubble,the forces acting on bubble and so on.Finally,a judgment for bubble detachment is completed.The time-dependent variables are calculated out until bubble detachment criterion is met.
4.Results and Discussion
4.1.Experimental results
In Fig.9,the multi-orifice plate is 2 mm orifice diameter,6 mm pitch of orifices and equipped on the 3#gas chamber.There are two gas chamber conditions in Figs.9–11 which are called “chamber filled with water”and “chamber without water”respectively.The chamber condition is related with weeping phenomenon.“Chamber without water”and “chamber filled with water”represent the beginning and end of weeping respectively.In order to analyze the separate in fluence of gas chamber condition on aeration performance,the construction of gas sparger and gas flow rate are chosen to guarantee that the weeping phenomenon can't occur spontaneously.The gas chamber filled with water is achieved by injecting water into chamber before experiment.It should be noted that“chamber filled with water”dose not means that gas chamber is absolutely filled with water.Under this chamber condition,a little water is replaced and a thin air layer forms as gas flows into chamber.In practice,there is a thin air layer in chamber at the end of weeping.According to Loimer,NABO is fixed when multiorifice plate configuration parameter,gas flow rate and liquid physical property are maintained constant[33].Under the condition where gas chamber is filled water,the volume of gaseous space is very small which is similar to the situation in Loimer's research.Fig.9 suggests that Loimer's model is not absolutely consistent to the practical bubble process.This is because that the wave effect of the previous bubbles and the variance of chamber pressure were not considered in Loimer's model.
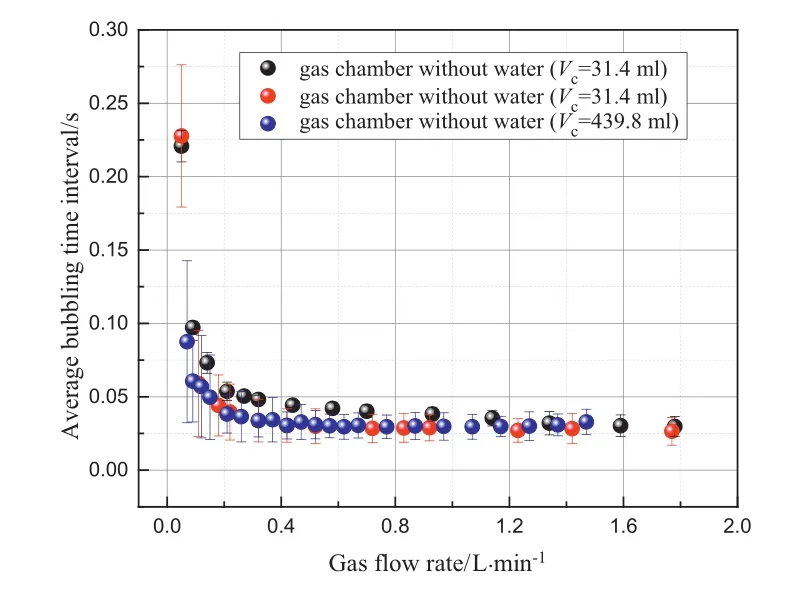
Fig.11.The in fluence of gas chamber condition on average bubble interval.

Fig.12.The suppression phenomenon of bubble generated at multi-orifice plate.
Because of the random variation of NABO,the time proportion of a specific NABO is defined as Eq.(22).The occupation time of one bubble process is the time difference between the two adjacentbubble detachment moments.If the NABO of one bubble process is equal to k,the occupation time of this bubble process is added to tk.The time proportion of a specific NABO which is called TPNABO for short represents the contribution of this NABO to aeration.In order to minimize the stochastic effect,the statistical time for bubble process is longer than 5 s.

As shown in Fig.10,the TPNABO of NABO=1 for gas chamber withoutwaterdecreases quickly to around 0.2 as gas flow rate increases to 0.2 L·min-1while the corresponding TPNABO for gas chamber full of water decreases linearly and gently during the whole gas flow range.For gas chamber without water,the TPNABOs of NABO=2 and NABO=3 both increase faster.However,for the gas chamber full of water,the TPNABO of NABO=3 maintains almost 0 as gas flow rate is below 0.8 L·min-1.Fig.11 shows that gas chamber condition has weak in fluence on the average bubble interval.When average bubble interval remains constant,as the TPNABO of high NABO increases,the total number of formed bubbles increases during same time.Therefore the average BDV is smaller under the gas chamber condition where chamber is without water.
As shown in Fig.12,two bubble nucleuses have formed as the chamber pressure satisfies the bubble formation criterions of left orifice and right orifice simultaneously,but the bubble nucleuses at left orifice don't grow adequately.This is because the gas consumption of gaseous space resultsin an obviousdecrease ofchamberpressure.When the volume of gaseous space is small and gas supplement cannot be in time or insufficient relative to gas consumption,the chamber pressure will decrease fast and the bubble growth at multiple orifices cannot develop adequately.When the gas chamber is filled with water,the liquid in chamber reduces gaseous space volume and enhances the response rate of chamber pressure.During bubble formation,the gas flowing into chamber supplies gas into the gaseous space.Meanwhile,bubble formation consumes the gas of gaseous space.There is a phase difference between the gas supplement and gas loss in the gaseous space.The decrease rate of gas chamber pressure is faster and the suppression phenomena of multi-bubble growth appear more frequently.Therefore the TPNABO of high NABO is small in the chamber full of water.Figs.10 and 11 also show that gas chamber volume has little in fluence on aeration performance when gas chamber is full of water,because the volume of gaseous space has no relation with chamber volume in this case.

Fig.13.The in fluence of the pitch of orifices on TPNABO.

Fig.14.The in fluence of the pitch of orifices on the average bubble interval.
In Fig.13,orifice diameter is 1 mm and 3#gas chamber is employed.It can be seen that the variation trend of TPNABO with gas flow rate is poorly regular.Because the ascend trajectory of the previous bubbles is various and unsteady,the wave effect of the previous bubbles bring random disturbance to the next growing bubbles.Despite the average bubble intervalin Fig.13 is regular,itis difficultto evaluate aeration performance by joint use of TPNABO and average bubble interval.So a new parameter,effective bubble time(EBT),is proposed which is do fined by Eq.(23),which considers TPNABO and average bubble interval.The physicalexplanation for EBT isthe mean occupation time ofeach bubble corresponding to the actual gas flow rate.

In orderto evaluate the applicability ofEBT,some experimentresults are selected elaborately from Figs.13 and 14.Two larger pitches of orifices are selected and gas flow rate range is chosen from 0.35 to 0.7 L·min-1,which can both avoid the strong disturbance between the bubbles generated at adjacent orifices and pledge that NABO is not restricted to 1.The EBTs at 6 mm and 8 mm pitch of orifices at same gas flow rate are compared in Fig.15.Fig.15 shows that the EBTs for these two pitches of orifices are almost equal to each other,although the TPNABO for 6 mm pitch of orifices is obviously different from the one of 8 mm pitch of orifices as shown in Fig.13.So EBT shows stability and reliability in representing aeration performance.

Fig.15.The comparison of the EBTs at different pitches of orifices.

Fig.16.The BDV obtained by EBT and image processing method respectively.
According to the physical implication ofEBT,the average BDVcan be calculated as Eq.(24).The accuracy of Eq.(24)is verified by image processing method.As shown in Fig.16,the processed average bubble volume refer to Eq.(24)is basically consistent to the results obtained by image processing method.
Although the image processing method is more accurate theoretically than the processing method refer to Eq.(24)at low gas flow rate,image processing method is invalid at high gas flow rate where one bubble is even squeezed into another bubble.Because the processed results refer to Eq.(24)is almost impervious to the gas flow rate,EBT is applicable to characteristic aeration performance during a wide gas lf ow rate range.

Referto Fig.17,as gas flow rate ranges from 0.35—0.7 L·min-1and 3#gas chamber is employed,the EBT of 4 mm pitch of orifice is a little smaller than the EBT of other pitches of orifice.For the shorter pitch of orifice,the previous bubbles have stronger elongation effect on the following bubbles generated at the adjacent orifices.According to Eqs.(10)and(11),the wave effect of the previous bubbles reduces the liquid pressure near orifice and the gas chamber pressure that satisfies the bubble nucleus criterion is decreased.According to Park et al.[22],the difference value has a significantin fluence on BDV,which is between the chamber pressure at initial moment and the one at end moment of one bubble formation process.BDV decreases as the pressure different decreases.As gas flow rate is below 0.35 L·min-1or above 0.7 L·min-1,the in fluence of pitch of orifice ignorable.When gas flow rate is below 0.35 L·min-1,NABO is basically equal to 1,so the pitch of orifice insignificant for EBT.When gas flow rate is above 0.7 L·min-1,the pressure variance ofgas chamberis affected hardly by the wave pressure of the detached bubbles.According to Park,the BDV under constant pressure condition is determined by the pressure difference value between the initial and ending moment of one bubble process.However,the phenomenon in Fig.17 indicates that the conclusions of PARK[22]may not be valid at high gas flow rate.The applicability of PARK model is affected by the relative magnitude between chamber volume and gas flow rate.

Fig.17.The in fluence of pitch of orifice and gas chamber volume on EBT.

Fig.18.The comparisons between experimental results and calculated value by different models.
4.2.Model analysis
The orifice diameter and the pitch of orifices are 1 mm and 6 mm respectively and 2#gas chamber is employed in Figs.18 and 19.The number of open orifices is chosen as 2 and 3 in order to study the in fluences of gas flow rate and the number of open orifices on the aeration performance.Fig.18(a)shows the comparison between experimental results and the calculated values refer to the first model solution discussed in Section 3.In Fig.18(a),both experimental results and calculated values show that the average BDV is basically unchanged when gas flow rate changes below 1 L·min-1.As gas flow rate is above 1 L·min-1,the average BDVbegins to increase with gas flow rate.Therefore,there is a gas flow rate value above which BDV is sensitive to the variance of gas flow rate.It can be seen that this gas flow rate value increases as the number of open orifices increases.
In order to clarify how the number ofopen orifices in fluences the relationship of the average BDV and gas flow rate,the experimental results are further compared with different calculation expressions for the average BDV.In Fig.18(b),the horizontal solid line represents the calculated values by Eq.(26)[22].Eq.(26)is employed under constant pressure condition and shows thatthe BDVhas no relationship with gas flow rate.Eq.(25)is a classical calculation expression for BDV under constant flow condition[33].In addition,Gaddis and Vogelpohl proposed an accurate calculation correction for bubble detached diameter as Eq.(27).In Fig.18(b),the calculated by Eqs.(25)and(27)are represented by black dashed curves and red curves respectively.The mean gas flow rate used to calculate Eqs.(25)and(27)is the division of total gas flow rate by the number ofopen orifices.The calculated results that refer to Eqs.(25)and(27)both increase with gas flow rate.At low gas flow rate,the values calculated by Eq.(27)are larger than the ones calculated by Eq.(25),but the increase rate of calculated values by Eq.(25)with gas flow rate is higher.As the gas flow rate is low,the calculated values that refer to Eqs.(25)and(27)are smaller than the ones obtained by Eq.(26)which means that the bubble formation process is under the absolutely constant pressure condition(ACPC).As the gas flow rate is high enough,the calculated BDVs by Eqs.(25)and(27)both increase.In this case,the gas flow rate has a significant in fluence on the pressure variance of gas chamber.This condition is named as“not-absolutely constant pressure condition”(NACPC).Fig.18(b)suggests that the gas flow rate value as the boundary between two conditions increases as the number of open orifices increases.However,a practical problem appears i.e.how to confirm the gas flow rate which is the boundary between two conditions.In Fig.18b,for either twoorifice or three-orifice plate,the gas flow rate which satisfies the equal relation between Eqs.(25)and(26)is larger than the one which satisfies the equal relation between Eqs.(27)and(26).The gas flow rate above which the measured BDV increases with gas flow rate is larger than the calculated value which satisfies the equal relation between Eqs.(25)and(26),but smaller the one between Eqs.(27)and(26).It means thatthe calculated gas flow rate which satisfiesthe equalrelation between Eqs.(25)and(26)is more conservative to avoid being under NACPC.Therefore Eqs.(25)and(26)are selected to determine the gas flow rate acting the boundary,although the calculated values that refer to Eq.(27)are more consistent to the experimental results.When the gas flow rate is under ACPC,the average BDV is independent of the gas flow rate and the number of open orifices.But when the gas flow rate is under NACPC,the average BDV increases with gas flow rate and decreases with the number of open orifices.Because that gas chamber has the buffered effect on the pressure variance of gas chamber,the experimental average BDV is smaller than the calculated values by Eq.(25).

Fig.19.Gas chamber pressure-history during bubble formation according to theoretical model.

BDV has close relation with the pressure variance of gas chamber.Fig.18 suggests that the pressure variance of gas chamber is in fluenced not only by the chamber volume but also by the gas flow rate and the numberofopen orifice.Fig.19 shows the pressure variance ofgas chamber under various conditions.Three kinds of gas sparger are analyzed according to the theoretical model.The two former spargers are the ones in Fig.18.The last one is fictitious which makes sure that bubble process is under a typical constant flow condition.For the fictitious gas sparger,the gas chamber volume is 2 ml,the orifice diameter is 1 mm and the number ofopen orifices is 1.Underthe constant flow condition,the variance amplitude of gas chamber pressure is large during bubble formation.When the gas chamber volume and the gas flow rate belong to ACPC marked respectively by black solids in Fig.19(a)as well as square and triangle blanks in Fig.19(b),the pressure variance of gas chamber becomes smooth.As gas flow rate increases to 2.5 L·min-1belonging to NACPC,the pressure response of gas chamber becomes faster and chamber pressure variance is similar to that of constant flow condition.
The above analysis shows that the pressure variance type of gas chambercannotbe defined by only Eq.(1)butalso many factorsincluding gas flow rate,chamber volume and the number of open orifice.The constant pressure condition defined by classic theory is not suitable at high gas flow rate.As shown in Fig.19,the historical chamber pressure variance under different bubble conditions are obtained by making use of the second model solution which are discussed in Section 3.It shows that bubble formation process turns into NACPC at high gas flow rate.Because the average BDV increases with gas flow rate,the construction deign should make sure that gas sparger works under ACPC.

Fig.20.The verification by four-orifice plate and five orifice plate.
As shown in Fig.20,a four-orifice plate and a five orifice plate are selected to verify the relation ofaverage BDVwith gas flow rate.Orifice diameteris 1 mm and the pitch oforifice is 6 mm.For whether four-orifice plate or five orifice plate,the gas flow rates acting as the boundary which is obtained according to experimental results is near the numerical values which satisfy the equal relation between Eq.(26)and corresponding Eq.(25).Because the flow pattern becomes very complicated as the number of orifice increases,it is very difficult for the measurement instrument of this work to study the bubble characteristic by the multi-orifice plate applied in industry.In the future work,the design principle for industrialmulti-orifice plate will be studied systematically.
5.Conclusions
This work pays attention on a specific type of gas sparger which is composed of a multi-orifice plate and a large gas chamber.The relation between sparger construction and aeration performance is studied by experimental measurements and theoretical analysis.In order to characteristic the aeration performance of multi-orifice plate,a new parameter,EBT,is proposed and verified by the image processing method.
·The TPNABOofhigh NABObecomessmalleratthe end ofweeping,because the simultaneous bubble generation at multiple orifices is suppressed and the utilization efficiency of open orifices gets worse.So the gas sparger configuration and gas flow rate should be designed to avoid weeping phenomenon.
·Due to the elongation effect of the previous bubbles,the smaller pitch of orifices can improve the aeration performance.When the pitch of orifice is above 4 mm or gas flow rate is beyond 0.35–0.7 L·min-1,the in fluence of the pitch of orifice can be ignored.
·EBT,as a new parameter considering both NABO and average bubble interval is proposed to analyze BDV.The average BDV refer to EBT is proved to be accurate by the image processing method.Under most conditions,the average BDV is applicable.
·An improved theoretical model is established to describe the bubble formation process of multi-orifice plate.The theoretical model considers the wave effect of previous bubbles at adjacent orifices and includes an overall force balance for bubble formation.The relationship of the average BDV and gas flow rate which is predicted by theoretical model is consistent to the experimental results.
·According to the relative relation between gas flow rate and chamber volume,the pressure variance of gas chamber is subdivided into ACPC and NACPC.As the gas flow rate is under ACPC,the average BDVmaintains almost constant,but increases with the gas flow rate under NACPC.
Nomenclature
a Bubble radius,m
ascProjected radius of spherical cap bubble,m
b Multi-orifice plate thickness,m
C Circularity degree of bubble projection
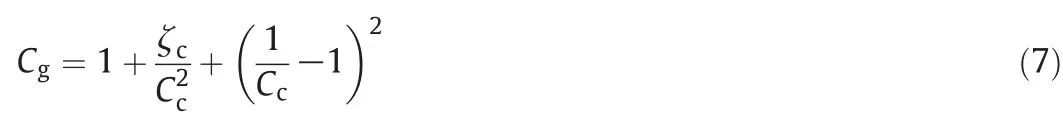
CcShrinkage coefficient of section
CDDrag force coefficient
CgOrifice coefficient for gas flow
FBBuoyancy force,N
FiInertial force,N
Fd′ Overall drag force,N
FσSurface tension force,N
g Acceleration due to gravity,m·s-2
h Distance from lower surface of bubble to orifice,m
k The number of active bubble orifice in experimental results
kbResistant coefficient
M Molecular weight,g·mol-1
N The number of active bubble orifice in theoretical model
NcCapacitance number
NReReynold number of detached bubble,(=2ascUTρL/μL)
PbBubble pressure,Pa
PcGas chamber pressure,Pa
PoLiquid pressure at orifice,Pa
PwWake pressure,Pa
PwsWake pressure at distance s to orifice,Pa
P∞Static pressure at orifice,Pa
PwoWake pressure at orifice,Pa
Q Time-average gas injection rate to gas chamber,m3·s-1
q Gas flow rate into bubble,m3·s-1
qaMean gas flow rate though each orifice,m3·s-1
R Universal gas constant,J·mol-1·K-1
ReBBubble Reynolds number,ReB=(2a(d a/d t))/μL
roOrifice radius,m
s The distance between bubble center and orifice,m
T Solution temperature,K
t Time,s
taAverage bubble interval time,s
teEffective bubble time,s
tiThe total time of NABO equal to i,s
U Bubble rising velocity,m·s-1
UTTerminal rising velocity of spherical bubble cap,m·s-1
VBBubble volume during bubble formation in theoretical model,m3
VbeAverage bubble detachment volume processed by Eq.(22),
m3
VbfBubble detachment volume calculated by Eq.(25),m3
VbpBubble detachment volume calculated by Eq.(26),m3
VbtBubble detachment volume calculated by theoretical model,m3
VcChamber volume,m3
v Liquid kinematic viscosity,m2·s-1
ΔP Pressure difference between bubble and chamber,Pa
ϕ Velocity of potential,m2·s-1
α Intersection angle between camera lens and transparent face,(°)
γ Adiabatic exponent
εlAdded mass coefficient
ε1Added mass coefficient
ζcContraction coefficient
ηcThe error of calibration in image processing method
ηithe integral error of image processing method
ηPThe error of resolution in image processing method
ηrThe error of refraction in image processing method
θ Angular coordinate position
μ Dynamic viscosity,N ·s·m-1
ρ Density,kg·m-3
σ Liquid surface tension,N·m-1
χkTime portion of NABO equal to k
Subscripts
f The following bubble
g Gas
L Liquid
P The previous bubble
sc Spherical-cap bubble
杂志排行

Chinese Journal of Chemical Engineering的其它文章
- Experimental investigation on flow characteristics in circular tube inserted with rotor-assembled strand using PIV☆
- PIVexperimentand large eddy simulation ofturbulence characteristics in a confined impinging jet reactor☆
- CFD predictions for hazardous area classification
- Hydrate agglomeration modeling and pipeline hydrate slurry flow behavior simulation☆
- Improving the performance of a thermoelectric power system using a flat-plate heat pipe☆
- Extending the EMMS/bubbling model to fluidization of binary particle mixture:Formulation and steady-state validation☆