A GIS Integrated Water Quality Model SystemBased on SWMM, ECOM, and RCA
2019-01-21,-
, -
(1.Remote Sensing Department, Chongqing Survey Institute, Chongqing 401121, China; 2.Chongqing Engineering Research Center of Geographic National Condition Monitoring, Chongqing Survey Institute, Chongqing 401121, China)
Abstract:Water Quality Model System(WQMS) is an important approach to analyzing aquatic situation and supporting environmental decision. However, the usage and promotion of WQMS is largely limited by amounts of parameters, complex conditions and enormous operations. A GIS integrated system of urban water environment coupled with SWMM (storm runoff model), ECOM (hydrodynamic model) and RCA (water quality model) was constructed in this study, with the production and transformation of contaminants in large scale taken into consideration. This integrated system guaranteed an independent calculation and multi-model coupling calculation, including convenient pre-processing, fast and efficient model running and results visualization in different spatial and temporal scales, in the purpose of simplifying the usage and promotion of complex models and providing necessary understanding required in water resource managing and water pollution controlling, and ultimately improving decision making capability. The functionality of the proposed system was illustrated by a case of Wuhan city.
Key words: GIS integration; Water Quality Model System; SWMM; ECOM; RCA
1 Introduction
With the rapid development of economy, water environmental issues have become increasingly prominent, which seriously restricts economic development in return. Technical support system for water environment management is in urgent need. The use of numerical models is the most feasible approach to solving hydrodynamic and pollutant transport problems. However, such complex models generally involve vast amounts of geographically-referenced information, and thus require enormous efforts in preparation of input data as well as in handling of output results for interpretation (Sandyetal., 2009)[1]. Fortunately, geographic information system (GIS) has been widely adopted for use with hydraulic and hydrologic computer models providing functions for data storage, calculation of required parameters, data manipulation, and output processing (Tsanisetal.[2], 2001). It is effective to apply GIS to water environment modeling and management (Wangetal.[3],1998; Xuetal.[4], 2003; Xieetal.[5], 2004; Wangetal.[6], 2001; Zhangetal.[7], 2005). Over decades, numerous efforts have been made to integrate hydrodynamic and pollutant transport models with GIS. Dobbins[8]developed the river shipping accidental pollution risk management decision support system(2001). Panetal.[9-10](2003, 2004) brought forward a developing idea of water quality emergency and warning system based on Web Service/Web GIS. With database management as development platform, Zhuetal.[11]integrated GIS component with a coupling numerical model of water quantity and water quality, and built up a visual dynamic-information-system-oriented management and decision layer (2006). Xiaoetal.[12]integrated one-dimensional river water quality model with GIS and established a quality warning and predicting system for Hanjiang River in Wuhan(2005). On the basis of study in water pollutant numerical model, Pengetal.[13](2007) built up a management system of sudden water pollution accident for the Three Gorges Reservoir area in Wanzhou with GIS tools.
Most of the above researches have facilitated in handling the large amounts of data involved in pre-processing and post-processing tasks, model parameterization, and evaluation as well as visualization of results. However, there are several deficiencies among these researches:

Fig.1 Conceptual diagram of WQMS
(1) Hydrodynamic and pollutant transport models generally involve vast amounts of geographically-referenced information, and thus require enormous efforts in data preparation and results analysis. Few researches have been done for the purpose of simplifying the models.
(2) Most of the water quality model management systems are single model integrated ones rather than multi-model coupling calculation.
(3) Adopting MapObject, ArcObject, ArcEngine or other secondary developments used widely by current researches will lead to high costs and low flexibility.
Aiming at a user-friendly interface for the management of daily urban water resources and water environment pollution emergencies, an urban water quality model system (WQMS) integrated with rainfall runoff, hydrodynamic and water quality models is established in this paper.
2 Technology and method
This integrated system guaranteed an independent calculation, or calculation of multi-model coupling including convenient pre-processing, fast and efficient model running and model results visualization in different spatial and temporal scales, for the purpose of simplifying the use and promotion of complex models.Fig.1 shows a conceptual diagram of WQMS. Model pre-processing, execution and post-processing procedures are completely carried out within the GIS menu-driven graphic user interface.
2.1 Basics of the model
2.1.1 SWMM
The Storm Water Management Model (SWMM) is a dynamic rainfall-runoff simulation model used for single event or long-term (continuous) simulation of runoff quantity and quality from primarily urban areas. The runoff component of SWMM operates on a collection of subcatchment areas that receive precipitation and generate runoff and pollutant loads. The routing portion of SWMM transports this runoff through a system of pipes, channels, storage/treatment devices, pumps, and the flow rate, flow depth, and quality of water in each pipe and channel during a simulation period comprised of multiple time steps.
2.1.2 ECOM
Estuarine, Coastal and Ocean Model(ECOM) is designed to simulate with as much realism as possible time-dependent distributions of water levels, currents, temperature, salinity, tracers, cohesive and noncohesive sediments and waves in marine and freshwater systems.
2.1.3 RCA
Row Column AESOP(RCA) is a Row-Column version of AESOP(Advanced Ecological Systems Operating Program),HydroQual’s general-purpose water quality modeling computer code. RCA was developed to directly interface with HydroQual’s general circulation model, ECOMSED(ECOM with Sediments), which eliminates the need to use ECOSOP, the hydrodynamic water quality model interface program that is required to link ECOMSED and AESOP.
Both RCA and AESOP solve general mass balance equations for water quality variables of interest. The principle difference between RCA and AESOP is that RCA obtains its advective and dispersive transport fields from a hydrodynamic model, whereas in AESOP the transport fields are specified by the user based on kinematic box analysis or via calibration to a conservative tracer variable such as salinity.
A second difference between the two computer codes is that RCA has been written to take advantage of the parallel processing capabilities of Cray or SGI(Silicon Graphics) computer systems and, therefore, should be faster than an equivalent AESOP model with the same number of segments.
2.2 Component GIS
Components GIS is an application of OPP(Object Push Profile) and components software technology in GIS software developing, which provides new solutions to many problems faced by traditional and conventional GIS. Based on component object platform, main modules are separated into lots of controls containing different functions. Component GIS, compared to conventional GIS which mainly communicates with users and secondary developers by menus, tool-bars, commands or secondary development language, has many advantages such as seamless and efficient system integration, convenient developing, high degree of flexibility and good extension. With properties, methods and events, interaction among Component GIS, users and client programs can easily save development costs and operating space, and at the same time, ensure higher security and stability. The interaction between Component GIS and other components in integrated system is given in Fig.2.

Fig.2 Interaction between Component GIS and other components in integrated system
2.3 Integrated technology
Based on Visual Studio 2008 platform and C#, an integrated system coupling SWMM, ECOM, and RCA models with components GIS is built in this paper, in which pre-processing, modeling, post-processing and results demonstration are all implemented by graphic interface. Complex models as well as the modeling results can be easily handled by users (refer to Fig.3).

Fig.3 Architecture of integration
3 Study area
Located in central China, Wuhan has dense social and economic activities, a large population and a developed water system. Hanjiang River, which is a main water resource and also the water supply of South-North Water Diversion Project, injects into the Yangtze River here (Fig.4), thus makes Wuhan of important significance in geography.

Fig.4 Water distribution in the study area
With a rapid development of society and economy in recent years, blooms and other environmental problems of water and water environment management issues become increasingly prominent, and have brought about adverse effects on the economic development and people’s living. Research on water environment simulation technology and water environment management is necessary and urgent. Construction of urban water quality model system is of great importance on the coordination of regional socio-economic development, effectively supporting scientific management of water environment, responding to the “Rise of Central China” and the construction of “8+1” City Circle and “Two-type Society” campaigns.
4 Case study
4.1 Pre-processing
Pre-processing is mainly to provide hydrodynamic conditions, water quality parameters and boundary conditions. The main parameters are shown in Table 1.

Table 1 Main parameters of SWMM,ECOM,and RCA models
4.2 Model execution
The result from SWMM as input condition can be passed into ECOM, and the hydrodynamic process calculated by ECOM can also be initial condition to drive RCA model. Separated and combined modeling is shown as follows (see Fig.5).

Fig.5 Executions of SWMM, ECOM, and RCA models
4.3 Post-processing
Through the model and the model pre-treatment, water quality model simulation results are obtained.It’s very necessary to present the results intuitively and visually. Combined with SharpMap component library, this research contains such key steps as achieving the water quality concentration scores, grade rendering which involves color table, coordinate transformation, contour rendering, etc.
4.3.1 Color table
In this paper, eight colors ranged from blue to red are selected, and the values of initial and final colors are assigned to the minimum and maximum concentration. Based on inverse distance weighting method, different concentrations are given different colors.
Basic color table is: “# 0000ff”,“# 00c896”, “# 00ff00”, “# a0ff00”, “# ffff00”, “# ffb400”, “# ff6000”, “# ff0000”. Normalizing the color table into 0-1, and seven thresholds between this range are yielded. Each concentration’s color can be calculated by weight of corresponding threshold’s left and right endpoints using IDW method.
4.3.2 Coordinate transformation
4.3.2.1 Translation transformation
After translation, each point on the image can be found in the original image corresponding to the point. For example, (0,0) pixel in new image can be found in the original image at the corresponding pixel(-Tx, -Ty). Like formula:


(1)
4.3.2.2 Scaling coordinates
Scaling factorSxandSycan be set as any positive real number. When value is less than 1, the size of the object will be reduced, and vice versa. If bothSxandSyare equal to 1, then the size of object will not be changed. WhenSxandSyare assigned the same value, the object will zoom with the same aspect ratio. See the formula as follows:

(2)
4.3.3 Rendering and Control

Fig.6 Display of SWMM, ECOM, and RCA modeling results
After acquiring the data of calculated result of water quality model, it is possible to lay out the data which is fused and coupled with grid data in the map. Based on the inheritance and extension of RangeChart class of SharpGIS Lib,the warning model data is demonstrated. The control of display, which makes it possible for users to manipulate it visually depended on their demands and acquires the requiring information, has great importance in the process of dynamic view. Display control is not only action such as pause, continuation, and halt, but also operations like options of indexes of water quality and demonstrable layers and legend control which is provided to control water quality indicator because of the difference of various value range of the different indexes in water. The display of calculated result of model and inquiry of statistics are depicted in Fig.6. Fig.7 shows the dynamic diffusion of pollutant density in sudden water environment as time goes on,and Fig.8 shows the pollutant density curve of sensitive points.

Note:Fig.7 is a partially magnified diagram of Fig.6(c)Fig.7 The dynamic demonstration of sudden water environment risk’s pollutant density dispersion
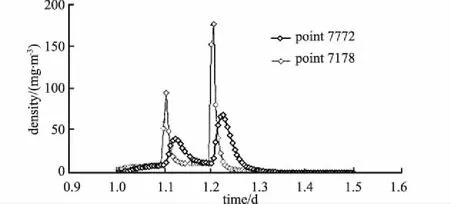
Fig.8 Pollutant density curve of sensitive points
4.4 Model verification
On one hand, the system realized real-time displaying of program calculating and processing from the background to the foreground in user’s interface, achieving the purpose of visualization; on the other hand, the system saved the time of input and output between models which required lots of manual intervention.
Compared with conventional calculation,the simulation outputs of this system are of the same because of the same calculation model and method. However, the outputs of the simulation still need to be verified by actual measured data obtained by conventional monitoring means. The starting time of program operation is the first day of time series in the comparison and verification.
The comparison between the simulated outputs and the actual measured values of the three models is shown in Fig.9. It can be seen that the simulated values agreed well with the measured values, and the trend was consistent, while some peak slightly delayed. This deviation may be due to the discrepancy between observed hydrological data adopted and the hydrological conditions in actual, which are always in variation.

Fig.9 Comparison between simulated and measured values of SWMM,ECOM,and RCA
The water area in this region is large and the underwater topography is complex. Temperature limiting factors at different times and complex topographic conditions at different locations are different. The growth rate of organisms, such as growth characteristics of algae, composition ratio of species, and other parameters are also very different. What’s more, the physical, chemical and biological processes of different hydrolo-gical and nutrient loads are quite different due to the joining and exchanging among streams. Even in the same stream, the processes of changes in different regions and at different times are also quite different. The above factors cause great difficulty to the accuracy of ECOM and RCA prediction ultimately.
This study shows that the simulation outputs of the model are reasonable and reliable, and can be used for simulation. However, it is necessary to pay attention to the adoption of hydrological observation data as accurately as possible. For example, the calibration of parameters, such as sampling frequency, sampling time and sampling location directly affects the validation results of the model. In the next study, further consideration should be given to the environmental pollution caused by human activities and the strong impact of human activities on the structure of ecosystems, because the hydrodynamic processes are more complex, and the resuspension and nutrient cycling are more complex in practice.
5 Conclusion and prospect
The WQMS is a GIS integration system closely coupled with SWMM, ECOM and RCA providing functions of data pre-processing, model execution and post-processing. This system will enhance the usage of the three complex models through a simple and easy-to-use graphic user interface, and consequently, simplify and promote the usage of the simulation models. Based on storm runoff and hydrodynamic processes calculated by coupling SWMM and ECOM, pollutant transport will be simulated and displayed in spatial and temporal context with the visualization techniques in WQMS through RCA modules as demonstrated in this paper.
In this age of vast information availability, decision makers must work to develop improved tools to disseminate and interpret the increasing amount of available data. This advanced user-friendly and multi-model coupled application will work to provide necessary understanding required in water resource managing and water pollution controlling, and ultimately improve decision making capability.
