Bed roughness adjustments determined from fractal measurements of river-bed morphology *
2018-10-27YinjunZhou周银军JinyouLu卢金友LiChen陈立JieRen任杰
Yin-jun Zhou (周银军), Jin-you Lu (卢金友), Li Chen (陈立), Jie Ren (任杰)
1. Changjiang River Scientific Research Institute, Wuhan, 430010, China
2. Three Gorges Water Conservancy Complex Cascade Dispatch & Communication Center, Yichang 443000,China
3. State Key Laboratory of Water Resources and Hydropower Engineering Science, Wuhan University, Wuhan 430072, China
4. State Key Laboratory Base of Eco-Hydraulic Engineering in Arid Area, Xi’an University of Technology, Xi’an
710048, China
Abstract: The flow resistance in rivers is an old and partly unsolved problem.In this study, the bed surface fractal dimension (BSFD)is used to describe the bed morphology, and combined with the bed roughness, a general model experiment is developed.The results show that there is a positive relationship between the BSFD and the bed roughness, which can be further applied to estimate the roughness changes in rivers.These findings will also guide further studies of the mobile-bed flow resistance.
Key words: River, roughness, bed surface fractal dimension, bed morphology
Introduction
The river-channel flow resistance or roughness is a key parameter for the analysis of the river processes and their simulations[1].In some equilibrium channels,the bed roughness relatively is a constant, but, the climate change and the human activity can make a frequent roughness change.The river morphology data can be obtained fairly easily[2], and used to calculate the roughness without using the water level,the velocity and the discharge data.
A riverbed is a complex three dimensional and multi-scale structure including the bed form.A simplified method is to use the longitudinal slope, the width-depth ratio and some plane form parameters.To date, a quantitative method of the roughness calculations is not available for obtaining the entire bed morphology in multiple scales[2].
In other fields, the fractal dimensions were used to evaluate the rough or smooth surfaces[3-4], and by geomorphologists to describe the complexity of catchments and soils[5-6].Studies were also conducted to obtain fractal dimensions of longitudinal thalweg,plan forms and cross sections[7-10].Liu et al.[11]applied the fractal theory to study the soil characteristics and the related process.To understand the correlation of the total soil P (TSP) and the fractal dimension (D)with the soil depth and the slope gradient, Ni et al.[12]used some variable dimension fractal analysis methods to study the river flow discharge.Shen et al.[13]described the relationship between the river plan form fractal dimensions and the regional tectonic evolution in the Yellow River.But so far no fractaldimension applications of an entire riverbed surface morphology were reported.Zhou et al.[14]developed the river bed surface fractal dimension (BSFD) to quantify the complexity of the entire river bed surface including the plan form, the longitudinal and cross sections and the space morphology.
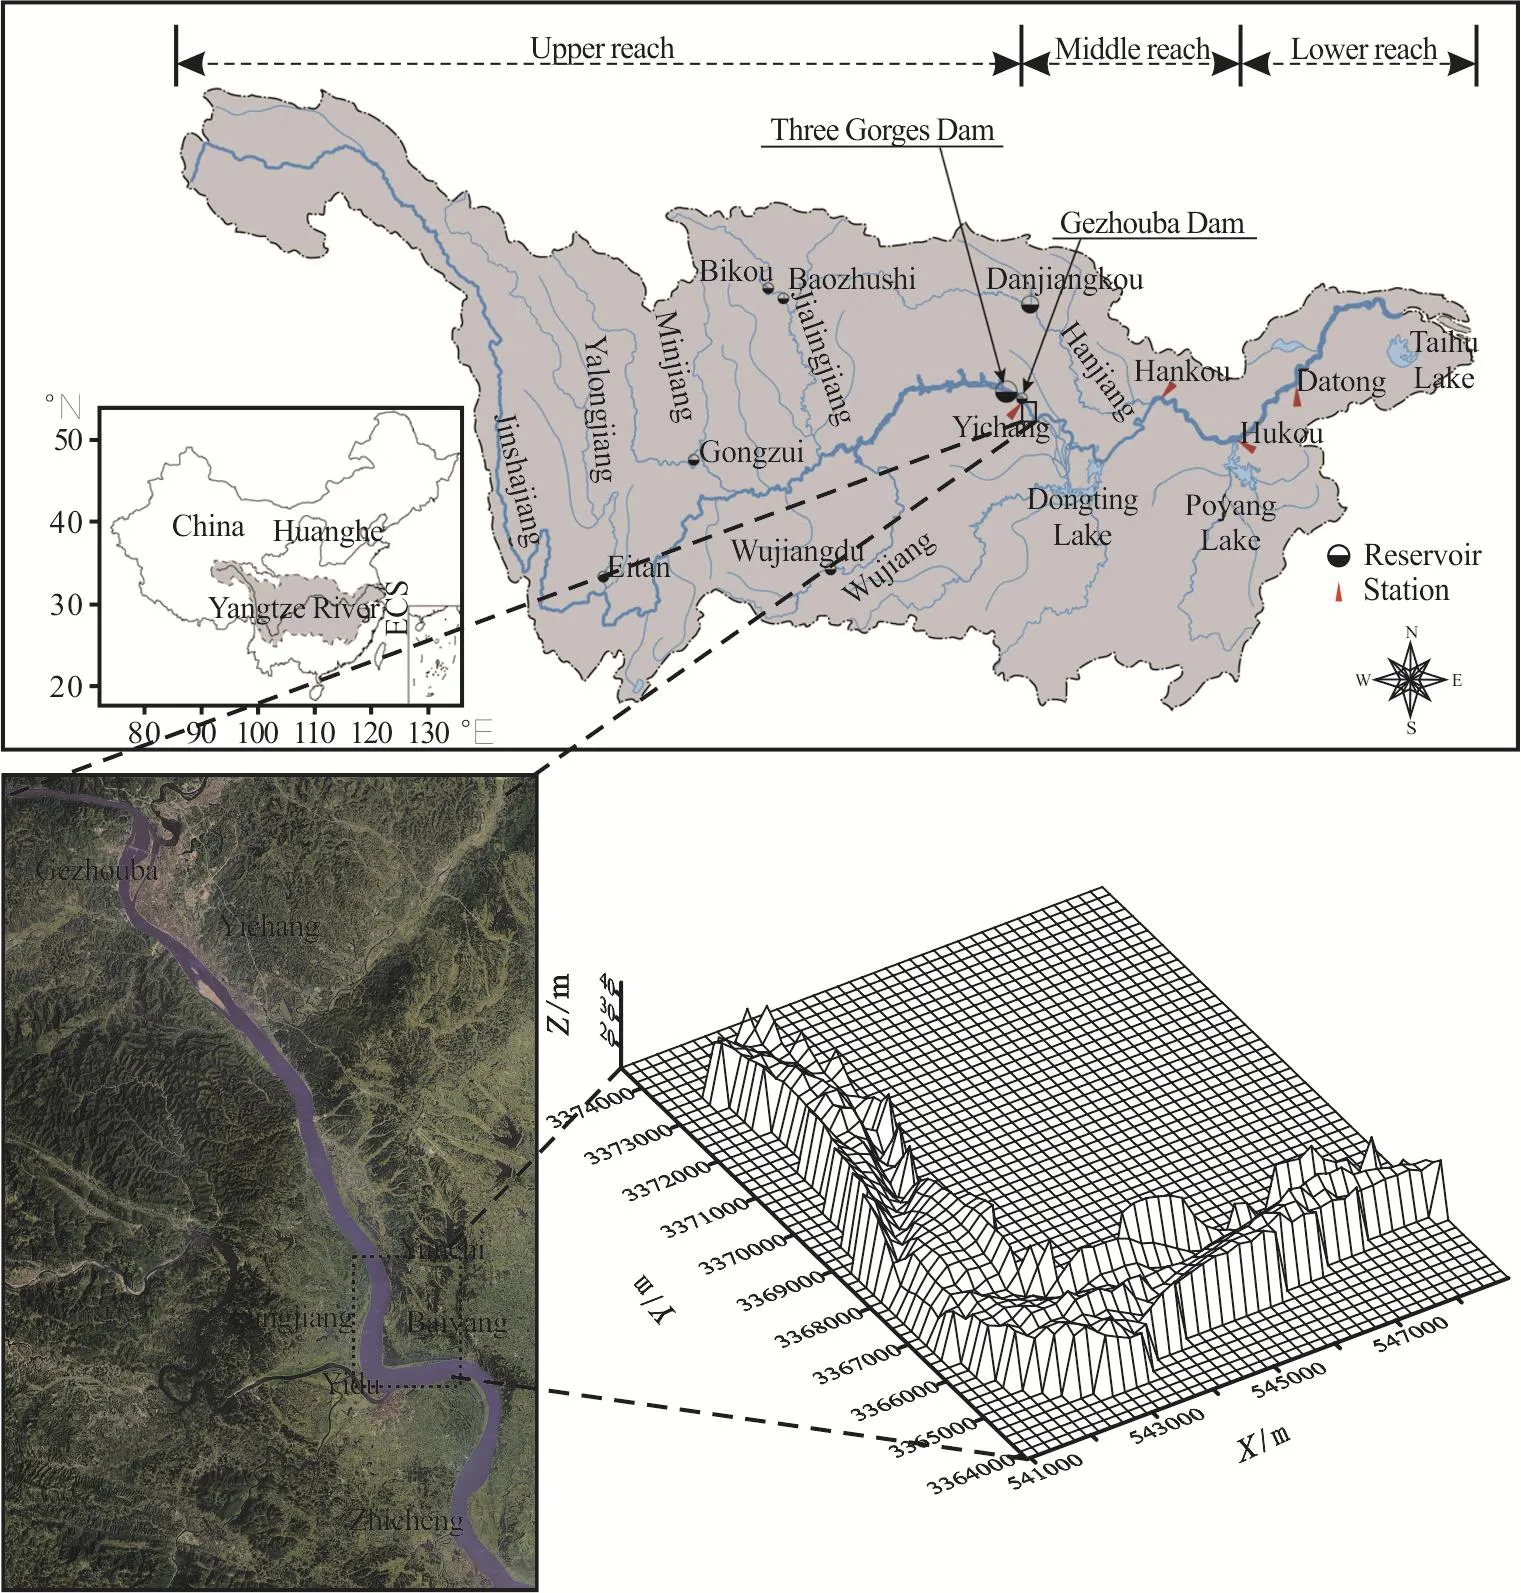
Fig.1 (Color online) Schematic view of the projection covering method applied in the Yidu Reach, Yangtze River.The map of Yangtze catchment is cited from Hu et al.[17].Because of no enough data, the attitude of flood plain in Yidu Reach is as assumed to be 0, only the channel DEM is the target of the BSFD calculation
Because the riverbed morphology includes three basic factors, the upstream runoffs and sediments, the river boundary and the downstream erosion base level,it affects the flow structure, the flow resistance, the sediments transport, and the riverbed readjusts, as the boundary of the river flow and the sediment movement[15].So the BSFD can be used to identify the river regime, the river pattern and the resistance.
This paper uses the river bed surface fractal dimension to describe the river bed morphology, and then investigates the relationship between the BSFD and the channel roughness through a generalized modeling of different channel patterns.The bed roughness is then calculated based on the river bed fractal dimension.This method can be used for estimating changes of the roughness coefficients during the river bed erosion and deposition, and having an insight into the relationship between the river resistance and the river fractal characteristics.
1.Bed surface fractal dimension calculation
The BSFD calculation is a specific field in the application of the fractal theory because it involves the entire surface and irregular boundary.There are three main methods to calculate the regular surface fractal dimension in this emerging field: the Profile Line fractal dimension plus 1, the surface area-scale,and the cubic covering method.At present, there is no standard specifications available[16].Here, we choose the surface area-scale method to calculate the BSFD,because with this method, different scales can be used to calculate the surface area directly without any assumption or simplification.The BSFD calculation method is as follows:
(1) Establish a river bed surface DEM from the field observed data, and then use the GIS software to extract the altitude text, as the target of the fractal dimension analysis.
(2) Use the projection covering method (one of the surface area-scale methods[16]) for the fractal analysis of the river bed DEM, to calculate the fractal dimensionDof the river bed surface as
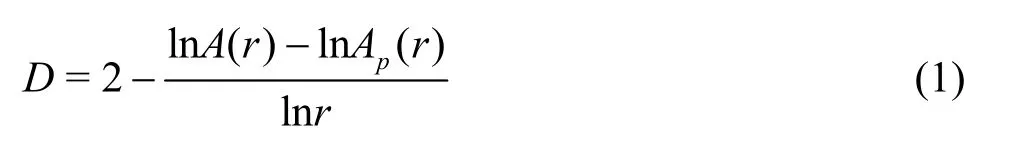
whereA(r) andAp(r) is the the surface area and the flat area of the riverbed covered by different scales,ris the different measurement scale, andDisthe riverbed surface fractal dimension, with a value in the range of 2-3.For a regular boundary,Ap(r) is a constant, and can be taken to beC0.If the boundary is irregular as in nature Rivers, with different measurement scalesr,Ap(r) varies.Then, by fitting a straight line for the relation between2ln(A|r) and lnr, one obtains the slopeK.Therefore, the bed surface fractal dimensionD=2-K.Figure 1 is the schematic view of the Projection Covering Method.The example is the Yidu reach, locating downstream the Three Georges Dam and the Gezhouba Dam, the Yangtze River, and is the first bend reach in the middle stream of the Yangtze River.Figure 2 shows the typical result of the BSFD computation.
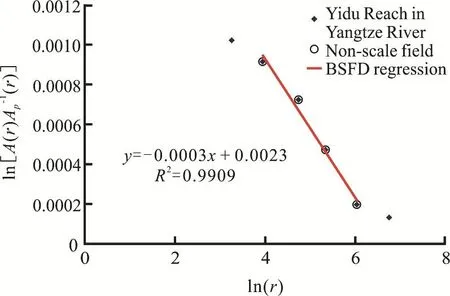
Fig.2 (Color online) Bed surface area and a double logarithmic relationship
In addition, there is a problem about the nonscale field determination in the BSFD method.In this paper, an artificial criterion is used to determine the non-scale field.As shown in Fig.2, the red straight line is the non-scale field.The scalerand the non-scale field determination will have an influence on the fractal dimension calculation result in some tests.After relevant tests, for the limitation of the measurement accuracy in the channel model experiment, this non-scale field of the model reaches is set into an area of (25 m, 25×24m).
2.Experiment
2.1 Model design
Different river patterns have different properties with respect to the river process and the roughness change.A physical model experiment is designed to reveal the relationship between the BSFD andnin different typical channels for measuring the riverbed topography and obtaining the synchronous flow data.
The experiment is conducted in a scaled physical model (with the horizontal scaleλl=1000 and the vertical scalehλof 50), which can replicate the middle stream reaches of the Yangtze River in the CRSRI laboratory in Wuhan, China, and the resistances for different river-bed deformations are studied.The inflow conditionsQ, the water depthhand the channel patterns are all tuned separately to form the bed morphology and the roughness changes.In the experiment, three generalized channel patterns are created, including the straight, meandering and anabranching channels, and five inflow discharges are set from the flood to the drought with the corresponding two cases of water depth, and we have four groups for each pattern andQ-hrelationship.The model geometric parameters and theQ-hrelationship are calculated by the generalized model scale.
The model scale is designed following the horizontal scale λl=1000 and the vertical scaleλh=50 in view of the laboratory space and other reasons like the experimental material consumption, other important scales as listed in Table1.
The model is for the Yangtze River middle and lower reaches, where the sediments runoff is small after the storage of the Three Gorges Reservoir from 2003, so no sediment is put at the model flume inlet.
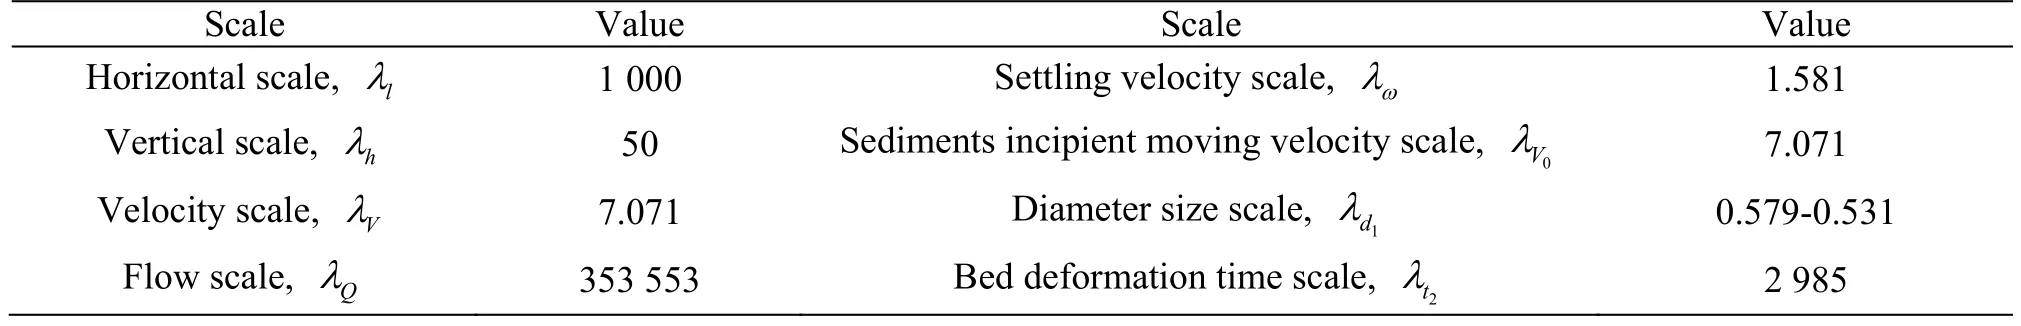
Table1 Generalized model scales in the experiments

Fig.3 (Color online) Initial shape and size of each generalized model
The bed material in the model is selected through the scale (Table1) calculation of the sediment diameter in the middle reach of the Yangtze River, and the coal powders of diameter ranging from 0.3 mm to 0.5 mm are adopted, with the non-uniformity coefficient, so uniform sediments are assumed.The flume is designed as a mobile bed and the bank is fixed.Initial shape and size of each generalized model are shown in Fig.3.
The length of the anabranching channel model is 30 m, the overall bed slope is 0.053%, the reaches near the inlet (inlet-CS5) and the outlet (CS25-outlet)both are 10 m in length with fixed-bed, which can dissipate the energy and adjust the turbulent condition through a long distance before flowing into the branch reaches, both with a slope of 0.04%, a width of 0.80 m.The length of CS5-CS25 is 10 m, the slope of the straight branch is 0.08%.The bottom width of the two branches is 0.35 m.The middle island is 7.30 m in length, 2.30 m in width, 0.30 m in height 0.30 m, and its bank slope is 1:3.The flume from CS7-CS21 is designed as a mobile bed and the measurements are taken here, and the length of this reach along the bending branch is 7.70 m.
The straight channel model is designed on the basis of the anabranching model.The lengths of both the straight and bifurcation channels are the same, but the study reach length is 7.75 m in the straight channel case, the measuring location is at the middle point of the 30 m long flume, the cross section is generalized as a rectangle of 1 m in width.In order to ensure the smooth flow in the test section, the width transition reaches are set in both the upstream and the downstream.The rest arrangement of this test and the anabranching channel model are basically the same.
The inlet and outlet reaches of the meandering generalized model are also the same as the anabranching model, with the channel curvature of 1.11, the curve length of the centerline is 7.76 m, the curve angle is 91°, the curve radius is 4.90 m, and the model is generalized into a rectangular cross section with a width again of 1 m.
Some characteristics of the three modeling channels can be found with the same geometric parameters,the study reach length and the averaged bed slope.The width of the study reach in both the straight and meandering channels is 1 m, which is about the width of the bifurcation channel with a medium water stage.The different plane geometric shapes are used to highlight the differences in the channel pattern.
2.2 Cases and measurement items
2.2.1 Cases
Four basic groups are made according to three channel patterns and twoQ-hrelationships (normal depth and potential depth).
With the statistical annular hydrological data of the Yangtze River, we generalize the flow dischargeQand the water depthhinto five grades.Among them, flow 1 represents the small discharge, corresponding to the drought flow, flow 2 and flow 3 represent the medium flow, corresponding to the natural water flow in rivers or in a medium water year,flow 4 represents the bankfull flow, flow 5 represents the large flow, corresponding to a catastrophic flood.In these grades, eachQ-his converted to the model scale.After the storage of the Three Gorges Reservoir,the bed erosion and the down cutting will occur in the middle stream of the Yangtze River, the water depth will change significantly in the same discharge.So twoQ-hrelationships are designed, one is for the normal data, the other is for the potential data.The twoQ-hrelationships are used with the three channel patterns (the anabranching, the straight, and the meandering ones) to form four basic groups in the experiment.Group A is the anabranching channel pattern with the potentialQ-h, group B is the straight channel pattern with the initial potentialQ-h, group C is the straight channel pattern with the normalQ-hand group D is the meandering channel pattern with the normalQ-h.
The testing parameters for each generalized model are listed in Table2.
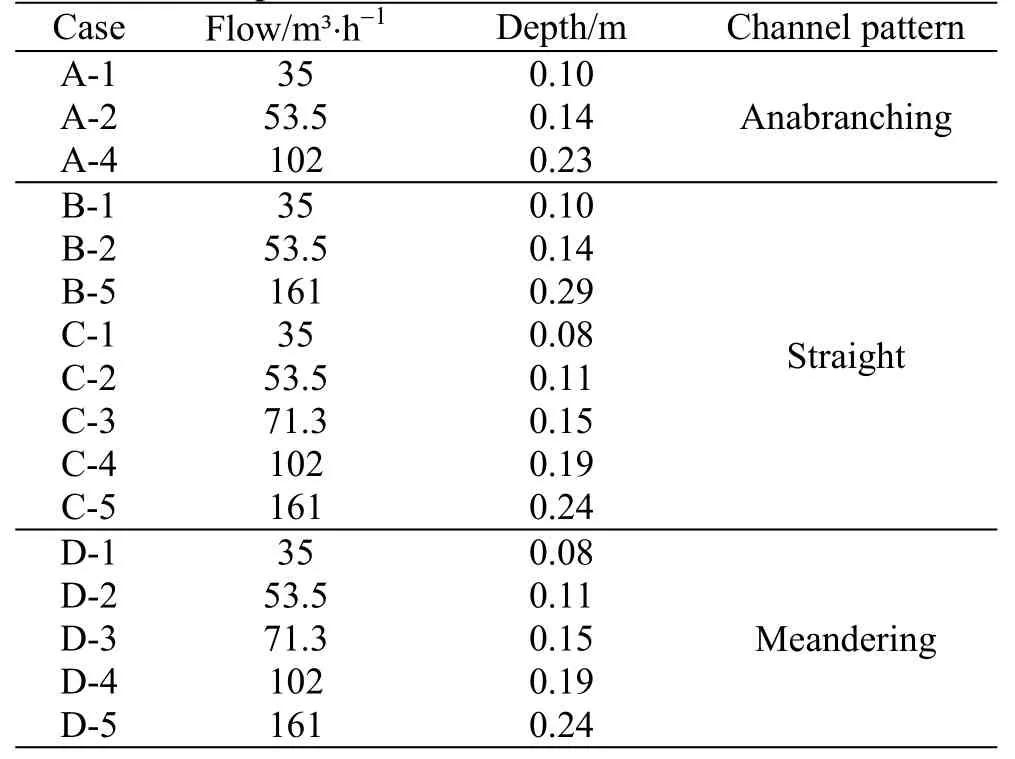
Table2 The experimental cases
2.2.2 Measurement items
(1) Flow slope: for several stations, with the measuring accuracy of 0.1 mm, the water level of each station is measured synchronously.
(2) Flow velocity: for several cross sections, with one vertical line every 0.10 m in each cross section,the three-point law is used to measure the longitudinal velocity of the flow with the propeller current meter.
(3) Bed morphology: the initial topography and the topography after scouring and silting are measured,with the test section spacing of 0.50 m, the measuring point density of one point per 0.05 m on each section,and the bed elevation data used to create the bed DEM and calculate the BSFD.
It is worth noting that for each group of experiments, observations are generally made six times(including the initial time), one time per 3h.The 3hmodeling process stands for one year natural process approximately according to the time scaleλt2calculation for the real time, that is, the continuous discharge time of each test is not less than 15 h.The flowing slope, the velocity and the bed morphology are measured synchronously each time.
3.Results
3.1 Impacts on river resistance of BSFD
First the BSFD is calculated using the bed elevation data obtained in the experiment.Then, with the measured flow slope and velocity, the Manning roughness coefficientnis calculated as
whereis the mean river area of the import and export cross sections in the flume,is the mean discharge of the import and export cross sections,is the mean hydraulic radius of the import and export cross sections,Jisthe flow surface slope.
Figure 4 shows the relationship between the BSFD and the roughness coefficientn.As can be seen from Fig.4, the BSFD has a positive correlation with the roughness coefficient.

Fig.4 (Color online) Relationship between BSFD and integrated roughness coefficient
During the river flow process, the energy will be consumed to overcome the river resistance from the boundary and the turbulence.The main river flow energy consumption is the turbulent energy dissipation from the river boundary, where the mechanical energy is converted into the turbulent energy, as an essential part of the flow resistance.The turbulence origins are often in the wall roughness and the surface friction on the flow boundary, or in the irregular boundary morphology, such as the sand waves and the silting bars.This paper uses the BSFD to express the riverbed complexity and roughness.As the BSFD increases, the bed surface irregular degree increases,the flow turbulence enhances, the energy loss increases, and the integrated roughness also increases.
3.2 Roughness estimation
In this experiment, the uniform sand is used as the bed material, without considering the coarsening effect in the erosion process, so in the case when the flow conditions do not change significantly, the grain resistance can be as assumed to take a certain value,and the both sides of the channel banks are cement surfaces.The roughness of the river banks can also be assumed to take a certain value.Obviously, the changes of the roughness are caused by the river bed morphology that mainly produces the sand waves, the bars erosion and causes the river regime changes, so the changes of the roughness can be expressed by the BSFD.
In the initial state of each case of experiment, the bed is flat, the initial comprehensive roughness can be set ton0, then the roughness change isn-n, and the BSFD is represented byD-D0.The chart ofn-n0~D-D0is shown in Fig.5.
From Fig.5, it is shown that there is a clear positive correlation between the BSFD and the roughness, not a linear relationship.We use the exponential regression to fit a part data ofn-n0andD-D0, on the right side of theY-axis, and the fitting curve is

But, whenD-D0<0, a complex number will be obtained from Eq.(3), so we rewrite it as
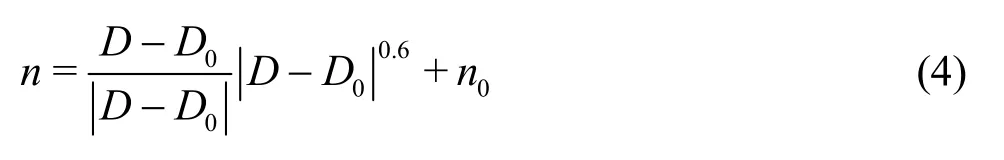

wherenis the integrated roughness coefficient,Dis the BSFD value,D0is the initial BSFD value,n0is the initial roughness coefficient.The computed curve of Eq.(5) is shown in Fig.5, with the calculated and the correlation coefficient of experimental values
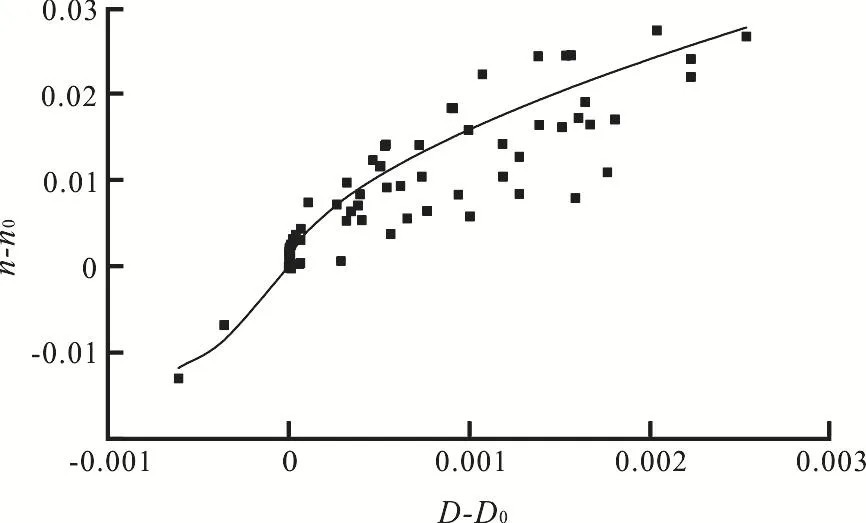
Fig.5 BSFD and relative roughness
3.3 Validation
The erosion and the deposition in the middle reach of the Yangtze River are complex after the impoundment of the Three Gorges Reservoir[18], and the bed roughnessnchanges year by year.These changes in some braided reaches were studied to have some observed data[19].The observed data can be used to validate Eq.(5) .The three braided reaches are the Yichang Reach, the Yidu Reach and the Lujiahe Reach.The Yidu Reach is shown in Fig.1, the Yichang Reach is 40 km upstream from it and the Lujiahe Reach is 40 km downstream from it.In Table3, the observed values ofnare from Ref.[19], the BSFD values are from Ref.[20], and the n values are calculated by Eq.(5).Figure 6 shows a comparison of observed and calculated values ofn, and they are in good agreement, so Eq.(5) can be used in actual channels.Equation (5) is obtained from experimental data of a generalized model with a general understanding of the mechanism, but differences from the actual channels do exist as follows:
(1) Uniformity of bed material.Actual channel bed material is mostly non-uniform, so the impacts of the bed material coarsening need to be considered during the roughness estimation in the adjustment process of erosion.
(2) Fixed vertical channel bank.There are few fixed vertical banks in the actual channel, and its initial section is not rectangular, generally in “U” or“V” shape with a certain slope, so the BSFD calculation should include a part of the channel bank like the bankfull channel.In Eq.(5), the changes of the bank roughness are not considered, of course,there is no change of the bank roughness in the experiment.
For all above differences between the model andthe actual channel and the scale of the BSFD, it is necessary to point out the applicability of Eq.(5):
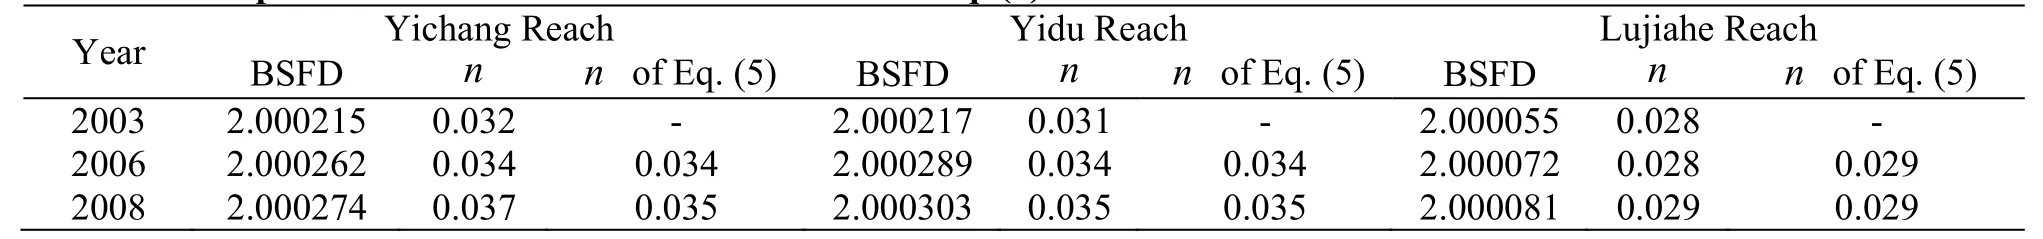
Table3 Comparison of observed data and results from Eq.(5)

Fig.6 Comparison of observed n and calculated n
(1) There is little change in the bed material, or other empirical formula is used to estimates the grain resistance changes.
(2) In Eq.(5),n0refers to the initial roughness of a certain channel, so Eq.(5) can only estimate the roughness changes of the same channel.
4.Discussion
Generally, the comprehensive resistance is composed of the bank resistance, the bed resistance and some local resistance like those from bars or shoals, and the bed resistance includes the grain resistance and the sand wave resistance.From the grain to the river regime, the river resistance is in multi-scales.The fractal dimension can affect most part of the multi-scale structure; and it can be used to describe the complexity of the bed morphology,including the sand wave, the local bars and the river regime, to study the form resistance except the grain resistance.
The Manning roughness coefficientnis a number with dimension, but the BSFD is just a number, so other parameter should be used together to establish the formula about the BSFD and the value ofn.Because the data are from the scale model experiment, we just establish an empirical relationship between the relative BSFD and the relativen.This relationship can be used to calculate the roughness coefficient changes against the initial value.It might be possible to establish a formula about the value ofD, the bed parameter and the value ofnbased on enough actual channel data.
5.Conclusions
In this paper, the river bed surface fractal dimension is used to describe the complexity of the channel bed form.From the relationship between the river bed surface fractal dimension and the bed multi-scale structure, the river bed surface fractal dimension can be used to calculate the changes of the Manning roughness coefficientnthrough the data obtained from a generalize model flume experiment, including three main channel patterns.Some conclusions are as follows:
(1) The river bed surface fractal dimension may be used to quantify the complexity of the entire bed surface.
(2) The river bed surface fractal dimension and the Manning roughness coefficient are positively correlated: when the fractal dimension increases, the roughness increases.
(3) If the hydrology data are not enough, a quantitative relationship between the river bed surface fractal dimension and the roughness coefficient given in this paper can be applied to estimate the roughness coefficient of the same river with the initial data.
杂志排行

水动力学研究与进展 B辑的其它文章
- Call For Papers The 3rd International Symposium of Cavitation and Multiphase Flow
- Improving the real-time probabilistic channel flood forecasting by incorporating the uncertainty of inflow using the particle filter *
- A selected review of vortex identification methods with applications *
- Tracer advection in an idealised river bend with groynes *
- Simulation of the overtaking maneuver between two ships using the non-linear maneuvering model *
- The effect of downstream resistance on flow diverter treatment of a cerebral aneurysm at a bifurcation: A joint computational-experimental study *