Progressive Failure Evaluation of Composite Skin-Stiffener Joints Using Node to Surface Interactions and CZM
2018-07-11SanePadoleandUddanwadiker
A. Sane , P. M. Padole and R. V. Uddanwadiker
1 Introduction
Adhesive bonding has become a popular practice for joining of complex structures which are not easy to manufacture in one piece. Adhesive joints are replacing the other joining methods, such as bolted, welded or riveted joints as they can be easily manufactured,have superior strength than the conventional techniques and they can join different materials [Adams (2005)]. Due to these reasons, utilization of adhesive joints are increasing rapidly in various industries such as aerospace, aeronautic, automotive, and marine etc. In order to use this joining technique efficiently, researchers have conducted many studies to find out their properties and performance. The use of adhesive bonding is common while manufacturing complex shaped structures, and it provides structural joints that are theoretically as resistant as the base material [Petrie (2000)].
The strength of any adhesive joint is dependent on number of factors, such as materials to be joined (adherends), the geometrical parameters, and properties of adhesive [Fernandes,Campilho, Banea et al. (2015)]. Regardless of the mentioned advantages, the application of adhesive bonding technique is sometimes not appropriate, as it requires joint preparation which is a time consuming affair. The peel resistance of adhesives is poor and the prediction of strength is quite complex [da Silva, Öchsner and Adams (2011)].Various techniques have been used for prediction of strength in adhesive joints; however most of the studies are focused on numerical or analytical models.
The numerical techniques which are primarily employed for analysis are continuum mechanics, fracture mechanics, damage mechanics, cohesive zone modeling (CZM), and the eXtended Finite Element Method (XFEM) [He (2011); Mubashar, Ashcroft and Crocombe (2014)]. Continuum mechanics techniques estimates the stress distributions in the adhesive using theoretical or numerical methods such as FEM and a preselected strength or strain based criteria is used for assessment of failure [da Silva, das Neves,Adams et al. (2009)]. Finite element method is a very useful tool to deal with complex structures and material nonlinearity [Akpinar (2014)]. Conventional fracture mechanics methods are not commonly used to assess failure of bonded joints, although the Virtual Crack Closure Technique (VCCT) has been considered in some of the studies [Clark and McGregor (1993); Xu, Liu and Wang (1999)]. It has been concluded [Campilho, De Moura, Barreto et al. (2010); Alfano (2006)] that cohesive zone model uses a strength of materials based approach to detect damage initiation and a fracture mechanics based criteria to evaluate damage growth, and provides damage response of the structure up to complete structural failure. Heidari-Rarani et al. [Heidari-Rarani, Shokrieh and Camanho(2013)] have shown that CZM is quite accurate if the traction separation behavior is properly estimated.
As compared to CZM modeling, XFEM method is able to provide better estimation of damage growth as it does not restrict the direction of crack growth to the pre-established crack growth paths [Belytschko and Black (1999)]. This method is based on the concept of partition of unity and uses conventional FEM formulation. Azevedo et al. [Azevedo,Campilho, da Silva et al. (2015)] has stated that in spite of the availability of all the other techniques, CZM based models are used most extensively for prediction of strength in adhesively bonded joints.
Various bonded joint configurations for different applications have been studied in the past. It is established by Davis et al. [Davis and Bond (1999)] that to achieve maximum performance these bonded joints should be loaded in shear. However, Zhan et al. [Zhan,Gu, Wu et al. (2016)] researchers have stated that there are some specific applications where the adhesive layer predominantly undergoes peel loads. Studies of adhesively bonded joints under this kind of loading conditions are also carried out in past [Kaelble(1959); Niesiolowski and Aubrey (1981)]. Analytical methods, strain gauge techniques and digital image correlation has also been employed [Budzik, Jumel, Imieliâ´Nska et al.(2011); Budzik, Jumel and Shanahan (2014)] to study the distribution of strain in bonded joints under peel using single-Cantilever Beam (SCB) test.
CompositeT-joints under peel loads are the most studied joint configurations by different researchers [Da Silva and Adams (2002); Grant, Adams and da Silva (2009)].
The T-shaped geometry has been used and is normalized by various standardization agencies such as ASTM, BS and ISO. The pull out test is generally performed at constant ramping speeds.T-joint has a large number of industrial application in marine structures such as joining of panels to the hull [Di Bella, Borsellino, Pollicino et al. (2010)] and connecting the glass-fibre composite hull with anti-flood panels [Trask, Hallett, Helenon et al. (2012)]. It also has aeronautical applications such as wing panels, fuselage sections[Bianchi, Koh, Zhang et al. (2012)]. Diあerent researchers evaluated the performance of adhesively-bondedT-joints, either by experimentation or analytical/numerical techniques[Segovia and Pizzi (2009); Apalak (2002)].
The current study focuses on progressive failure analysis of two different configurations of adhesively bondedT-joint namely basic and padded which are experimentally tested by Vijayaraju et al. [Vijayaraju, Mangalgiri and Dattaguru (2004)]. The literature suggests that the application of CZM for delamination/debond initiation and growth is a very popular technique however the method uses cohesive element layers at the interfaces and requires high computation time. A simplified methodology is proposed in this article,which uses node to surface interactions instead of cohesive element layers in order to detect the crack onset and growth. The traction separation properties are assigned to these interactions and load displacement data are determined for the joints which are in close agreement with the experimental results. Sensitivity studies are also performed which shows that the biggest advantage of this technique is that coarser meshes can be used and the computation time decreases significantly.
2 FE modeling methodology
2.1 Specimen and materials
In this study two configurations ofT-joint namely basic and padded are studied and the results are compared with available experimental data. The basic configuration consists of a 2.4 mm thick stiffener co-bonded with a 2.7 mm thick skin. The skin has 18 plies,web of the stiffener has 16 plies and flanges has 8 plies each resulting in a thickness of 1.2 mm. The triangular area formed by the skin and the two laps of the web known as the delta region, is filled with resin along the length of the stiffener. Flange Thickness is gradually reduced in four steps and pairs of plies are dropped with a stagger distance of 3 mm. Adhesive layers are run along the inner surface of each half of the stiffener plies and another layer of adhesive is placed between the stiffener assembly and the skin as shown in Fig. 1(a). The padded configuration has two extra plies resulting in a thickness of 0.3 mm and these are placed between skin and stringer as shown in Fig. 1(b).
Specimens are modelled using T300/914C UD lamina and REDUX 319 film adhesive is employed for bonding of the components of joint. Tab. 1 shows the layup used in different section of both the joint configurations.

Table 1: Section wise layup sequence
Tab. 2 shows the material properties for the CFRP T300/914C UD composite lamina and the film adhesive. The lamina is a transversely isotropic material having its material properties same in directions 2 and 3 (Transverse Directions) whereas the adhesive is considered as an isotropic material.

Table 2: Material properties
2.2 Modeling strategy T-joint
The four principal components namely skin, left and right stiffener legs and delta region of the joint are modeled as individual parts in Abaqus®. Material properties, layer stacking sequence are assigned to these parts. Partitions and Surfaces are created on these parts for creation of interaction in subsequent modelling stages.
Local coordinate systems were created for defining material orientation in different areas.An element edge of length of 2.5 mm was selected for the web and flange of the stiffener and the curved region of stiffener was provided 20 elements along the curvature in order to get a smooth mesh. Similar sizing was provided to the skin region and both the skin and stiffener regions were meshed using S4R conventional shell elements. The resin rich region has an element edge length of 2.5 mm along its length and 20 elements were created in the curved region. The region was meshed using C3D6 wedge shaped solid elements. A matched mesh is created for better establishment of interactions and small node adjustments were allowed. Figs. 2(a) and 2(b) shows the meshed models of basic and padded configurations respectively.


Figure 2: T-joint configurations
The commonly used methodology for simulation of debond/delamination nucleation and subsequent growth is to embed cohesive elements at the interfaces/probable crack paths.These elements are assigned traction separation based cohesive property and a damage model so that the crack initiation and growth can be detected upon loading [Sane, Peshwe,Manjunatha et al. (2017)]. In this method layers of cohesive elements with very small thickness are generated at the interfaces and connected to the bulk material using tie constraints. This kind of model also requires very fine meshing in order to keep the cohesive fracture process zone small and to avoid convergence problems. This leads to increase total number of elements in the numerical model and thus the required computation time is relatively high.
The current model uses node to surface contacts with cohesive behavior in order to simulate debond/delamination initiation and growth. In order to do so, cohesive interactions are used to model different interfaces in the joint. These interfaces works as the probable crack paths where debond/delamination could take place upon loading.Different surfaces are created on the model and the interactions between these surfaces are defined using node to surface contacts. Every contact interaction is assigned an interaction property which consists of cohesive behavior and damage model as the governing phenomena. The cohesive behavior assigns the initial cohesive stiffness to the interaction. The damage model contains a stress based damage initiation criteria and a strain energy release rate based damage evolution criteria to predict initiation and growth of interface crack.
A displacement boundary condition was applied in incremental steps on the stiffener to calculate reaction load and encastre boundary condition (U1=U2=U3=UR1=UR2=UR3=0)was applied at the far ends of the skin. The model thus created was solved for a non-linear analysis and load displacement results were obtained.
2.3 Cohesive zone model
Cohesive zone model is one of the most popular numerical techniques for the detection of debond/delamination in composite structures. It is being used over the conventional techniques like virtual crack closure technique (VCCT) or XFEM as it can capture both the damage nucleation and evolution. It considers the fracture formation as a gradual event, in which the separation of the surfaces take place across the predefined crack paths or cohesive zones and is resisted by cohesive tractions.
The Mode I dominated bilinear CZM model assumes that the separation of the material interfaces is dominated by the displacement jump normal to the interface as shown in Fig.3. The area under the curve is the energy released due to debonding and is called the critical fracture energy. The relation between normal cohesive traction tnand normal displacement jump δncan be expressed as


Figure 3: Traction separation curve under normal loading
The Mode II dominated bilinear CZM model assumes that the separation of the material interfaces is dominated by the displacement jump that is tangent to the interface, as shown in Fig. 4. The relation between tangential cohesive traction ttand tangential displacement jump δtcan be expressed as:
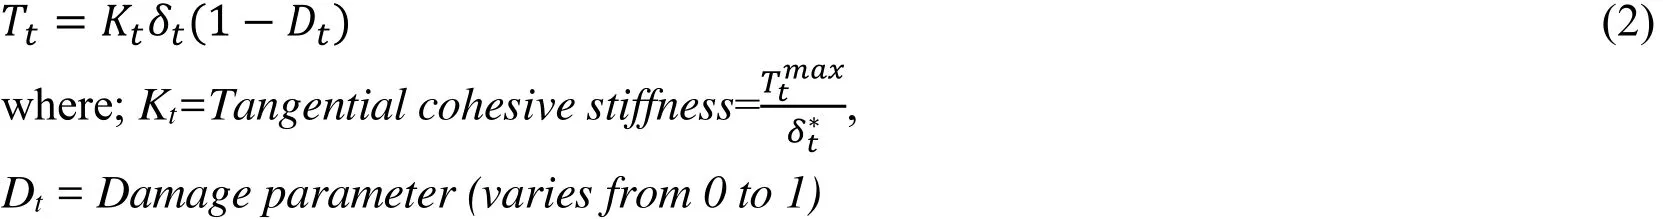

Figure 4: Traction seperation curve under shear loading
For bilinear cohesive law under the mixed-mode fracture, the separation of material interfaces depends on normal as well as tangential components of traction. To predict the damage nucleation correctly, the interaction between these two traction components has been modeled using the quadratic stress criterion. This criteria is a function of normal and shear components of traction and expressed as.

where tn, tt, and tsare tractions in normal and two shear directions respectively and tI0, tII0and tIII0are critical values of tractions in normal and two shear directions.
When the damage initiation criterion is fulfilled the cohesive stiffness degrades at a rate based on the damage evolution model. A scalar damage parameter D is introduced which increases monotonically from 0 to 1 when the loading is increased.
The Power law criteria is used to predict the damage evolution of the interfaces to accurately predict the final failure of the joint. This criterion is expressed as a function of the Mode I, Mode II and Mode III fracture toughness values and expressed as

The value of exponent α, β, and γ is assumed to be 1. The power law criteria reduced to a linear function of strain energy release rates, expressed as

The current numerical model uses node to surface interactions coupled with cohesive behavior instead of modeling thin layer of cohesive elements between the adjacent surfaces. A damage model is also programmed which consists of damage nucleation criteria and damage evolution criteria to predict the initiation and growth of crack as shown in Eqs. (3) and (5).
3 Results and discussion
Finite element analysis is carried out to obtain load displacement relationship for the T joint using node to surface contacts coupled with cohesive behavior and a damage model.The results determined from the FE analysis are shown in Fig. 5. From the load displacement curve, it is clear that the failure occurs at a displacement of 4.71 mm and the load bearing capacity is found to be 472.57 kgf for the basic configuration. The load start decreasing in the subsequent steps and at a displacement of 5.014 mm a sharp load drop is observed. For the padded configuration peak load of 672.8 kgf was calculated at a displacement of 3.9 mm. Final failure occurs at 4.63 mm with a corresponding load of 561.76 kgf and a sharp load drop is observed afterwards. The added capping strips increase the stiffness and the load bearing capacity of the joint however the failure displacement reduces as compared to the basic configuration.

Figure 5: Load displacement curve of CZM model
Previous studies show that sometimes the results of FE analysis vary when there is a change in element sizing, especially in the presence of material/geometric nonlinearities.In order to ensure that the current model is free of mesh size effects, a sensitivity study is performed on both the configurations. The element size for the skin and stiffener legs is reduced to 1.5 mm from initial value of 2.5 mm which in turn increased the total number of elements in the FE model. The mesh in the resin rich region was kept as it is and solver run was performed. The comparative load displacement curves of the coarse and fine mesh for both the joint configurations are found to be almost the same, as shown in Fig. 5.The behavior of both the configurations in terms of failure displacement and failure load remains similar. The disadvantage of the finer mesh is higher computational time.
The results of the analysis are compared with available experimental data presented by Vijayaraju et al. [Vijayaraju and Mangalgiri (2004)]. It is observed that the failure loads and displacement predicted by the numerical model are slightly higher than the experimental results; however the error is in permissible limits. Tab. 3 shows the simulation v/s experimental result summary for both the joints.

Table 3: Comparison of experimental and simulation results
It can be seen in Fig. 6(a) that stress concentration occurs (shown in red) at the interface where the stiffener is in contact with the resin rich region. Fig. 6(b) shows propagated crack at various interfaces of the joint for the padded configuration. It can be observed that through cracks are present at stiffener-resin interface, stiffener-capping strip interface and between the stiffener legs also.

Figure 6: Failure in Basic configuration
It can be seen in Fig. 7(a) that stress concentration occurs (shown by red) at the interface where the stiffener is in contact with the resin rich region. Similarly there is stress concentration between the capping strip and delta region which results in debonding at these regions as shown in Fig. 7(b). Fig. 7(c) shows propagated crack at various interfaces of the joint for the padded configuration. It is observed that through cracks are present at stiffener-resin interface, stiffener-capping strip interface and between the stiffener legs. An internal crack is also present at the capping strip-resin interface,however it can not be seen in Fig. 7(c) as it is not a through crack.

Figure 7: Failure in Padded configuration
4 Conclusions
This study based on node to surface interactions coupled with cohesive behavior and damage model predicts the failure behavior of both the basic and padded joint configurations satisfactorily. The damage initiation criteria based on critical traction values is able to predict debond nucleation at the interfaces. The damage evolution criteria based on energy release rates calculates the scalar degradation of material after initial debond and employ the decreased stiffness values to evaluate final failure. The load displacement results estimated by the numerical model are in good agrrement with the experimental data for both the joint configurations. It is also observed that the added capping strips increase the load bearing capacity and stiffness of the joint. Sensitivity analysis indicates that the mesh refinement doesnot change the analysis results in terms of prdcited failure load/displacement and confirms an acceptable level of accuracy of the FE model. The shell based 3D model coupled with node to surface interactions is able to predict the failure initiation and growth for both the joint configurations precisely. The computational time required using the proposed numerical model as compared to the conventional cohesive zone modelling technique is reduced approximately by 15-20%.
Adams, R. D.(2005): Adhesive bonding: Science, technology and applications.Elsevier.
Petrie, E. M.(2000):Handbook of adhesives and sealants. McGraw-Hill.
Fernandes, T. A.; Campilho, R. D.; Banea, M. D.; da Silva, L. F.(2015): Adhesive selection for single lap bonded joints: Experimentation and advanced techniques for strength prediction.Journal of Adhesion, vol. 91, no. 10-11, pp. 841-862.
da Silva, L. F.; Öchsner, A.; Adams, R. D.(2011):Handbook of adhesion technology.Springer Science & Business Media.
He, X.(2011): A review of finite element analysis of adhesively bonded joints.International Journal of Adhesion and Adhesives, vol. 31, no. 4, pp. 248-264.
Mubashar, A.; Ashcroft, I.; Crocombe, A.(2014): Modelling damage and failure in adhesive joints using a combined XFEM-cohesive element methodology.Journal of Adhesion, vol. 90, no. 8, pp. 682-697.
da Silva, L. F.; das Neves, P. J.; Adams, R.; Spelt, J.(2009): Analytical models of adhesively bonded joints-Part I: Literature survey.International Journal of Adhesion and Adhesives, vol. 29, no. 3, pp. 319-330.
Akpinar, S.(2014): The strength of the adhesively bonded step-lap joints for different step numbers.Composites Part B: Engineering, vol. 67, no. 67, pp. 170-178.
Clark, J.; McGregor, I.(1993): Ultimate tensile stress over a zone: A new failure criterion for adhesive joints.Journal of Adhesion, vol. 42, no. 4, pp. 227-245.
Xu, J. Q.; Liu, Y. H.; Wang, X. G.(1999): Numerical methods for the determination of multiple stress singularities and related stress intensity coefficients.Engineering Fracture Mechanics, vol. 63, no. 6, pp. 775-790.
Campilho, R.; De Moura, M.; Barreto, A.; Morais, J.; Domingues, J.(2010):Experimental and numerical evaluation of composite repairs on wood beams damaged by cross-graining.Construction and Building Materials, vol. 24, no. 4, pp. 531-537.
Alfano, G.(2006): On the influence of the shape of the interface law on the application of cohesive-zone models.Composites Science and Technology, vol. 66, no. 6, pp. 723-730.
Heidari-Rarani, M.; Shokrieh, M.; Camanho, P.(2013): Finite element modeling of mode I delamination growth in laminated DCB specimens withR-curve effects.Composites Part B: Engineering, vol. 45, no. 1, pp. 897-903.
Belytschko, T.; Black, T.(1999): Elastic crack growth in finite elements with minimal remeshing.International Journal for Numerical Methods in Engineering, vol. 45, no. 5,pp. 601-620.
Azevedo, J.; Campilho, R.; da Silva, F.; Faneco, T.; Lopes, R.(2015): Cohesive law estimation of adhesive joints in mode II condition.Theoretical and Applied Fracture Mechanics, vol. 80, pp. 143-154.
Davis, M.; Bond, D.(1999): Principles and practices of adhesive bonded structural joints and repairs.International Journal of Adhesion and Adhesives, vol. 19, no. 2-3, pp. 91-105.
Zhan, X.; Gu, C.; Wu, H.; Liu, H.; Chen, J. et al.(2016): Experimental and numerical analysis on the strength of 2060 Al-Li alloy adhesively bondedT-joints.International Journal of Adhesion and Adhesives, vol. 65, pp. 79-87.
Kaelble, D. H.(1959): Theory and analysis of peel adhesion: mechanisms and mechanics.Transactions of the Society of Rheology, vol. 3, no. 1, pp. 161-180.
Niesiolowski, F.; Aubrey, D.(1981): Stress distribution during peeling of adhesive tapes.Journal of Adhesion, vol. 13, no. 1, pp. 87-98.
Budzik, M.; Jumel, J.; Imieliâ´Nska, K.; Shanahan, M. E. R.(2011): Effect of adhesive compliance in the assessment of soft adhesives with the wedge test.Journal of Adhesion Science and Technology, vol. 25, no. 1-3, pp. 131-149.
Budzik, M. K.; Jumel, J.; Shanahan, M. E.(2014): Experimental investigation of mesoscale crack front triple line.Applied Physics A, vol. 114, no. 2, pp. 495-501.
Da Silva, L. F.; Adams, R.(2002): The strength of adhesively bondedT-joints.International Journal of Adhesion and Adhesives, vol. 22, no. 4, pp. 311-315.
Grant, L.; Adams, R.; da Silva, L. F.(2009): Experimental and numerical analysis ofT-peel joints for the automotive industry.Journal of Adhesion Science and Technology,vol. 23, no. 2, pp. 317-338.
Di Bella, G.; Borsellino, C.; Pollicino, E.; Ruisi, V.(2010): Experimental and numerical study of compositeT-joints for marine application.International Journal of Adhesion and Adhesives, vol. 30, no. 5, pp. 347-358.
Trask, R.; Hallett, S.; Helenon, F.; Wisnom, M.(2012): Influence of process induced defects on the failure of compositeT-joint specimens.Composites Part A: Applied Science and Manufacturing, vol. 43, no. 4, pp. 748-757.
Bianchi, F.; Koh, T.; Zhang, X.; Partridge, I.; Mouritz, A.(2012): Finite element modelling ofz-pinned compositeT-joints.Composites Science and Technology, vol. 73,no. 73, pp. 48-56.
Segovia, C.; Pizzi, A.(2009): Performance of Dowel-WeldedT-joints for wood furniture.Journal of Adhesion Science and Technology, vol. 23, no. 16, pp. 2073-2084.
Apalak, M. K.(2002): On the non-linear elastic stresses in an adhesively bondedT-joint with double support.Journal of Adhesion Science and Technology, vol. 16, no. 4, pp.459-491.
Vijayaraju, K.; Mangalgiri, P.; Dattaguru, B.(2004): Experimental study of failure and failure progression inT-stiffened skins.Composite Structures, vol. 64, no. 2, pp. 227-234.
Sane, A.; Peshwe, D. R.; Manjunatha, C. M.; Padole, P. M.; Uddanwadiker, R. V.(2017): Evaluation of progressive failure of compositeT-joint using mixed mode cohesive zone model.Transactions of the Indian Institute of Metals, vol. 71, no. 2, pp.445-451.
杂志排行

Computer Modeling In Engineering&Sciences的其它文章
- A New Interface Identification Technique Based on Absolute Density Gradient for Violent Flows
- Exact Solutions of the Cubic Duffing Equation by Leaf Functions under Free Vibration
- Online Group Recommendation with Local Optimization
- The Reduced Space Method for Calculating the Periodic Solution of Nonlinear Systems
- Subdivision of Uniform ωB-Spline Curves and Two Proofs of Its Ck−2-Continuity