GPU-based discrete element simulation on flow stability of flat-bottomed hopper☆
2018-05-25LiPengZhengZouLiboZhangQingshanZhuHongzhongLi
Li Peng ,Zheng Zou ,Libo Zhang ,Qingshan Zhu ,*,Hongzhong Li ,*
1 State Key Laboratory of Multiphase Complex Systems,Institute of Process Engineering,Chinese Academy of Sciences,Beijing 100190,China
2 University of Chinese Academy of Sciences,Beijing 100049,China
1.Introduction
Hoppers have been widely employed to deposit or recycle granular materials in many areas such as chemical,energy,and food industries.A main issue concerned in using hoppers is the presence of unstable flow,which has a marked influence on operational stability of units.It is therefore important to study the factors affecting hopper flow stability,and establish the standard for judging the unstable hopper flow for reliable design and operation of hoppers.
Actually,extensive studies have been performed to investigate the factors related to hopper flow stability,such as hopper pressure[1–3],hopper shapes[4,5],wall properties[6–9],and particle properties[10,11].Flow pattern has long been a hot topic in this field.By using the tracer technique,the flow pattern above the hopper outlet was first described by Kvapil[12]as four flow zones:slow motion zone,dilated core,dead zone,and free-fall zone.In 1961,Brown[13]developed the‘minimum energy theorem’to describe the boundary of the free-fall zone.Later Brown and Richards[14,15]photographed the free-fall boundary and named the boundary as the ‘free fall arch’.With increasing the pressure gradient in the hopper,the ‘free fall arch’evolves into a hemispherical cap which leads to an unstable flow.Hiroshi[16]put forward the critical point for the ‘free fall arch’between stable and unstable flow.According to his research,when the super ficial gas velocity(Ugs)through the boundary of the ‘free fall arch’was more than the minimum fluidization velocity(Umf),the hopper flow be came unstable.
However,unstable flow occurs not only at the area above the hopper outlet,so the flow pattern inside the whole hopper was further studied.It has been accepted that there are two kinds of flow pattern inside the hopper:the mass flow[17]and the funnel flow[18].The most common flow pattern is the funnel flow.Tüzün[18]identified 4 zones in a flat bottomed hopper with the funnel flow:the stagnant zone,the converging flow zone,the transition flow zone and the plug flow zone.To exactly predict the flow zones,the discrete element method(DEM)[19–26]was adopted.In our previous work[27],the hopper flow was described as nine regions via the GPU-based DEM simulation,as shown in Fig.1.However,when the hopper flow trans forms into an unstable flow,it is not clear yet how the flow region change and the key transformation zone inside the hopper respond to the unstable state.Identification of the key transformation zone is helpful to establish a standard for judging the unstable flow,as well as for reliable design and operation of hoppers.
The aim of this work was to identify the key transformation zone based on the hopper flow regions.The hopper flow was studied via both GPU-based DEM simulation[28]and experiments.The key transformation zone was revealed,and the standard for judging the unstable hopper flow was established.
2.DEM Simulation
The details about the DEM method[29–31]were given in our previous work[27];the Newton's second law was used to describe the motion of an individual particle as follows:

Fig.1.Hopper flow regions.

where miis the mass of the particle,g is the gravitational acceleration.viand ωiare the translational and angular velocity.Iiis the moment of inertial of the particle.R is the vector of the mass center of the particle to the contact point.μris the rolling friction coefficient.Rpis the particle radius.andare the normal and tangential contact forces.
The simulation method is evaluated on the Mole-8.7 and Mole-8.5 GPU clusters at IPE,having 1 PetaELOPS peak performance in single precision[32]and using C2050(Fermi,with 448 thread processors)cards.The program runs at about 1.64×10⁷pss.
The parameters used in the DEM simulation as well as the properties of particles are listed in Table 1.The details were also given in our previous work[27].
The voidage can be calculated by the correlations proposed by Liand Kwauk[33].The simulated voidage is compared with the results of correlations to validate the DEM model.The simulation process was the same in our early work[27].
The results are illustrated in Fig.2.The Li's correlation is good at calculating the voidage.The simulated results agree well with Li's correlation.The flow regimes are studied based on both the particle velocity and voidage.The voidage agree well with the Li's correlation,and the flow rate reflecting particle velocity agree well with experimental ones in our early work[27],so the DEM model can be used to studied hopper flow regime.

Table 1 Simulation parameters for the DEM model

Fig.2.Voidage of the simulation and Li's correlation.
3.Simulation and Experiments
The flow rate was first simulated to study the hopper flow.The hopper structure is shown in Fig.3,the outlet size D0=13.3 mm.The simulation process is as follows:the hopper outlet was first closed.The hopper was packed with zirconia spheres to the height of 600 mm with the closed outlet.Then the hopper outlet was opened,the material height reduced with discharging.The discharge rate can be calculated at the bottom of the hopper.The simulated results are shown in Fig.4(a).
The experiments were conducted to validate the simulation results.The structures of the experimental hopper and the simulated hopper are the same.The materials used in experiments were zirconia spheres,as shown in Fig.5.The zirconia spheres have a narrow particle size distribution and the averaged particle size is 0.73 mm.The experimental system is shown in Fig.6.The experimental process is the same with the simulation.The discharge rates can be measured by a container and a scale under the hopper.The mass of the container is changed every second to obtain the discharge rates of the hopper.The experimental results are shown in Fig.4(b).
From the Fig.4,it can be seen that the simulation results showed good agreement with the experiments.As shown in Fig.4(a),with the material height(H)reducing,the discharge rate was nearly constant from H=600 mm to H=173 mm,the hopper discharge was stable.This is the same with the Janssen theory[1],which believes that the discharge rate is material height independent when the material height is higher than a critical value.

Fig.3.Schematic diagram of the hopper.

Fig.4.Discharge rate of the simulation and experiment.
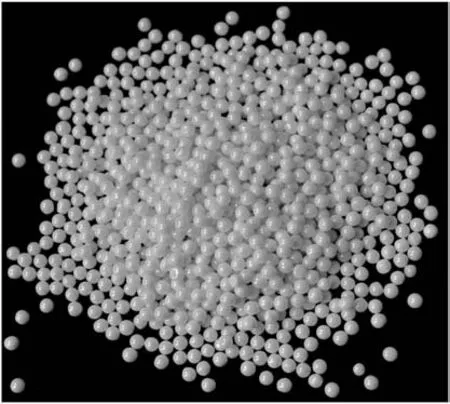
Fig.5.Zirconia spheres used in experiments.

Fig.6.Schematic diagram of the experimental system.
The discharge rate increased from H=173 mm in Fig.4(a),and decreased from H=124 mm.The experimental flow rate of the hopper with the material height of 130 mm was also higher than that of the other experimental results.It can be seen that when the material height in the hopper was less than 173 mm,the hopper discharge rate was not constant and started to fluctuate,which means the hopper discharge became unstable.
4.Results and Discussion
4.1.Flow regions

Fig.7.Velocity distribution of the hopper with H h=362 mm:(a)UM:magnitude velocity;(b)UZ:Z-direction velocity;(c)UX:X-direction velocity;(d)UY:Y-direction velocity.
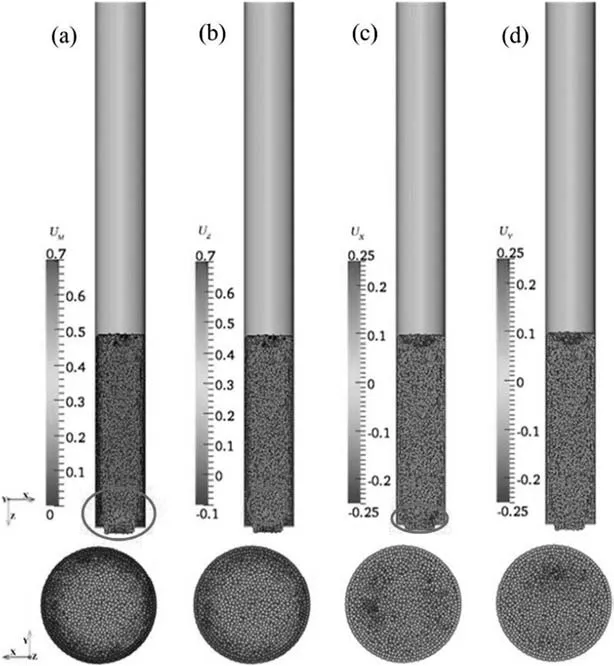
Fig.8.Velocity distribution of the hopper with H l=150 mm:(a)UM:magnitude velocity;(b)UZ:Z-direction velocity;(c)UX:X-direction velocity;(d)UY:Y-direction velocity.
To reveal the changes of the particle distribution,the flow regions of the hopper flow with the unstable discharge was com pared with that of the stable discharge.According to our research[27],the characteristics of the regions as follows:the loose packing region is the top area of the particles and has high axial voidage,which decreases with the height decrease along the hopper.The plug flow region has constant axial voidage.The transition flow region has nearly constant radial voidage.The shear layer has higher voidage than the hopper center area.For the converging flow region,the axial voidage increases with the height along the hopper decreasing,resulting the particles velocities increase with the height along the hopper decreasing.The vertical flow region,the centripetal flow region and the stagnant zone can be identified by the velocity distribution of particles.
Based on the simulation,the discharge rate becomes unstable when the material height is less than 173 mm.So the hopper with H<173 mm can be chosen to analyze the flow regions of the unstable discharge,while the hopper with H>173 mm can be chosen to analyze the flow regions of the stable discharge.The flow regions of the hopper with the material height of 150 mm(Hl=150 mm)was compared with that of 362 mm(Hh=362 mm).The flow regions are analyzed based on the distributions of the velocity,axial voidage,and radial voidage.
4.1.1.Velocity distribution
The velocity distribution of the hopper with Hh=362 mm and Hl=150 mm are shown in Figs.7 and 8,respectively.The snapshots are cross-sections of 5 mm above the hopper outlet.For the hopper with Hh=362 mm,there are triangle zones as shown in Fig.7(a),where particles have the highest velocity due to the free-fall region.Just above the hopper outlet,particles have lower velocities than the free-fall region in the arch zone as shown in Fig.7(a),which can be divided into the vertical flow region and the centripetal flow region,as shown in Fig.7(b)and(c).As shown in Fig.8,for the hopper with Hl=150 mm,there are also free-fall region,centripetal region,and vertical flow region.
4.1.2.Axial voidage
The axial voidage of the hopper with Hh=362 mm and Hl=150 mm are shown in Fig.9.For the hopper with Hh=362 mm,at area C,the axial voidage is nearly constant due to the plug flow region,while for the hopper with Hl=150 mm,there is no constant axial voidage region,indicating that the plug flow region does not exist.

Fig.9.Axial voidage of the hopper with H h=362 mm and H l=150 mm.

Fig.10.Comparison of axial voidage of different radial positions for the hopper with H h=362 mm and H l=150 mm.

Fig.11.Axial voidage of different radial positions of the hopper with H h=362 mm and H l=150 mm.

Fig.12.Radial voidage distribution of the hopper with the material height of 362 mm and 150 mm.
The axial distributions of voidage for different radial positions of the hopper with Hh=362 mm and Hl=150 mm are shown in Figs.10 and 11,respectively.As shown in Fig.10(d),for both hoppers,under the height of 80 mm,the voidage near the wall are a is the smallest because of the stagnant zone.In Fig.11 for 110 mm<h<362 mm,the axial voidage of r=11.2 mm is the highest compared to the other radii for the hopper with Hh=362 mm due to the shear layer,while for the hopper with Hl=150 mm,the axial voidage of r=11.2 mm is not the highest indicating that there is no shear layer.
By comparison of the axial voidage distributions of different radial positions of the hopper,the hoppers with Hh=362 mm and Hl=150 mm both have loose packing region,converging flow region,and stagnant zone.However,the hopper with Hl=150 mm has no plug flow region and shear layer.
4.1.3.Radial voidage
The radial voidages of the hopper with Hh=362 mm and Hl=150 mm are shown in Fig.12.For the hopper with Hh=362 mm,the radial voidage of h=110 mm is different with the up and below area because of the transition flow region.While for the hopper with Hl=150 mm,the radial voidage all has the same trend,which indicates there is no transition flow region.
By comparison of the radial voidage,the hopper with Hh=362 mm has transition flow region,but the hopper with Hl=150 mm has no transition flow region.
4.1.4.Flow regions
In summary,the flow regions for the hopper with unstable discharge(Hl=150 mm)are different from the hopper with stable discharge(Hh=362 mm).The hopper with the stable discharge has all the regions shown in Fig.1,but the hopper with the unstable discharge only has part of the regions,as illustrated in Fig.13.The hopper with unstable discharge has no plug flow region,transition flow region and shear layer.

Fig.13.Flowregions for hopper with unstable discharge.
4.2.Definition of the key transformation zone
According to the analyses of the axial voidage in Fig.10,for h>110 mm,the voidage difference between stable discharge(Hh=362 mm)and unstable discharge(Hl=150 mm)is larger.And at h=110 mm,the largest difference shows around r=8.0 mm.According to the flow regions[27],particles around h=110 mm show characteristics of the transition flow region,so the biggest voidage difference shows around r=8.0 mm at the transition flow region,as the area A shown in Fig.14.The area A is defined as the key transformation zone.

Fig.14.The key transformation zone.
4.3.Standard for judging the unstable hopper flow
4.3.1.Voidage of the key transformation zone
To identify the relevance of the key transformation zone and the hopper flow stability,the voidage variation of the key transformation zone with the hopper material height decreasing was further studied.The result is shown in Fig.15.The voidage was nearly constant from H=600 mm to H=186 mm,however,the voidage clearly increased when the material height reduced to 186 mm.To further analyze the particle distribution in the hopper with the material height of 186 mm,the radial voidage of hopper with the material height of 186 mm(Hoper=186 mm)were compared with the hopper with Hh=362 mm and Hl=150 mm.
4.3.2.Radial voidage

Fig.15.Voidage of the key transformation zone with the material height reducing.

Fig.16.Radial voidage of the hopper with H h=362 mm,H oper=186 mm and H l=150 mm.
The radial voidages of the hopper with Hoper=186 mm,Hh=362 mm,and Hl=150 mm are shown in Fig.16.For h>110 mm,the voidage of the whole cross-section with Hoper=186 mm is larger than that with Hh=362 mm,but smaller than that with Hl=150 mm.For h<110 mm,the voidage of Hoper=186 mm is nearly the same with that of Hh=362 mm.At h=110 mm,the voidage at the wall area of Hoper=186 mm is different from that of Hh=362 mm.The voidage of r/R=8.0 with Hoper=186 mm is larger than that with Hh=362 mm,while the voidage of r/R=11.2 with Hoper=186 mm is smaller than that with Hh=362 mm.However at h=110 mm,the voidage at the hopper center area of Hoper=186 mm is nearly the same with that of Hh=362 mm.
By comparison of the radial voidage,for the area up the transition flow region,the radial voidage of the hopper with Hoper=186 mm is different from that with the stable situation.For the area under the transition flow region,the axial voidage is still the same with the stable situation.While for the transition flow region,the particle distribution near the wall area changes,particles show the characteristic of the converging flow region.For the converging flow region,the axial voidage increases with the material height along the hopper decreasing[27].Based on the moving bed theory[33],the correlation of the stress acting on the particles and the voidage is as follows:

So the stress acting on the particles decreases with the material height along the hopper decreasing,indicating the forces acting on the particles is not constant,resulting in the particles velocities are also not constant.Then the particles have been accelerated in the region.This can be understood by the stress analysis.The stress distribution of the hopper with Hh=362 mm and Hoper=186 mm are shown in Fig.17.For the hopper with Hh=362 mm,the stress around the h=110 mm is nearly constant,while for the hopper with Hoper=186 mm,the stress decreases form 1662 Pa to 1585 Pa.So particles around the h=110 mm have accelerations when the material height in the hopper reduces to 186 mm.
It is reasonable to derive that the reduction of the material height inside the hopper would result in the variation of the particle distribution.At the key transformation zone,particle distribution changes and shows the characteristic of the converging flow region.This was believed to be an unstable state for the operation of the hopper because particles started to accelerate.Therefore,a sharp increase of the voidage at the key transformation zone is considered as the standard for judging the unstable hopper flow.
In this work,the voidage increased when the material height was 186 mm,it is close to the total height of the area A and B are 180 mm in Fig.9(a).It can be assumed that the area Cwhich has constant particle voidage disappeared with the material height reducing.However,the top area A and the bottom area B were left.The voidage of the top area A is variable because of the loose packing region.While the voidage of the bottom area B is variable because of the converging flow region,so the particle distribution in the area A and B are both variables.To sum it up,the hopper flow is unstable when the hopper only has the top area and the bottom area,which is defined as the ‘Top–Bottom effect’of the hopper.

Fig.17.Stress distribution of the hopper with H h=362 mm and H oper=186 mm(Pa).
5.Conclusions
In this study,the hopper flow stability is investigated via GPU-based DEM(discrete element method)simulation.The main findings are as follows:
(1)The flow regions of unstable discharge were compared with that of stable discharge.Compared with the hopper with stable discharge,the hopper with unstable discharge has no plug flow region,transition flow region,and shear layer.
(2)A key transformation zone was found in the hopper.The voidage in the key transformation zone showed the largest difference between unstable and stable discharge.
(3)The voidage in the key transition zone clearly increased when the material height in the hopper reduced to 186 mm.By discussing the voidage variation and the stress distribution in the hopper,the particles accelerations in the key transition zone were determined.Therefore a sharp increase of the voidage in the key transformation zone is considered to be the standard for judging the unstable hopper flow.
(4)The voidage of the top area inside the hopper is variable because of the loose packing region,while the voidage of the bottom area is variable because of the converging flow region.The hopper flow is unstable when the hopper only has the top area and the bottom area,which is defined as the ‘Top–Bottom effect’of the hopper.
Nomenclature
dpparticle diameter,m
e restitution coefficient
normal contact forces,N
tangential contact forces,N
g gravitational acceleration,m·s−2
Iimoment of inertia of particle,kg·m−2
knnormal spring stiffness,N·m−1
kttangential spring stiffness,N·m−1
mimass of particle,kg
R vector of the mass center of the particle to contact point,m
Rpparticle radius,m
t time,s
vitranslational velocity,m·s−1
Y Young modulus,Pa
ɛccompressed voidage
μrrolling friction coefficient
μsFriction coefficient
average stress,N·m−2
compressed average stress,N·m−2
υ Poisson ratio
ωiangular velocity,m·s−1
[1]H.A.Janssen,Versuche über getreidedruck in silozellen,Z.Ver.Dtsch.Ing.39(35)(1895)1045.
[2]S.Jing,H.Z.Li,Study on the flow of fine powders from hoppers connected to a moving-bed standpipe with negative pressure gradient,Powder Technol.101(3)(1999)266–278.
[3]A.W.Roberts,Review of mass flow hopper design with respect to stress fields and surcharge loads,Particuology 8(6)(2010)591–594.
[4]B.S.Jin,H.Tao,W.Q.Zhou,Flow behavior of non-spherical granules in rectangular hopper,Chin.J.Chem.Eng.18(6)(2010)931–939.
[5]S.Albaraki,S.J.Antony,Howdoes internal angle of hoppers affect granular flow:experimental studies using digital particle image velocimetry,Powder Technol.268(2014)235–260.
[6]K.Grudzien,Z.Chaniecki,A.Romanowski,M.Niedostatkiewicz,D.Sankowski,ETC image analysis method for shear zone measurements during silo discharging process,Chin.J.Chem.Eng.20(2)(2012)337–345.
[7]A.W.Roberts,S.J.Wiche,Prediction of lining wear life of bins and chutes in bulk solids handling operations,Tribol.Int.26(5)(1992)345–351.
[8]M.S.A.Bradley,A.N.Pittman,M.Bingley,R.J.Farnish,J.Pickering,Effect of wall material hardness on choice of wall materials for design of hoppers and silos for the discharge of hard bulk solids,Tribol.Int.33(12)(2000)845–853.
[9]P.K.Xu,X.Z.Duan,G.Qian,X.G.Zhou,Dependence of wall stress ratio on wall friction coefficient during the discharging of a 3D rectangular hopper,Powder Technol.284(2015)326–335.
[10]H.Tao,W.Q.Zhong,B.S.Jin,Comparison of construction method for DEM simulation of ellipsoidal particles,Chin.J.Chem.Eng.21(7)(2013)800–807.
[11]D.Höhner,S.Wirtz,V.Scherer,A study of the influence of particle shape on the mechanical interactions of granular media in a hopper using the discrete element method,Powder Technol.278(2015)286–305.
[12]R.Kvapil,Theorie der Schuttgutbewegung,V.E.B,Verlag Technik,Berlin,1959.
[13]R.L.Brown,Minimum energy theorem for flow of dry granules through apertures,Nature 191(4787)(1961)458–461.
[14]R.L.Brown,J.C.Richards,Kinematics of the flow of dry powders and bulk solids,Rheol.Acta 4(3)(1965)153–165.
[15]R.L.Brown,J.C.Richards,Principles of powder mechanics;essays on the packing and flow of powders and bulk solids,International Series of Monographs in Chemical Engineering,First ed.Pergamon Press,Oxford,NewYork,1970.
[16]H.Nagashima,T.Ishikura,M.Ide,Flow characteristics of a small moving bed down comer with an orifice under negative pressure gradient,Powder Technol.192(1)(2009)110–115.
[17]G.R.Watson,J.M.Rotter,A finite element kinematic analysis of planar granular solids flow,Chem.Eng.Sci.51(16)(1996)3967–3978.
[18]U.Tüzün,R.M.Nedderman,Kinematic model for the flow of granular-materials,Powder Technol.22(2)(1979)243–253.
[19]P.A.Langston,U.Tüzün,D.M.Heyes,Continuous potential discrete particle simulations of stress and velocity fields in hoppers:transition from fluid to granular flow,Chem.Eng.Sci.49(8)(1994)1259–1275.
[20]P.A.Langston,U.Tüzün,D.M.Heyes,Discrete element simulation of granular flow in 2D and 3D hoppers:dependence of discharge rate and wall stress on particle interactions,Chem.Eng.Sci.50(6)(1995)967–987.
[21]P.A.Langston,U.Tüzün,D.M.Heyes,Discrete element simulation of internal stress and flowfields in funnel flow hoppers,Powder Technol.85(2)(1995)153–169.
[22]P.A.Langston,M.S.Nikitidis,U.Tüzün,D.M.Heyes,Microstructural simulation and imaging of granular flows in two-and three-dimensional hoppers,Powder Technol.94(1)(1997)59–72.
[23]S.Mass on,J.Martinez,Effect of particle mechanical properties on silo flow and stresses from distinct element simulations,Powder Technol.109(1–3)(2000)164–178.
[24]H.P.Zhu,A.B.Yu,The effects of wall and rolling resistance on the couple stress of granular materials in vertical flow,Physica A 325(3–4)(2003)347–360.
[25]H.P.Zhu,A.B.Yu,Micro-mechanic modeling and analysis of unsteady-state granular flowin a cylindrical hopper,J.Eng.Math.52(2005)307–320.
[26]H.P.Zhu,A.B.Yu,Steady-state granular flow in a 3D cylindrical hopper with flat bottom:macroscopic analysis,Granul.Matter 7(2)(2005)97–107.
[27]L.Peng,J.Xu,Q.S.Zhu,H.Z.Li,W.Ge,F.G.Chen,X.X.Ren,GPU-based discrete element simulation on flow regions of flat bottomed cylindrical hopper,Powder Technol.304(2016)218–228.
[28]J.Xu,H.B.Qi,X.J.Fang,L.Q.Lu,W.Ge,X.W.Wang,M.Xu,F.G.Chen,X.F.He,J.H.Li,Quasi-real-time simulation of rotation drum using discrete element method with parallel GPU computing,Particuology 9(4)(2011)446–450.
[29]H.Hertz,Über die Berührung fester elastischer Körper,J.Reine Angew.Math.92(1881)156–171.
[30]R.D.Mindlin,H.Deresiewica,Elastic spheres in contact under varying oblique forces,J.Appl.Mech.20(1953)327–344.
[31]Y.C.Zhou,B.H.Xu,A.B.Yu,P.Zulli,An experimental and numerical study of the angle of repose of coarse spheres,Powder Technol.125(1)(2002)45–54.
[32]F.G.Chen,W.Ge,L.Guo,X.F.He,B.Li,J.H.Li,X.P.Li,X.W.Wang,X.L.Yuan,Multi-scale HPC system for multi-scale discrete simulation-development and application of a supercomputer with 1 Peta flops peak performance in single precision,Particuology 7(4)(2009)332–335.
[33]H.Li,M.Kwauk,Vertical pneumatic moving-bed transport I.Analysis of flow dynamics,Chem.Eng.Sci.44(2)(1989)249–259.
杂志排行

Chinese Journal of Chemical Engineering的其它文章
- Membrane materials in the pervaporation separation of aromatic/aliphatic hydrocarbon mixtures—A review☆
- Cultivation of microalgae for biodiesel production:A reviewon upstream and downstream processing☆
- Numerical study and acceleration of LBM-RANS simulation of turbulent flow☆
- Tuning sol size to optimize organosilica membranes for gas separation☆
- Oil–water pre-separation with a novel axial hydrocyclone☆
- Study on extraction kinetics of α-cyclopentylmandelic acid enantiomers with hydroxyethyl-β-cyclodextrin as chiral selector☆