Modeling and Simulation of Human Cornea for the Measurement of Intraocular Pressure (IOP) through Eyelid
2018-03-10MaheshMawaleAbhaykumarKuthePadmaPawaneandSandeepDahake
Mahesh B. Mawale, Abhaykumar Kuthe, Padma G. Pawane and Sandeep W. Dahake
1 Introduction
The glaucoma has remained the challenging entity in the field of ‘eye problems’ even today,in spite of all sorts of advances in diagnostics as well as therapeutic modalities have come up. In the developing countries like India, the management of health problems in masses is still attracting issue. Due to this and due to, dearth of expertise in this field, as well as compromising economic conditions in India, the simple, economical devices to meet the demands gained their own importance. In view of this, the attempt of this study enlightened me to proceed. A new technique is proposed to measure intraocular pressure (IOP) through the eyelid. The main advantage offered by this method is the increase in patient’s comfort and prevention of corneal infection [Chiu (2005); Piletskii (1998); Nakai, Nagaoka,Yoshizawa et al. (2004)]. In this paper conceptual model of a device for the measurement of IOP through the eyelid is proposed. The modeling and simulation results are presented and discussed subsequently.
The anterior segment of the eye is filled with a clear fluid called aqueous humor (AH). It is produced in the posterior chamber in the ciliary body at the rate of 2-3 ul/min. Glaucoma occurs due to the resistance to the aqueous humor out flow, which in turn leads to an increase of IOP [Villamarin, Roy, Hasballa et al. (2012); Ju, Wang, Xie et al. (2005); Pinar-Sueiro, Rodriguez-Puertas and Vecino (2011)]. IOP levels cannot be used to describe glaucomatous pathology fully, but at the same time, its relevance in managing patients with glaucoma should not be underestimated. Out of the various risk factors, known such as age,race, family history, central corneal thickness, ocular perfusion, diabetes and genetics etc.,IOP is the only modifiable risk factor [Davey, Nouri and Zaczyk (2013)]. Glaucoma is a progressive disease and can lead to optic nerve neuropathy which damages optic nerve if untreated for a long time [Hitchings (2009)]. Progressive retinal ganglion cell death and visual field loss are associated with it hence it is considered as second leading cause of blindness in the whole world [Ferreira, de Oliveira, da silva et al. (2013); Terminology and Guidelines for Glaucoma, European Glaucoma Society, 4th edition (2016)]. Tonometry is IOP measurement that is most commonly performed on the cornea. It is mainly used to determine the IOP of the eye and diagnose the diseases such as glaucoma [Terminology and Guidelines for Glaucoma, European Glaucoma Society, 4th edition (2016); Polyvas, Peyman and Enikov (2013)].
According to the survey conducted by World Health Organization, the number of glaucomatous patients will increase to 80 million people worldwide by 2020 [Auvray,Rousseau, Lissorgues et al. (2012)]. Meena et al. [Chakrabarti, John and Chakrabarti(2009)] described the evolution of tonometry and the different tonometry principles used in various tonometers since last two centuries [Singh (2014); Yves and Robert (2007)].Goldmann applanation tonometry (GAT) represents today the reference standard for assessing IOP [Lomoriello, Lombordo, Tranchina et al. (2011)]. Although it is treated as a reference standard there are some inaccuracies in IOP interpretation [Davey, Nouri and Zaczyk (2013); Lomoriello, Lombordo, Tranchina et al. (2011)]. Recent studies showed that IOP varies throughout the day. Steps involved in measurement of IOP by GAT require a skilled technician or expertise of Ophthalmologist [Karani, Tan, Xiong et al. (2014)].Steve et al. [Liang, Lee and Shields (2009)] explored the need of monitoring IOP and selftonometry in management of glaucoma. Furthermore, the pressure phosphene tonometer,Ocuton s tonometer and tonopen used in self-assessment of IOP were explained. Presently another method is developed for measurement of IOP by the effect of piezoelectric bimorphs [Tong, Yue and Xia (2012)]. Patrick et al. [Dubois, Zemmouri, Rouland et al.(2007)] invented a new device to measure IOP in which vibrometry by laser interferometry and spectral analysis of mechanical impulse using temporal micro hammer, was used. Peter et al. [Polyvas, Peyman and Enikov (2013)] presented a novel trans-scleral tonometer based on digital palpation tonometry. Dikin et al. [Dikin, Ivanyschev, Kornev et al. (2013)]developed a dynamic tonometer for measuring IOP. It was based on the monitoring of the oscillation period of the dynamic system of tonometer elements and the eye.
2 Methods and materials
While modeling the human eye, the structure of the eye is considered to be almost spherical.The sclera and the cornea are treated as the main parts of the eye [Bocskai (2009)]. For constructing the model of human eye, varying thickness of sclera was introduced by referring non uniform geometry of the human eye [Woo, Kobayashi and Lawrence (1972);Liu and Roberts (2005)]. To build the model of human eye Solid works v15 was used (Fig.1 and Fig. 2).
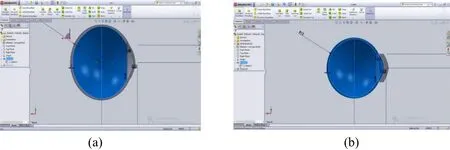
Figure 1: 2D model of eye created in Solid work v15 (a) without eyelid, (b) with Eyelid

Figure 2: Solid model of human eye (a) Model representing normal cornea (b) Model representing the applanated cornea
After modeling the human eye in Solid works v15 the models were converted into Standard Tesselation Language (STL) format. The STL file of human eye was imported in to the Catalyst Ex, pre-processing software to link with RP machine. This STL file was then sent to RP machine (uPrint SE, Stratasys Inc., Ontario, CA, USA) to get the acrylonitrile butadiene styrene (ABS) model of the human eye using fused deposition modeling (FDM)method. The prototypes of the complete eyeball with sclera and cornea were developed and section of eyeball too. Another prototype was developed for human eye with eyelid and applanated stage of cornea shown in Fig. 3. As per the expert Ophthalmologist, geometry and sizes were finalized. Finally using Finite Element Analysis mechanical behavior of cornea had been checked.

Figure 3: Prototypes of sclera and cornea
2.1 Indentation depth
Eye patients were examined for the screening of glaucoma using Schiotz tomometry in rural and remote settings [Kok, Berendschot and Hardus (1998)]. In schiotz’s tonometry measurement of IOP is made by finding out the indentation depth and the weight applied on the foot plate. Indentation and applanation principles are used in the present study to find out IOP. The measurement of the indentation depth for applanation of cornea was the primary interest. The indentation depth was calculated for the cornea with and without eyelid. Robert [Moses (1971)] had represented the empirical calibration of schiotz’s tonometer, the maximum plunger weight being taken as 15 gm.
So the total force exerted on the corneal surface, FC=0.15+0.11=0.26 N
The Normal range for IOP is 16~21 mm of Hg. So, 21 mmHg was taken as the known IOP value for calculation.

Where, Fc force exerted on corneal surface, Pt is the known IOP value and rThalf of the
cord.
So, rT=5.44 mm
Similarly,

Where, rIis radius of the plunger indentation and FPapplanation force
The relation between Radius and Arc Length is given by,
A= r×θ
Where A is the Arc length, r is the Radius and θ is the sector angle.
By using solid works v15, the sector angles for the radius rTand rIwere found out.
ΘT=44.22 degrees or 0.7717 radian
ΘI=31.97 degrees or 0.5579 radian

Figure 4: Measurement of h1(a) without eyelid (b) with eyelid
Arc radius, AT=6.082 mm
Arc length, AI=4.396 mm
Slant height of the cone frustum formed by the plunger indentation,
S=C-p-AT+AI
Where, S is surface tension, p radius of plunger base, ATarc length corresponding to arc
FT,AIarc length corresponding to arc FI.
In this case corneal arc, C=AT
So, S=−p+AI
Slant Height, S=-1.53+4.396=2.866 mm
l2=rI-p
l2=4.129-1.53=2.599 mm
And,

Where, l1and l2are sides of right angle triangle Sl1l2shown in Fig. 4 (a).
In this case, ℎ2=0 and ℎ1is found from the Fig. 4 (a)
And, ℎ1=1.18 mm
Where, h1 is the height of foot plate arc, h2height of concavity.
So, the Indentation Depth, IC=ℎ1+ l1=1.18+1.207=2.387 mm
If IOP is to measure over the eyelid, Indentation depth can be similarly found out using
Fig. 4 (b). Considering the average thickness of the eyelid as approximately 2 mm,
ℎ1=0.91 mm (From Fig. 4 (b))

So, the Indentation Depth, IE=ℎ1+l1=0.91+0.839=1.749 mm
The total indentation depth over the eye lid is IC+IE=4.136 mm
2.2 Development of device
A conceptual model of the device to measure the IOP through eyelid is shown in Fig. 5.For construction of the model Solid work v15 was used. Fig. 5 shows a sectional view of the device which comprises an outer casing, the plunger attached with a rod and a compression spring. The plunger is modeled with a flat circular cross section of a constant diameter of 3.06 mm [Terminology and Guidelines for Glaucoma, European Glaucoma Society, 4thedition (2016)]. A mass spring model of the cornea was developed to investigate the factors influencing corneal shape. Change in cornea shape was computed respectively with finite element model, mass spring model and finally IOP and external pressure were simulated [Xie, Wang, Ju et al. (2008)]. Venketesh et al. [Sathyanarayanan, Mahadas and Hung (2013)] developed a homeomorphic model of the human eye wherein mass-springdamper (MSD) model was used to investigate forces and displacement throughout. In the proposed model of our device, the applanation pressure required to flatten the cornea, can be calculated by using the stiffness and the displacement of the compression spring used.The indentation depth can be recorded by the displacement of the plunger. The spring used has wire diameter 0.25 mm, no. of coils 15, pitch 1 mm and stiffness of the spring 0.05178 N/mm [Shigely and Mischke (2006)].
2.3 Finite element analysis

Figure 5: CAD model of the proposed device
A linear Finite Element (FE) analysis was carried out using ANSYS 15.0 workbench. The values of IOP for cornea with and without eyelid have evaluated. The normal range of IOP is 16-21 mm of Hg, above 21 mm of Hg is treated as elevated IOP. Therefore, for analysis the range of IOP was selected 5-40 mm of Hg [Nakai, Nagaoka, Yoshizawa et al. (2004);Tong, Yue and Xia (2012)]. For assessing mechanical behavior of cornea finite element method (FEM) had been used [Nejad, Foster and Gongal (2014)]. The eyeball, which is bounded by thin shell, is considered almost spherical in shape [Bauer, Lyubimov and Tovstik (2005)]. It consists of two parts, sclera and cornea with different mechanical properties [Esposito, Clemente, Bonora et al. (2015); Xing and Wei (2014)].
A finite deformation, hyper elastic, orthotropic material model based on CAD models,having 3357 nodes and 1735 elements were developed. The eye models were imported in ANSYS as igs format file to reduce data loss. Suitable constraint was applied on the eye model by fixing the sclera. The varying thickness of outer shell of the eye was incorporated and the aqueous, vitreous and fatty tissues were modeled similar to soft human tissue[Power, Stitzel, West et al. (2014)].
The material properties, Young’s modulus 0.19 Mpa and 98.97 Mpa were used for cornea and eyelid. The mean eyelid pressure on cornea was considered 4.1 mm of Hg and average eyelid thickness was introduced 2 mm [Schutte, van den Bedem, van Keulen et al. (2006);Ljubimova (2009)]. Poisson’s ratio used for cornea was 0.420, sclera 0.470 and eyelid 0.4945 [Schutte, van den Bedem, van Keulen et al. (2006); Ljubimova (2009)]. Corneal hysteresis for normal eye of 10.24 and the scleral rigidity ranged from 0.0017-0.0022 was selected [Pierscionek, Asejczyk-widika and Schachar (2007); Deol, Taylor and Radeliffe(2015)]. The different pressures are applied normal to the surface of cornea and eyelid (Fig.6). Tab. 1 represents the IOP in mm of Hg, Pascal and pressure required to applanate the cornea through eyelid. Tab. 2 represents the indentation depth for different IOPs. The material properties of aluminum alloy and stainless steel were collected from software library.
Pressure exerted on cornea by the eyelid=4.1 mm of Hg or 546.621 Pa
Area of contact, A=7.35 mm2
Equivalent pressure needed to flatten the cornea over eyelid=IOP(Pa)-Eyelid pressure(Pa).
So, Force needed to flatten the Cornea over eyelid=Applied Pressure/Area of Contact.

Table 1: Pressure in mmHg and its equivalent in Pascal, also Equivalent pressure required to flatten the cornea through eyelid [Liu and Roberts (2005)]

6 10 1333.223 786.602 7 11 1466.545 919.924 8 12 1599.868 1053.247 9 13 1733.190 1186.569 10 14 1866.513 1319.892 11 15 1999.835 1453.214 12 16 2133.157 1586.536 13 17 2266.480 1719.859 14 18 2399.802 1853.181 15 19 2533.124 1986.503 16 20 2666.447 2119.826 17 21 2799.769 2253.148 18 22 2933.091 2386.470 19 23 3066.414 2519.793 20 24 3199.736 2653.115 21 25 3333.059 2786.438 22 26 3466.381 2919.760 23 27 3599.703 3053.082 24 28 3733.026 3186.405 25 29 3866.348 3319.727 26 30 3999.670 3453.049 27 31 4132.993 3586.372 28 32 4266.315 3719.694 29 33 4399.637 3853.016 30 34 4532.960 3986.339 31 35 4666.282 4119.661 32 36 4799.604 4252.983 33 37 4932.927 4386.306 34 38 5066.249 4519.628 35 39 5199.572 4652.951 36 40 5332.894 4786.273

Table 2: IOP and equivalent indentation depth with and without eyelid [Moses (1971)]

33 37 1.07 1.90 34 38 0.99 1.78 35 39 0.92 1.64 36 40 0.86 1.52

Figure 6: Assigning constrain for analysis (a) cornea (b) eyelid
3 Results
Simulation results were obtained for known values of IOP in terms of shear stresses for contact interface between tip of the plunger and human eye. Here the results were obtained for case (1) cornea without eyelid (2) cornea with eyelid. From previous studies it has been found that the normal range of IOP is between 16-21 mm of Hg. For discussing simulation results elevated range of IOP 27 mm of Hg was considered.
3.1 Without eyelid
In this case the simulation results were obtained by applying a force on cornea. The model of human eye and the device constructed were used for analysis purpose. The value of IOP 27 mm of Hg was taken for sample calculation. First the simulation result was obtained for indentation depth of 2.39 mm and for indentation depth of 1.82 mm i.e. corresponding to 27 mm of Hg. The shear force on the contact surface was found out to be 3599.73 Pa. and 3483.3 Pa. respectively. Similarly, shear stress value was calculated for the range of IOP 5-40 mm of Hg with constant indentation depth and variable depth for IOP. The results are shown in Tab. 3.

Table 3: IOP and corresponding shear stress value got from simulation (variable and const.depth)

3 07 3.38 902.46 2.39 930.20 4 08 3.30 1031.39 2.39 1061.95 5 09 3.23 1160.31 2.39 1203.69 6 10 3.15 1289.34 2.39 1332.44 7 11 3.08 1418.16 2.39 1471.18 8 12 3.00 1547.08 2.39 1596.92 9 13 2.93 1676.01 2.39 1730.67 10 14 2.85 1804.93 2.39 1863.41 11 15 2.78 1933.86 2.39 2006.16 12 16 2.70 2062.78 2.39 2130.90 13 17 2.60 2191.70 2.39 2273.64 14 18 2.53 2320.63 2.39 2400.69 15 19 2.45 2449.55 2.39 2541.13 16 20 2.36 2578.48 2.39 2664.88 17 21 2.28 2704.40 2.39 2800.62 18 22 2.21 2844.24 2.39 2942.36 19 23 2.13 2965.25 2.39 3070.11 20 24 2.06 3094.17 2.39 3209.85 21 25 1.98 3223.1 2.39 3343.60 22 26 1.90 3351.9 2.39 3501.10 23 27 1.82 3483.3 2.39 3641.60 24 28 1.75 3609.8 2.39 3770.30 25 29 1.67 3738 2.39 3905.10 26 30 1.59 3867.72 2.39 4012.32 27 31 1.52 3996.64 2.39 4138.06 28 32 1.44 4125.56 2.39 4270.80 29 33 1.37 4254.49 2.39 4413.55 30 34 1.30 4383.41 2.39 4540.29 31 35 1.22 4521.34 2.39 4681.04 32 36 1.15 4641.26 2.39 4804.78 33 37 1.07 4770.18 2.39 4948.52 34 38 0.99 4899.11 2.39 5082.27 35 39 0.92 5028.03 2.39 5206.01 36 40 0.86 5156.96 2.39 5339.76
3.2 With eyelid
In this case the simulation results were obtained by applying a force on eyelid instead of cornea. This method differs than the various tonometry principles and techniques. The model of human eye built with an eyelid was used for analysis purpose. Here also the same value of IOP i.e. 27 mm of Hg was taken for sample calculation. Simulation was first done for indentation depth of 4.2 mm and for the indentation depth of 3.18 mm corresponding to 27 mm of Hg. Simulation was done and the shear force on the contact surface was found out to be 3055.8 Pa and 2717.6 Pa respectively. Similarly, the values of shear stress found are shown in Tab. 4.

Table 4: IOP and corresponding shear stress value got from simulation (variable and const.depth)

24 28 3.06 2781.1 4.2 3486.80 25 29 2.92 2880.4 4.2 3527.70 26 30 2.80 2999.64 4.2 3757.72 27 31 2.66 3127.62 4.2 3896.64 28 32 2.56 3243.61 4.2 4029.56 29 33 2.42 3329.60 4.2 4168.49 30 34 2.30 3439.59 4.2 4297.41 31 35 2.16 3547.58 4.2 4452.34 32 36 2.04 3599.56 4.2 4559.26 33 37 1.90 3699.55 4.2 4696.18 34 38 1.78 3799.54 4.2 4836.11 35 39 1.64 3899.53 4.2 4962.03 36 40 1.52 4127.52 4.2 5096.96
4 Discussion

Figure 7: Variation of FE analysis results against known IOP values
The work represented shows the simulation and analysis of constructed mechanical device over the human eye model. Initially a virtual model of the IOP measuring device was constructed. During simulation the shear force on the contact surface of the device was recorded in both the cases. Then the results were compared with the given IOP values which are represented in Fig. 7 and Fig. 8. In Tab. 1, the equivalent shear stress values are presented to applanate the cornea, since, closed eyelid itself exerts some pressure on cornea.Therefore, the pressure required to applanate the cornea through eyelid is less than that required to flatten the cornea directly (2.3).The Fig. 7 and Fig. 8 show the comparison of the shear stress value obtained after simulation for various indentation depths with mathematically calculated stress values. It has been observed that the results were more accurate when the simulation was done only on the cornea. The graphs were much closer to the input IOP curve with the average percentage error of 1.15%. But for the other case (with eyelid) the results were not much accurate to the known IOP values. Hence the graph for the same is not much closer to the input IOP curve, the average percentage error was found to be 4.41%. Stress values obtained by simulation with eyelid are slightly higher than theoretical values for constant indentation depth due to intervention of eyelid over cornea.

Figure 8: Variation of FE analysis results against known IOP values (with eyelid)
It has been observed that, the inaccuracy of the result may be due to some deficiency in the simulation environment because of neglecting the flows in anterior chamber and humor properties. The IOP measurement over the corneal surface is more accurate than the IOP measurement over eyelid surface. This may be due to the cornea and eyelid is modeled as soft tissues but in fact the eyelid pressure and properties differ. The compression spring used in the device for the measurement of force value may not be capable to measure very small changes in the pressure.
5 Conclusion
The FE results are found to be more precise and accurate for constant indentation depth.Also the error found in FEM results while measuring IOP through eyelid is small which represents the feasibility of further study with some advancement. For the further development of the device used to measure the IOP through eyelid, the indentation depth can be maintained constant throughout so that accurate measurement of IOP can be obtained. The proper calibration of the model can predict IOP more accurately.
Acknowledgement: The author would like to express their deep gratitude and sincere thanks to Dr. M.T Rewale, Dr. Ravikant Dhakate, Dr. Anupama Mawale and Mr. Rashmi for their guidance and suggestions throughout. It could not be possible to complete the present work without their help.
Conflicts of Interest: The authors have no conflicts of interest to declare.
Auvray, P.; Rousseau, L.; Lissorgues, G.; Soulier, F.; Potin, O. et al. (2012): A passive pressure sensor for continuously measuring the intraocular pressure in glaucomatous patients. IRBM, vol. 33, pp. 117-122.
Bauer, S. M.; Lyubimov, G. A.; Tovstik, P. E. (2005): Mathematical modeling of Maklakoff’s method for measuring the intraocular pressure. Fluid Dynamics, vol. 40, no.1, pp. 20-33.
Bocskai, Z. (2009): Numerical simulation of the human eye accommodation. Conference of Junior Researchers in Civil Engineering.
Chakrabarti, M.; John, S. R.; Chakrabarti, A. (2009): 180 years of evolution in Tonometry. Kerala Journal of Ophthalmology, vol. 21, no. 2, pp. 173-181.
Chiu, F. T. (2005): An exploration of a through-the-eyelid intraocular pressure measurement device (master thesis). Department of Electrical Engineering and Computer Science, Massachusetts Institute of Technology.
Davey, P. G.; Nouri, K.; Zaczyk, S. (2013): Assessing the need and benefits of home tonometers in the management of patients with glaucoma. Clinical Optometry, vol. 5, pp.19-27.
Deol, M.; Taylor, D. A.; Radeliffe, N. M. (2015): Corneal hysteresis and its relevance to glaucoma. Current Opinion in Ophthalmology, vol. 26, no. 2, pp. 96-102.
Dikin, V. I.; Ivanyschev, C. V.; Kornev, N. P.; Mikheev, A. A.; Solomakha, V. N. (2013):A dynamic tonometer for measuring intraocular pressure. Biomedical Engineering, vol. 47, no.3, pp. 130-133.
Dubois, P.; Zemmouri, J.; Rouland, J. F.; Paul, P.; Lopes, R. et al. (2007): A new method for intraocular pressure in vivo measurement: first clinical trials. Proceedings of the 29th Annual International Conference of the IEEE EMBS, France.
Esposito, L.; Clemente, C.; Bonora, N.; Rossi, T. (2015): Modeling human eye under blast loading. Computer Methods in Biomechanics and Biomedical Engineering, vol. 18,no. 2, pp. 107-115.
Ferreira, J. A.; de Oliveira, P.; da silva, P. M.; Murta, J. N. (2013): Numerical simulation of aqueous humor flow from healthy to pathologic situations. Pre-Publicacoes do Departamento de Matematica Universidade de Coimbra, pp. 13-27.
Hitchings, R. A. (2009): Glaucoma: an area of darkness. Eye, vol. 23, pp. 1764-1774.
Ju, Y.; Wang, B.; Xie, J.; Huang, L.; Huang, S. et al. (2005): Dynamic model of the aqueous humor circulation with application to simulation of the treatment for primary open angle glaucoma. Proceedings of the IEEE Engineering in Medicine and Biology 27th Annual Conference Shanghai, China.
Karani, P.; Tan, S.; Xiong, L.; Zhang, C. (2014): Home Intraocular Pressure measurement device. Duke University eye center 2006.
Kok, M.; Berendschot, T. T. J. M.; Hardus, P. (1998): Schiotz tonometry for glaucoma:are there simple alternatives. Tropical Medicine and International Health, vol. 3, no. 3, pp.210-213.
Liang, S. Y. W.; Lee, G. A.; Shields, D. (2009): Self-tonometry in glauco ma managementpast, present and future. Survey of Ophthalmology, vol. 54, no. 4, pp. 450-462.
Liu, J.; Roberts, C. J. (2005): Influence of corneal biomechanical properties on intraocular pressure measurement: quantitative analysis. Journal of Cataract & Refractive Surgery, vol. 31, no. 1, pp. 146-155.
Ljubimova, D. (2009): Biomechanics of the human eye and intraocular pressure measurements. Department of Mechanics, Royal Institute of Technology 2009, SE-10044 Stockholm, Sweden.
Lomoriello, D. S.; Lombordo, M.; Tranchina, L.; Oddone, F.; Serrao, S. et al.(2011): Repeatability of intra-ocular pressure and central corneal thickness measurements provided by a non-contact method of tonometry and pachymetry.Graefe's Archive for Clinical and Experimental Ophthalmology, vol. 249, pp. 429-434.
Moses, R. A. (1971): Theory of the Schiotz tonometer and its empirical calibration.Transactions of the American Ophthalmological Society, vol. 69, pp. 494.
Nakai, M.; Nagaoka, T.; Yoshizawa, I.; Fujita, A.; Takeda, S. et al. (2004):Development of noninvasive tonometer using resonance phenomeno. Proceedings of 26th Annual International Conference of the IEEE EMBS San Francisco, CA, USA.
Nejad, T. M.; Foster, C.; Gongal, D. (2014): Finite element modeling of cornea mechanics: A review. Arquivos Brasileiros De Oftalmologia, vol. 77, no. 1, pp. 60.Pierscionek, B. K.; Asejczyk-widika, M.; Schachar, R. A. (2007): The effect of changing intraocular pressure on the corneal and scleral curvatures in the fresh porcine eye. British Journal of ophthalmology, vol. 91, no. 6, pp. 801-803.
Piletskii, G. K. (1998): A device for measuring intraocular pressure through the eyelid.Biomedical Engineering, vol. 32, no. 4, pp. 47.
Pinar-Sueiro, S.; Rodriguez-Puertas, R.; Vecino, E. (2011): Cannabinoid applications in glaucoma. Archivos de la Sociedad Española de Oftalmología, vol. 86, no. 1, pp. 16-23.Polyvas, P. P.; Peyman, G.; Enikov, E. T. (2013): Trans-scleral tactile tonometry: an instrumented approach. Medical Engineering and Physics, vol. 35, pp. 937-943.
Power, E. D; Stitzel, J. D.; West, R. L.; Herring, I. P.; Duma, S. M. (2014): A nonlinear Finite Element model of Human eye for large deformation loading. www.ibl.vt.edu.
Sathyanarayanan, V.; Mahadas, K.; Hung, G. K. (2013): Homeomorphic model of the effect of impact trauma on the human eye. Journal of Comparative Systematic Biology, vol.6, pp. 317-326.
Schutte, S.; van den Bedem, S. P. W.; van Keulen, F.; van der Helm, F. C. T.; Simonsz,H. J. (2006): A finite-element analysis model of orbital biomechanics. Vision Research,vol. 46, pp. 1724-1731.
Shigely, J. E.; Mischke, C. R. (2006): Mechanical engineering design (sixth edition). Tata McGraw-Hill publishing company Limited New Delhi.
Singh, P. (2014): Tonometry, an overview. IOSR Journal of Dental and Medical Sciences,vol. 13, no. 1, pp. 67-70.
Terminology and Guidelines for Glaucoma, European Glaucoma Society, 4thedition (2016).www.eugs.org.
Tong, Y.; Xia, Z. (2012): Intraocular pressure measuring system based on piezoelectric bimorph. Energy Procedia, vol. 16, pp. 1288-1294.
Villamarin, A.; Roy, S.; Hasballa, R.; Vardoulis, O.; Reymond, P. (2012): 3D simulation of aqueous flow in the human eye. Medical Engineering and Physics, vol. 34,pp. 1462-1470.
Woo, S. L.; Kobayashi, A. S.; Lawrence, C. (1972): Nonlinear material properties of intact cornea and sclera. Experimental Eye Research, vol. 14, pp. 29-39.
Xie, J. Z.; Wang, B. L.; Ju, Y.; Liu, B. (2008): Biomechanical model of cornea deformation and simulation. IEEE, pp. 1818-1821.
Xing, Q.; Wei, Q. (2014): Human eyeball model reconstruction and quantitative analysis.IEEE, pp. 2460-2463.
Yves, C. A.; Robert, M. D. (2007): What do we measure with various techniques while assessing IOP. Survey of Ophthalmology, vol. 52, no. 6, pp. S105-S108.
杂志排行

Computer Modeling In Engineering&Sciences的其它文章
- Dimensionless Study on Secretion Clearance of a Pressure Controlled Mechanical Ventilation System with Double Lungs
- Automatic Delineation of Lung Parenchyma Based on Multilevel Thresholding and Gaussian Mixture Modelling
- Mechanism Based Pharmacokinetic Pharmacodynamic Modeling of Vildagliptin as an Add-on to Metformin for Subjects with Type 2 Diabetes
- Using a Musculoskeletal Mathematical Model to Analyze Fatigue of the Muscles in the Lower Limbs during Different Motions
- An Ensemble Based Hand Vein Pattern Authentication System
- Patient-Specific Echo-Based Fluid-Structure Interaction Modeling Study of Blood Flow in the Left Ventricle with Infarction and Hypertension