Mechanism Based Pharmacokinetic Pharmacodynamic Modeling of Vildagliptin as an Add-on to Metformin for Subjects with Type 2 Diabetes
2018-03-10MarziyehEftekhariandOmidVahidi
Marziyeh Eftekhari and Omid Vahidi,
1 Introduction
Several anti-diabetic drugs have been developed over the past hundred years. Perhaps,exogenous insulin has been the first drug used practically to control the blood sugar in patients with diabetes since 1920s [White (2014)]. For type 1 diabetes, exogenous insulin is the only medication used to control the blood sugar due to the lack of endogenous insulin production caused by fully destruction of the subjects’ pancreatic beta cells.However, in case of type 2 diabetes, since high blood sugar is attributed to the multiple abnormalities in different body organs of the diabetic subjects [Vahidi, Gopaluni and Ezra (2015)], several classes of anti-diabetic drugs each of which are effective on specific organs have been introduced to the market [White (2014)].
Metformin, a member of biguanide class of anti-diabetic drugs, has been used as an oral anti-hyperglycemic agent in France since 1957 [Stargrove, Treasure and McKee (2008)]and has been administered as the initial preferred anti-diabetic drug for subjects with type 2 diabetes for many years [Rhee, Chung, Yi et al. (2017)]. It received approval from the United States Food and Drug Administration (FDA) on 1994 and used in the US market since then [Howlett and Bailey (1999)]. Metformin lowers the blood sugar by suppressing hepatic glucose production [Kirpichnikov, McFarlane and Sowers (2002)],enhancing peripheral glucose uptake resulted from increased insulin sensitivity [Bailey and Turner (1996)] and increasing intestinal glucose consumption [McCreight, Bailey and Pearson (2016)]. Vildagliptin, a member of dipeptidyl peptidase 4 (DPP-4) inhibitors,is a new oral anti-hyperglycemic drug used in more than 76 countries [Landersdorfer, He and Jusko (2012a)]. DPP-4 inhibitors decrease the blood glucose concentration by prolonging the circulation of active glucagon like peptide 1 (GLP-1), one of the two most important incretin hormones, by inhibiting DPP-4 enzyme responsible for deactivating the GLP-1 [Landersdorfer, He and Jusko (2012b)].
Combination of drugs from different classes to complement each other’s action may enhance the drugs medical impact on the diabetic subjects. Since biguanids and DPP-4 inhibitors have different mechanisms and sites of action, polytherapy of vildagliptin as an add-on to the metformin has been the topic of some recent studies [Berndt-Zipfel,Michelson, Dworak et al. (2013); Blüher, Kurz, Dannenmaier et al. (2012); Halimi,Schweizer, Minic et al. (2008); Ji, Pan, Lu et al. (2013); Tang, Wang, Jiang et al. (2015)].Clinical trials on human subjects have indicated that their combination enhances the blood sugar control in subjects with type 2 diabetes. While human experimentations have been conducted to prove the hypothesis, they are very expensive and sometimes impossible to be performed due to the medical restrictions. They should also meet ethical concerns and may results in unpredicted side effects for subjects. Pharmacokinetic/pharmacodynamic (PK/PD)mathematical modeling of drugs is another alternative which enables investigating the effects of drugs on the subjects in computer environment.
A few studies have been published on PK/PD mathematical modeling of vildagliptin[Landersdorfer, He and Jusko (2012a, 2012b)] and metformin [Lee and Kwon (2004);Stepensky, Friedman, Raz et al. (2002); Sun, Kwok, Gopaluni et al. (2011)] so far. Lee et al. [Lee and Kwon (2004)] proposed a one equation indirect response model to represent the metformin glucose lowering effect in human diabetic subjects. Using a similar approach, Stepensky et al. [Stepensky, Friedman, Raz et al. (2002)] simulated the glucose lowering effect of metformin by an indirect response model on diabetic rats. The main difference between the two research studies was considering the number of compartments to represent the glucose concentration in the body. In Lee and Kwon study, the whole human body was considered as one physiological compartment while Stepensky et al.simulated the metformin glucose lowering effect within three compartments including liver, gastrointestinal (GI) tract and systemic circulation (comprising blood, different organs and tissues). The Stepensky et al. model was later used by Lin et al. for type 2 diabetic human subjects [Sun, Kwok, Gopaluni et al. (2011)]. Using clinical data from human subjects, they indicated that the Stepensky et al. model structure can be used to predict the pharmacokinetics and pharmacodynamics of metformin on human subjects by updating the model parameters. In terms of vildagliptin, Landersdorfer et al.[Landersdorfer, He and Jusko (2012a); Landersdorfer, He and Jusko (2012b)] considered a two compartment model, central and peripheral compartments, to represent the vildagliptin pharmacokinetics. To model its pharmacodynamics, they considered a four compartment model, three for glucose, insulin and GLP-1 concentrations and one for the glucose metabolism in the gut, to represents their variations in the subject’s body.
In the present study, we have mathematically investigated the impact of vildagliptin as an add-on to metformin to regulate the blood sugar of type 2 diabetic subjects. The drugs pharmacokinetics is modeled by combining the models proposed by Lin et al. (the updated Stepensky et al. model) and Landersdorfer et al. To model the drugs pharmacodynamics, simple mathematical models with minimal number of compartments cannot be utilized since they cannot accommodate the required compartments to represent the pharmacodynamics of vildagliptin and metformin at the same time.Therefore, a comprehensive mathematical model developed in our previous work for a group of type 2 diabetic subjects [Vahidi, Kwok, Gopaluni et al. (2016)] is used and the rate of various species in different organs (i.e. glucose, insulin and GLP-1) are modified to account for the effects attributed to the drugs. Computer simulations are performed to investigate the impact of the vildagliptin and metformin on blood sugar regulation when are used individually and combinedly.
2 Mathematical modeling
2.1 Vahidi et al. model
Vahidi et al. model is a detailed mathematical model proposed for healthy and type 2 diabetic subjects which considers the insulin, glucagon and incretins hormonal regulatory effects on glucose [Vahidi, Kwok, Gopaluni et al. (2016)]. The model is an expanded form of another model proposed by Vahidi et al. [Vahidi, Kwok, Gopaluni et al. (2011)]for type 2 diabetic subjects based on a detailed model previously developed by Sorensen for healthy subjects [Sorensen (1985)]. This model is used to investigate the drugs pharmacodynamics.
The model has four sub-models representing different substance concentrations, one of which for the blood glucose concentration and three of which for the concentrations of glucose regulatory hormones including insulin, glucagon and incretins in the body.Different number of compartments is considered for each sub-model. The insulin submodel comprises seven compartments interconnected by main blood vessels as depicted in Fig 1. The same compartments are considered for the glucose sub-model except for the pancreas compartment not included into the glucose sub-model as an individual compartment.For the incretins and glucagon, the whole body is considered as one compartment. For some compartments, sub-compartments are considered to account for the remarkable species transport resistance between the capillaries and interstitial fluid space (e.g. peripheral compartment in insulin sub-model as shown if Fig. 1) [Sorensen (1985)]. Mass balance over each sub-compartment constitutes the mathematical model equations (Appendix A). The Vahidi et al. model structure for healthy and type 2 diabetic subjects are the same. Only the values for model parameters are different. For the present study, the parameters for type 2 diabetic subjects are used and are available in Appendix A.
It should be noted that since GLP-1 is the only functional incretins in type 2 diabetic subjects [Garber (2011); Kim and Egan (2008); Meier and Nauck (2010)] and Vahidi et al. has considered both GLP-1 and GIP (another one of the two most important incretin hormones) concentrations in their model, a simple modification is implemented in Vahidi et al. model and instead of incretins concentration only GLP-1 concentration is considered.
2.2 Drugs pharmacokinetics modeling
The pharmacokinetics of metformin together with vildagliptin is modeled by combining the Lin et al. and Landersdorfer et al. PK mathematical models. Based on the metformin mechanism of action which triggers hepatic glucose production and peripheral and GI glucose uptakes, three compartments were considered to model metformin pharmacokinetics.Using the same approach here, we use the Lin et al. model to calculate the metformin concentration in the liver, GI tract and peripheral tissues. The calculated concentrations are used in the PD model to obtain the metformin glucose lowering effect on those specific organs.

Figure 1: Schematic representation of the insulin sub-model
The Landersdorfer et al. [Landersdorfer, He and Jusko (2012a)] PK/PD model for vildagliptin, considers the drug distribution and elimination into two central and peripheral compartments. In these compartments, the drug binds to the active DPP-4 enzyme and deactivates it causing the increase in active GLP-1 presence into the circulation which consequently decreases the blood sugar. The drug concentration in central compartment is used to calculate the drug effect in the PD model.
2.3 Drugs pharmacodynamics modeling
Stepensky et al. employed indirect response modeling approach to model the metformin pharmacodynamics. They defined three variables, one of which for the inhibition effect of metformin on hepatic glucose production and two of which for the stimulation effect of metformin on GI and peripheral glucose uptake and used them in metformin PD model.In another attempt for metformin pharmacodynamics modeling, Sun et al. [Sun, Kwok,Gopaluni et al. (2011)] utilized the variables defined by Stepensky et al. and modified the hepatic glucose production rate and GI and peripheral glucose uptake rates defined in Vahidi et al. first model [Vahidi, Kwok, Gopaluni et al. (2011)] to address the metformin glucose lowering effect. Here, we have considered the similar approach in modeling the metformin pharmacodynamics by modifying the metabolic rates in the Vahidi et al.expanded model [Vahidi, Kwok, Gopaluni et al. (2016)]. The sigmoidal Emaxmodel is used to define the variables attributed to inhibition of hepatic glucose production and stimulation of GI and peripheral glucose uptake rates as follows [Sun, Kwok, Gopaluni et al. (2011)]:

where EL, EGand EPare the metformin inhibitory and stimulatory effects at their corresponding metformin concentrations (i.e. AL, AGand AP) in liver, gut and periphery compartments, respectively, AL50, AG50and AP50are metformin concentrations at which half of the maximum effect (i.e. ELmax, EGmaxand EPmax) is obtained. Using Eqs. (1-3),A.11, A.12 and A.16, the modified rates of the Vahidi et al. model are:

According to the vildagliptin mechanism of action which deactivates the active DPP-4 enzyme, the PD model of vildagliptin is formulated by modifying Eq. (A.54) as follows:

where rIΨ1Pis the rate of GLP-1 secretion calculated by Eq. (A.53), Koutis the first order clearance rate constant from the blood circulation for GLP-1 cleared through a non-saturable pathway independent on the DPP-4 concentration and (RmaxC−DRC)×Cf2is the saturable DPP-4 eliminating pathway where DRCis the drug deactivated DPP-4 concentration at central compartment and RmaxCis the maximum available active DPP-4 concentration at zero drug concentration [Landersdorfer, He and Jusko (2012a)]. The numerical values of Koutand Cf2constants are set such that their values at zero drug concentration equals the Vahidi et al. model and their ratio equals to that of the Landersdorfer et al. model. The rest of the PD model parameters are taken from[Landersdorfer, He and Jusko (2012a); Sun, Kwok, Gopaluni et al. (2011); Vahidi, Kwok,Gopaluni et al. (2016)].
3 Results and discussion
3.1 Steady states solution
The resulted PK/PD mathematical model for metformin and vildagliptin comprises 37 ordinary differential equations (ODEs), 27 equations for the modified Vahidi et al. model,6 equations for Landersdorfer et al. PK model and 4 equations for the Lin et al. PK model as well as many algebraic equations to be solved alongside the ODEs. The initial conditions of the ODEs are obtained by solving the model at steady states. Fasting condition with no drug administration is considered as the steady states for the diabetic subjects. Therefore, the initial conditions for the Lin et al. and Landersdorfer et al. PK model equations are zero for all equations. To obtain the initial conditions for modified Vahidi et al. model equations, all derivative terms are set to zero and all metabolic rates are set at their basal conditions (i.e. fasting condition) resulting in four decoupled sets of algebraic equations corresponding to each sub-model. At fasting conditions, since no glucose is present in the gut, the initial condition for GLP-1 sub-model is zero since this hormone is secreted when glucose is present into the duodenum. For glucagon sub-model,since normalized value of glucagon is used, an arbitrary value is considered for glucagon basal concentration. For glucose sub-model, the degree of freedom for algebraic solution is one and one unknown variable has to be set and therefore, the available measured value of peripheral glucose concentration is set at 153.4 mg/dl. Similar to the glucose submodel, the available measured peripheral insulin concentration is set at 5.9 mU/l. These values are taken from the clinical data sets published by Knop et al. [Knop, Vilsboll,Hojberg et al. (2007)] which were used by Vahidi et al. to estimate their model parameters for the group of diabetic subjects.
3.1 Dynamic solution
To investigate the lowering effect of drug administration on type 2 diabetic subjects, an in silico 50 g oral glucose tolerance test (OGTT) with the administration of 500 mg metformin together with 25 mg vildagliptin is performed. The test is repeated with the administration of individual drugs and with no drug administration. Fig. 2 shows the variations of peripheral glucose concentrations and Fig. 3 (a) and (b) indicate the variations of peripheral insulin and GLP-1 concentrations during the four 50 g OGTTs.

Figure 2: The variations of peripheral glucose concentration during the 50 g OGTT
As Fig. 2 indicates, vildagliptin reveals a non-significant lowering effect on the blood glucose levels. According to Fig. 3 (b), vildagliptin has effectively increased the GLP-1 level by inhibiting the DPP-4 enzyme and consequently, the plasma insulin concentration has a remarkable increment (Fig. 3 (a)), however, due to the high insulin resistance and significant abnormalities associated with this group of diabetic subjects, the impact of insulin increase on lowering the blood glucose is not significant. As the time passes,vildagliptin gets cleared from the circulation and therefore, its effect completely disappears after around 300 min of the test.
On the other hand, although metformin reveals a weak impact on lowering the blood sugar at the beginning of the test, its glucose lowering effect increases as the blood sugar level falls. The reason is due to the high suppression of hepatic glucose production when the blood sugar is high. Hepatic glucose production is inversely proportional to the blood glucose concentration and its amount is significantly reduced by high levels of plasma glucose concentration at the beginning of the test (see Fig. 4). Since the glucose lowering effect of metformin is remarkably implemented by suppressing the hepatic glucose production, metformin becomes almost ineffective on the liver when hepatic glucose production is already suppressed by other factors. As the results indicate, the glucose lowering effect of metformin lasts longer than that of vildagliptin for this group of diabetic subjects. It also diminishes gradually by passage of time until it fully vanishes at around 1000 min of the test (the results are not shown).
The results also prove the drugs complementation of each other’s action. Vildagliptin complements the glucose lowering effect of metformin since their mechanisms of action do not interfere and therefore, the vildagliptin glucose lowering effect adds to that of metformin.
Quantitative comparisons between the four in silico tests are provided in Fig. 5-8. The information on these figures (except for Fig. 8) are obtained by integrating the production and uptake rates of glucose and insulin for the four oral glucose tolerance tests up to 300 min where the species concentrations reach almost to their steady state values (see Figs. 2 and 3). Fig. 8 indicates the integration of glucose concentration profiles (Fig. 2) for 300 min of the tests with drug administration subtracted from the same amount obtained from the test with no drug administration.
As Fig. 5 indicates, total peripheral and GI glucose uptake amounts are enhanced by approximately 17.5% and 45.5%, respectively, for the tests with metformin administration compared to the tests with no metformin administration, however, in contrary to the expectations, the total hepatic glucose production amount is apparently not only suppressed after metformin administration, but also slightly augmented by approximately 4.5% (see Fig. 6). As implied earlier, glucose induced suppression of hepatic glucose production is not abnormal for this group of diabetic subjects causing the significant suppression of hepatic glucose production rate when glucose concentration is high. Since the glucose levels during the OGTT tests are remarkably higher when no metformin is administered compared with the tests with metformin administration (see Fig. 2), it yields significantly higher suppression of hepatic glucose production. Therefore,the reason for slightly more total hepatic glucose production amount is due to the remarkably lower glucose levels. Moreover, a more realistic evaluation of metformin suppressive effect on hepatic glucose production shouldbeperformedusing Eq. (4)bycalculating the suppression percentagebased onand values which results in approximately 35% of hepatic glucose production suppression.

Figure 5: Total hepatic, peripheral and GI glucose uptake amounts for 300 min of the four 50 g oral glucose tolerance tests

Figure 6: Total hepatic glucose production amount (g) for 300 min of the four 50 g oral glucose tolerance tests
As Fig. 7 indicates, vildagliptin administration enhances the total pancreatic insulin secretion amount by approximately 17.5%. Also, when metformin is administered, the total pancreatic insulin secretion is lowered due to the lowered glucose levels caused by the administration of metformin which consequently lowers the need of pancreatic insulin secretion.
Integration of glucose concentration profile for the tests with drug administration enables a quantitative comparison of drugs lowering effect on blood glucose levels. As Fig. 8 shows, the glucose lowering effect of metformin is much stronger than that of vildagliptin.Nevertheless, something more interesting is that the glucose lowering effect of the combined drugs is higher than the summation of individual drugs’ effects proving the synergetic complementation of combined drugs. This is because of the different drugs mechanisms of action in lowering the blood sugar level which not only interfere each other’s action, but also amplify each other’s action.

Figure 7: Total pancreatic insulin secretion amount (U) for 300 min of the four 50 g oral glucose tolerance tests
3 Conclusion
We developed a mathematical PK/PD model for the administration of vildagliptin as an add-on to metformin by combining the available mathematical models individually proposed for metformin and vildagliptin. For the PK model, Lin et al. PK model for metformin and Landersdorfer et al. PK model for vildagliptin were used and for the PD model a comprehensive mathematical model proposed by Vahidi et al. for type 2 diabetic subjects with some modifications was used. The models were all interconnected to obtain the PK/PD model for the combination of vildagliptin and metformin drugs. Mathematical simulation of 50 g oral glucose tolerance test was performed and the impact of drugs administration when were used individually and combinedly was qualitatively and quantitatively investigated. Both drugs revealed glucose lowering effects. The impact of metformin on glucose level reduction was stronger than that of the vildagliptin for the group of diabetic subjects for whom the model was developed. Also, due to the separate mechanisms of action of both drugs, they synergized their glucose lowering effects which means that the glucose lowering effect of their combination was greater than the summation of their individual effects.
Appendix A
The following nomenclature is adopted for the Vahidi et al. model description:
Model variables in the glucose sub-model
D Oral glucose amount (mg)
G Glucose concentration (mg/dl)
M Multiplier of metabolic rates (dimensionless)
q Glucose amount in GI tract (mg)
在国际市场的发展过程中,一些企业已经认识到预算管理的重要性,并试图建立许多预算管理机制。切实的到企业中运营和实施,而预算管理不仅对预算本身有着很高的需求,而且还需要有完善的监管机制来实现有效管理。在预算管理机制实施的过程中,我国企业主要关注预算工作的细节和内容,对预算管理的监督体系缺乏了解,使得企业预算管理不可能实现全面有效的落实。

Figure 8: Integration of glucose concentration profiles for the tests with drugs administration subtracted from the same value obtained from the test with no drug administration. The unit of the indicated values are min.g/dl
Q Vascular blood flow rate (dl/min)
r Metabolic production or consumption rate (mg/min)
Ra Rate of glucose appearance in the blood stream (mg/min)
T Transcapillary diffusion time constant (min)
t Time (min)
V Volume (dl)
Model variables in the insulin sub-model
I Insulin concentration (mU/l)
M Multiplier of metabolic rates (dimensionless)
m Labile insulin mass (U)
P Potentiator (dimensionless)
Q Vascular blood flow rate (l/min)
R Inhibitor (dimensionless)
r Metabolic production or consumption rate (mU/min)
S Insulin secretion rate (U/min)
T Transcapillary diffusion time constant (min)
t Time (min)
V Volume (l)
X Glucose-enhanced excitation factor (dimensionless)
Y Intermediate variable (dimensionless)
Model variables in the glucagon sub-model
Γ Normalized glucagon concentration (dimensionless)
M Multiplier of metabolic rates (dimensionless)
r Metabolic production or consumption rate (dl/min)
V Volume (dl)
t Time (min)
Model variables in the GLP-1 sub-model
Ψ1GLP-1 concentration (pmol/l)
ψ1Amount of produced GLP-1 (pmol)
r Metabolic production or consumption rate (pmol/min)
V Volume (l)
t Time (min)
First superscript
Ψ1GLP-1
B Basal condition
G Glucose
I Insulin
Second superscript
∞ Final steady state value
Metabolic rate subscripts
BGU Brain glucose uptake
GGU Gut glucose uptake
HGP Hepatic glucose production
HGU Hepatic glucose uptake
IΨ1R Intestinal GLP-1 release
IVG Intravenous glucose injection
IVI Intravenous insulin injection
KGE Kidney glucose excretion
KIC Kidney insulin clearance
LIC Liver insulin clearance
MΓC Metabolic glucagon clearance
PΓC Plasma glucagon clearance
PΨ1C Plasma GLP-1 clearance
PΓR Pancreatic glucagon release
PGU Peripheral glucose uptake
PIC Peripheral insulin clearance
PIR Pancreatic insulin release
RBCU Red blood cell glucose uptake
First subscripts
A Hepatic artery
B Brain
G Gut
H Heart and lungs
L Liver
P Periphery
S Stomach
∞ Final steady state value
Second subscripts (if required)
C Capillary space
F Interstitial fluid space
l Liquid
s Solid
A.1 Glucose sub-model
The mass balance equation over each sub-compartment in the glucose sub-model results in the following equations:
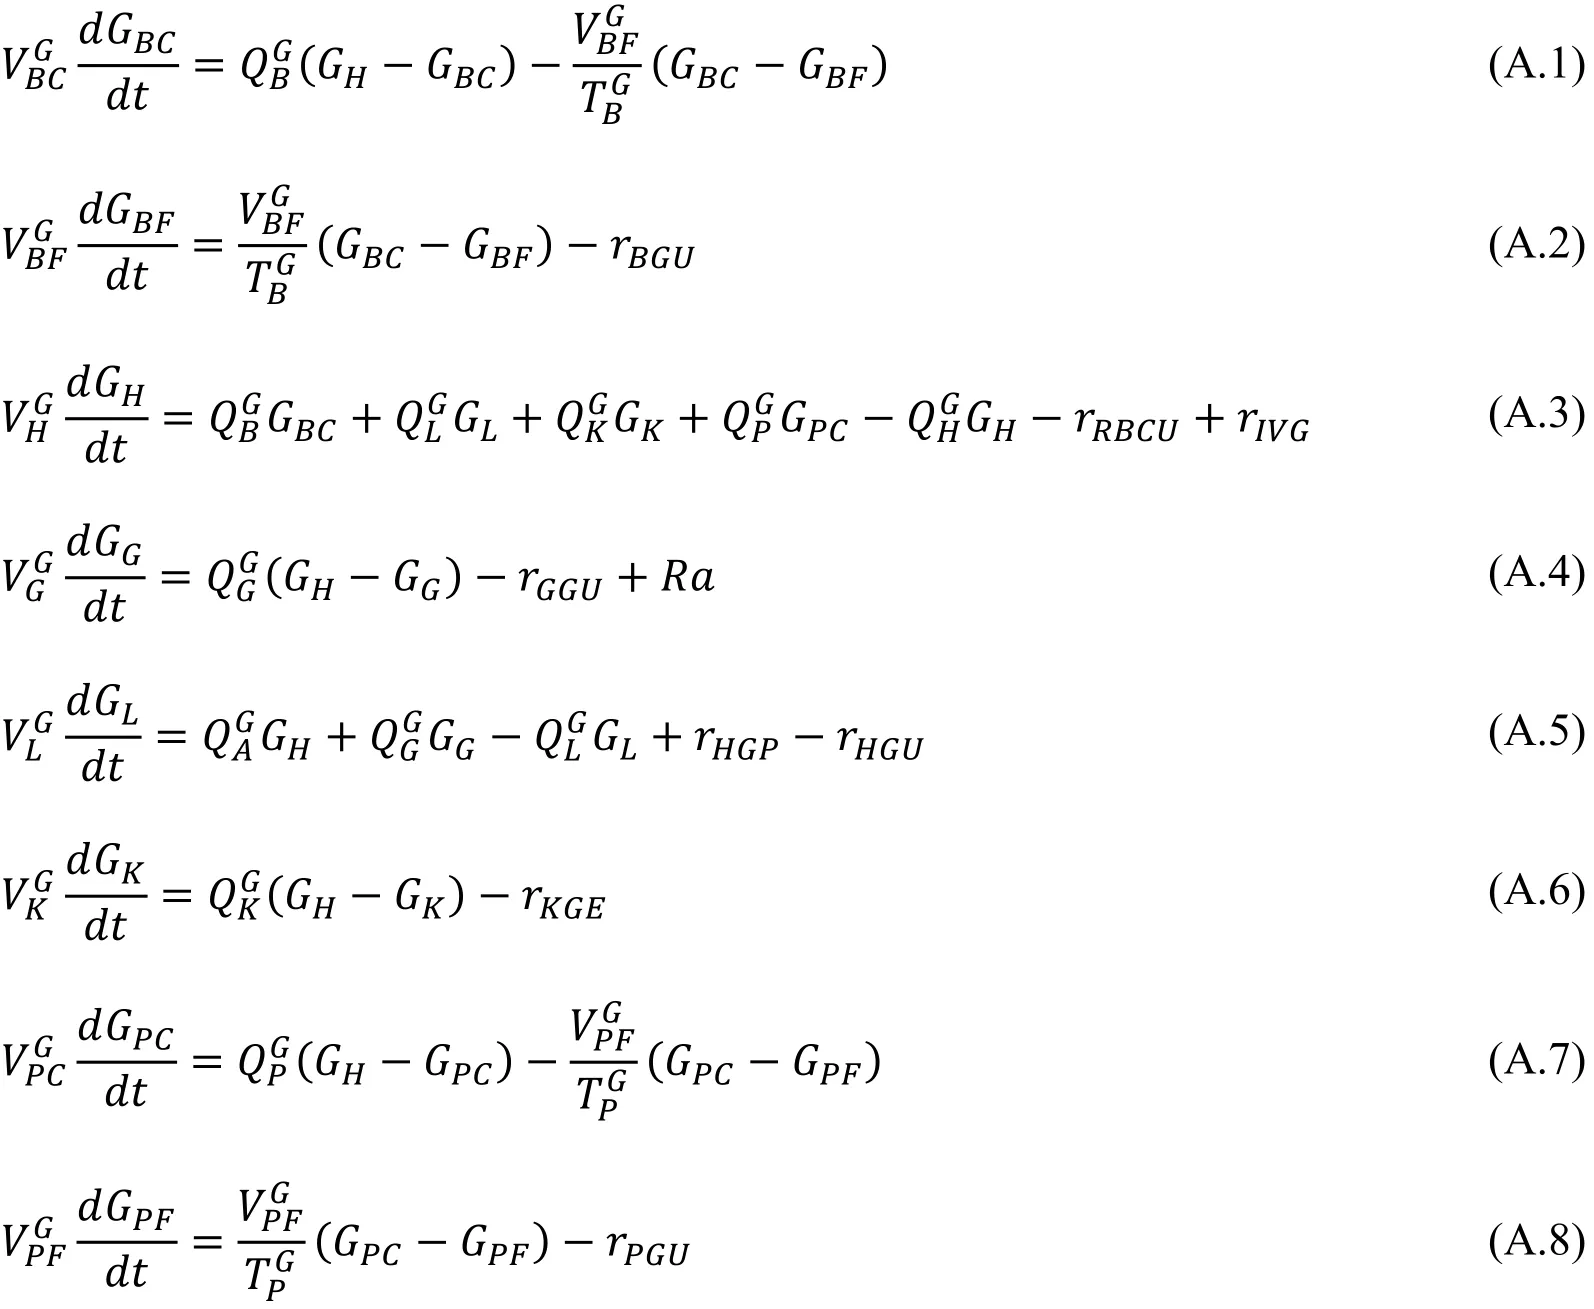
The metabolic rates for the glucose sub-model are summarized below:


The glucose absorption amount in the GI tract, Ra, is calculated from the following equations:


where δ(t) is the impulse function.
A.2 Insulin sub-model
The mass balance over the sub-compartments of the insulin sub-model is as follows:


A separate model is included into the Vahidi et al. model to calculate the pancreatic insulin secretion rate under the insulin sub-model [Vahidi, Kwok, Gopaluni et al. (2016)]whose equations are not shown here.
A.3 Glucagon sub-model
Since the glucagon sub-model considers the whole body as one compartment, it only has one equation:

The metabolic rates for the glucagon sub-model are summarized below:

A.4 GLP-1 sub-model
The GLP-1 sub-model also has one compartment, however, two equations are used to model this sub-model [Vahidi, Kwok, Gopaluni et al. (2016)]. As mentioned, this submodel was originally for incretins (i.e. GLP-1 and GIP together), but since GLP-1 is the only functional incretins for type 2 diabetic subjects, the Vahidi et al. model is slightly modified to only accommodate the GLP-1. For that, only the constants are changed and the sub-model structure is remained unchanged:

The model constant parameters are available in [Vahidi, Kwok, Gopaluni et al. (2016)].
Bailey, C. J.; Turner, R. C. (1996): Metformin. New England Journal of Medicine, vol.334, no. 9, pp. 574-579.
Berndt-Zipfel, C.; Michelson, G.; Dworak, M.; Mitry, M.; Löffler, A. et al. (2013):Vildagliptin in addition to metformin improves retinal blood flow and erythrocyte deformability in patients with type 2 diabetes mellitus-results from an exploratory study.Cardiovascular Diabetology, vol. 12, pp. 59.
Blüher, M.; Kurz, I.; Dannenmaier, S.; Dworak, M. (2012): Efficacy and safety of vildagliptin in clinical practice-results of the PROVIL-study. World Journal of Diabetes,vol. 3, no. 9, pp. 161-169.
Garber, A. J. (2011): Incretin therapy-present and future. The Review of Diabetic Studies:RDS, vol. 8, no. 3, pp. 307.
Halimi, S.; Schweizer, A.; Minic, B.; Foley, J.; Dejager, S. (2008): Combination treatment in the management of type 2 diabetes: focus on vildagliptin and metformin as a single tablet. Vascular Health and Risk Management, vol. 4, no. 3, pp. 481-492.
Howlett, D. H. C. S.; Bailey, C. J. (1999): A Risk-Benefit Assessment of Metformin in Type 2 Diabetes Mellitus. Drug Safety, vol. 20, no. 6, pp. 489-503.
Ji, L. N.; Pan, C. Y.; Lu, J. M.; Li, H.; Li, Q. et al. (2013): Efficacy and safety of combination therapy with vildagliptin and metformin versus metformin up-titration in Chinese patients with type 2 diabetes mellitus: study design and rationale of the vision study. Cardiovascular Diabetology, vol. 12, pp. 118.
Kim, W.; Egan, J. M. (2008): The role of incretins in glucose homeostasis and diabetes treatment. Pharmacological Reviews, vol. 60, no. 4, pp. 470-512.
Kirpichnikov, D.; McFarlane, S. I.; Sowers, J. R. (2002): Metformin: an update.Annals of Internal Medicine, vol. 137, no. 1, pp. 25-33.
Knop, F. K.; Vilsboll, T.; Hojberg, P. V.; Larsen, S.; Madsbad, S. et al. (2007):Reduced incretin effect in type 2 diabetes: cause or consequence of the diabetic state?Diabetes, vol. 56, no. 8, pp. 1951-1959.
Landersdorfer, C. B.; He, Y. L.; Jusko, W. J. (2012a): Mechanism-based population modelling of the effects of vildagliptin on GLP-1, glucose and insulin in patients with type 2 diabetes. British Journal of Clinical Pharmacology, vol. 73, no. 3, pp. 373-390.
Landersdorfer, C. B.; He, Y. L.; Jusko, W. J. (2012b): Mechanism-based population pharmacokinetic modelling in diabetes: vildagliptin as a tight binding inhibitor and substrate of dipeptidyl peptidase IV. British Journal of Clinical Pharmacology, vol. 73,no. 3, pp. 391-401.
Lee, S. H.; Kwon, K. I. (2004): Pharmacokinetic-pharmacodynamic modeling for the relationship between glucose-lowering effect and plasma concentration of metformin in volunteers. Archives of Pharmacal Research, vol. 27, no. 7, pp. 806-810.
McCreight, L. J.; Bailey, C. J.; Pearson, E. R. (2016): Metformin and the gastrointestinal tract. Diabetologia, vol. 59, no. 3, pp. 426-435.
Meier, J. J.; Nauck, M. A. (2010): Is the diminished incretin effect in type 2 diabetes just an epi-phenomenon of impaired β-cell function? Diabetes, vol. 59, no. 5, pp. 1117-1125.
Rhee, S. J.; Chung, H.; Yi, S.; Yu, K. S.; Chung, J. Y. (2017): Physiologically based pharmacokinetic modelling and prediction of metformin pharmacokinetics in renal/hepaticimpaired young adults and elderly populations. European Journal of Drug Metabolism &Pharmacokinetics, vol. 42, pp. 973-980.
Sorensen, J. T. (1985): A physiological model of glucose metabolism in man and its use to design and assess improved insulin therapies for diabetes. Massachusetts Institute of Technology, vol. 1, pp. 1-556.
Stargrove, M. B.; Treasure, J.; McKee, D. L. (2008): Herb, nutrient, and drug interactions: clinical implications and therapeutic strategies. Mosby/Elsevier.
Stepensky, D.; Friedman, M.; Raz, I.; Hoffman, A. (2002): Pharmacokineticpharmacodynamic analysis of the glucose-lowering effect of metformin in diabetic rats reveals first-pass pharmacodynamic effect. Drug Metabolism & Disposition the Biological Fate of Chemicals, vol. 30, no. 8, pp. 861.
Sun, L.; Kwok, K. E.; Gopaluni, R. B.; Vahidi, O. (2011): Pharmacokineticpharmacodynamic modeling of metformin for the treatment of type II diabetes mellitus.The Open Biomedical Engineering Journal, vol. 5, pp. 1-7.
Tang, Y. Z.; Wang, G.; Jiang, Z. H.; Yan, T. T.; Chen, Y. J. et al. (2015): Efficacy and safety of vildagliptin, sitagliptin, and linagliptin as add-on therapy in Chinese patients with T2DM inadequately controlled with dual combination of insulin and traditional oral hypoglycemic agent. Diabetology & Metabolic Syndrome, vol. 7, pp. 91.
Vahidi, O.; Kwok, K. E.; Gopaluni, R. B.; Knop, F. K. (2016): A comprehensive compartmental model of blood glucose regulation for healthy and type 2 diabetic subjects.Medical & Biological Engineering & Computing, vol. 54, no. 9, pp. 1383-1398.
Vahidi, O.; Kwok, K. E.; Gopaluni, R. B.; Sun, L. (2011): Developing a physiological model for type II diabetes mellitus. Biochemical Engineering Journal, vol. 55, no. 1, pp.7-16.
Vahidi, O.; Gopaluni, R. B.; Ezra, K. (2015): Detection of abnormalities in type II diabetic patients using particle filters. Journal of Medical and Biological Engineering,vol. 35, no. 2, pp. 188-201.
White, J. R. (2014): A brief history of the development of diabetes medications.Diabetes Spectrum, vol. 27, no. 2, pp. 82-86.
猜你喜欢
杂志排行

Computer Modeling In Engineering&Sciences的其它文章
- Dimensionless Study on Secretion Clearance of a Pressure Controlled Mechanical Ventilation System with Double Lungs
- Automatic Delineation of Lung Parenchyma Based on Multilevel Thresholding and Gaussian Mixture Modelling
- Modeling and Simulation of Human Cornea for the Measurement of Intraocular Pressure (IOP) through Eyelid
- Using a Musculoskeletal Mathematical Model to Analyze Fatigue of the Muscles in the Lower Limbs during Different Motions
- An Ensemble Based Hand Vein Pattern Authentication System
- Patient-Specific Echo-Based Fluid-Structure Interaction Modeling Study of Blood Flow in the Left Ventricle with Infarction and Hypertension