Statistics
2017-12-25
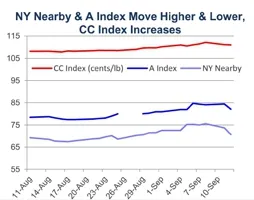
Recent price movement
NY futures and the A Index were influenced by U.S. crop expectations over the past month. Chinese prices were affected by exchange rates. South Asian prices were flat or lower.
► After collapsing with the release of a higher U.S. production forecast in last month’s report, NY futures moved higher with production-related concerns stemming from the arrival of two major hurricanes. Values climbed from levels near 67 cents/lb in mid-August to those near 75 cents/lb in early September.Since it became apparent that hurricane Irma’s damage may be less than initially feared, NY futures turned lower. This month’s USDA report, which featured another large increase to the U.S. production forecast, sent values down further,with the market locking down the three cents/lb limit the day the report was released.
► Cotlook’s A Index followed the pattern of movement in NY futures, rising from levels near 77 cents/lb to those near 84 cents/lb between mid-August and early September. More recently, the direction turned lower, with the latest value for the A Index being 82 cents/lb.
► The China Cotton (CC) Index was stable in domestic terms, holding to levels near 15,900 RMB/ton. However, with the RMB strengthening about 4% against the dollar over the past month, the value of the CC Index in terms of USD rose about 4%. This lifted the CC Index in dollar terms from levels near 108 cents/lb to those near 112 cents/lb.
► Cash prices for the Indian Shankar-6 variety were mostly flat over the past month. In international terms, values held to levels near 85 cents/lb. In domestic terms, values traded near 42,200 INR/candy.
► Pakistani prices decreased slightly in both international and domestic terms over the past month. In international terms, Pakistani spot rates fell from values near 75 cents/lb to those near 70 cents/lb. In domestic terms, prices rose from 6,450 to 6,100 PKR/maund.
Supply, demand, & trade
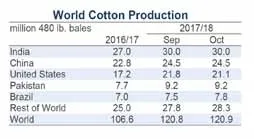
For the second straight month, the USDA report was dominated by a large upward revision to the U.S. production figure. Despite the arrival of two major hurricanes in recent weeks, this month’s update was a 1.2 million bale increase.The current projection of 21.8 million bales suggests the largest crop since 2006/06 and will rank 2017/18 as the third largest U.S. harvest on record (behind only 2004/05 and 2005/06, when production was 23.3 and 23.9 million bales).
Due to recent storms, the USDA’s estimate of abandoned acres increased(planted acres not harvested due to crop conditions). However, upward revisions to estimates for planted acreage (+560,000 acres, to 12.6 million) and yield far outweighed the negative influence on production. The national yield for upland cotton is forecast to set a new record this crop year (908 lb/harvested acres, up 16 lb/acre versus last month, up 41 lb/acre versus 2016/17, and up 34 lb/acre versus the previous record from 2012/13).
The larger U.S. crop implies more cotton will be available for sale from the world’s largest exporting country, and the forecast for U.S. exports increased 700,000 bales to 14.9 million. The current forecast for 2017/18 is essentially equal to the figure for 2016/17, which ranked as the second highest on record (only behind 2005/06, when U.S. exports were 17.7 million bales). The U.S. mill-use figure was flat relative to last month, so the bigger increase in supply relative to demand resulted in an increase to ending stocks(+200,000 bales, from 5.8 to 6.0 million bales). This increase is not as large as the 500,000 difference between the increase in production (1.2 million) and the increase in exports (700,000) because the USDA put 300,000 bales into their unaccounted category. This was likely done to leave room for later revisions, which could include the addition of this volume to ending stocks.
如图4C所示,在处理过程中,增温处理下美国薄荷叶片超氧自由基产生速率较对照呈先下降后上升的趋势。处理7 d时,增温处理下美国薄荷叶片的超氧自由基产生速率较对照下降了2.1%。而在处理 14 d时则较对照显著上升了 15.5%(P=0.038<0.05)。且第14天测定的薄荷叶片的O2-·产生速率均显著高于第7天,这说明后期的增温处理引起的活性氧毒害作用加强。
Outside of the U.S., there were several other notable upward revisions to production forecasts. Indian production was increased 1.0 million bales (from 29.0 to 30.0 million bales). Brazilian production was increased 500,000 bales (from 7.0 to 7.5 million). Mexican production was increased 230,000 bales (from 1.2 to 1.4 million). Australian production was increased 200,000 bales (from 4.8 to 5.0 million). Turkish production was increased 200,000 bales (from 3.6 to 3.8 million). There were no significant decreases to countrylevel production forecasts, and the global harvest estimate for 2017/18 rose 3.4 million bales (from 117.3 to 120.8 million). If realized, this represents the largest world harvest since 2012/13 and ranks as the fifth largest on record.


Meanwhile, the global mill-use figure was mostly unchanged at 117.5 million bales (+334,000 bales). At the country-level, the only notable revisions were for Brazil(+100,000, from 3.3 to 3.4 million) and Turkey (+100,000,from 6.6 to 6.7 million).
One consequence of the large increase in global harvest expectations relative to mill-use is that it shifted the world’s supply and demand relationship in the 2017/18 crop year from being one of relatively equal production and consumption to one of surplus production. Another consequence of the large increase in harvest expectations relative to mill-use is that global ending stocks are expected to rise even further(+2.4 million bales, from 90.1 to 92.5 million). An important additional point is that there were no major changes to Chinese figures, so all of the increase in stocks is projected to occur outside of China. This is relevant because the cotton in storage outside of China is available for trade and therefore is available to weigh on prices.
The current forecast for stocks for the world-less-China is 53.1 million bales. This is nearly 30% higher than the 41.2 million bales in storage at the end of the 2016/17 season (41.2 million) and nearly 20% higher than the previous record of 44.8 million set in the 2014/15 crop year (44.8 million). The stocks-to-use ratio for the world-less-China is now projected to exceed the previous record by more than ten percentage points (62.9% in 2017/18, 52.3% in 2014/15).
Price outlook
This month’s revisions changed the storyline for the 2017/18 crop year from being on relatively equal production and consumption to one of production surplus. While the two recent hurricanes highlight uncertainty that surrounds production forecasts until bales are harvested, ginned, and safely moved out of harm’s way, this month’s set of revisions highlights an old saying in the cotton market, and that is that big crops tend to get bigger. It remains to be seen what the full extent of storm-related damage might be, but the latest crop condition ratings are strong and yield prospects are favorable. This is true outside the U.S. as well. While late rains have affected planting and harvesting in India, there is also the potential for upward crop adjustments for that country. With mill-use forecasts already suggesting a relatively strong 4% increase in consumption there may be limited opportunity for increases on the demand side of the balance sheet. This suggests further increases in cotton production figures should imply further increases in stocks, and therefore further downward pressure on prices.
Recent price movement
After falling in the days surrounding the release of last month’s USDA report,NY futures and the A Index were mostly stable through the second half of September and into early October. The CC Index and Pakistani prices were stable over the past month. Indian prices declined.
► The A Index followed the same general pattern as NY futures. Values for the A Index decreased from levels near 85 cents/lb in early September to those near 79 cents/lb in the second half of the month and were generally unchanged through the first half of October.
► The China Cotton (CC) Index was stable in international terms over the past month, with values holding to levels near 110 cents/lb. In domestic terms, the CC Index increased slightly, climbing from 15,900 to 16,000 RMB/ton.
► Cash prices for the Indian Shankar-6 variety decreased over the past month. In international terms, values fell from 85 cents/lb to 75 cents/lb. In domestic terms, values fell from 42,200 to 38,800 INR/candy.
► Pakistani prices have been mostly stable in both international and domestic terms since early September. In international terms, Pakistani spot rates held to values near 69 cents/lb. In domestic terms, prices hovered around 6,000 PKR/maund.
Supply, demand, & trade
This month’s USDA report featured slight increases to global production and mill-use figures. The world harvest figure increased 112,000 bales, from 120.8 million 120.9 million bales. The world consumption forecast increased 262,000 bales, from 117.8 million to 118.0 million.
With world beginning stocks unchanged and the increase in mill-use greater than the increase in production,there was a marginal decrease in the forecast for global ending stocks (-156,000,from 92.5 to 92.4 million bales). Stocks outside of China are still expected to set a new record by relatively wide margin in 2017/18 (52.9 million), exceeding the previous record by 8.1 million bales or by nearly 20%. The stocks-to-use ratio for the world outside of China is also expected to set a record by a relatively wide margin (62.5% in 2017/18, previous record of 56.4% in 2008/09).
USDA reports for the past two months have been dominated by upward revisions to production figures for the U.S.Even though the magnitude of change this month (-643,000 bales, from 21.8 to 21.1 million) is smaller than the revisions in excess of one million bales made in each of the two previous months, this month’s change is nonetheless important for price direction because it addresses lingering questions related to hurricane damage.Last month’s report was issued in the immediate aftermath of both Harvey and Irma and there was limited ability to estimate storm damage. Over the past month,the USDA conducted field surveys in areas hit by the hurricanes and this month’s decrease to the U.S. production figure incorporates findings from that effort. Indications are that the storms caused damage in the form of yield loss (national yield lowered 3% from the record forecast in September) and a decrease in harvested acres (national harvested acres down 1%month-over-month, from 11.5 to 11.4 million).
Relative to the effect on U.S. ending stocks, the decrease in production was partially offset by a reduction to the export forecast (-400,000 bales, from 14.9 to 14.5 million). U.S. stocks are still expected to increase significantly in 2017/18, with the forecast suggesting warehoused supplies will more than double year-over-year, rising from 2.8 million bales at the end of the 2016/17 to 5.8 million bales at the end of 2017/18.
Outside the U.S., the largest countrylevel changes to production forecasts included those for Argentina (+350,000,from 0.7 to 1.1 million), Brazil (+300,000,from 7.5 to 7.8 million), and Greece(+100,000, from 1.1 to 1.2 million). There was only one notable change to country-level consumption forecasts, and that was for Vietnam (+250,000, from 6.0 to 6.2 million).

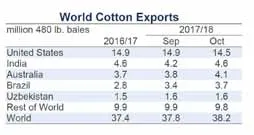
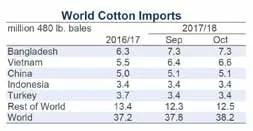
The global import forecast increased nearly 400,000 bales, from 37.8 to 38.2 million bales. This was a primarily result of upward revisions to India (+300,000, from 1.3 to 1.6 million) and Vietnam(+200,000, from 6.4 to 6.6 million) more than offsetting decreases for Mexico (-150,000, from 1.0 to 0.8 million). Beyond the U.S., the largest changes for exports included those for India (+400,000, from 4.2 to 4.6 million), Australia (+300,000, from 3.8 to 4.1 million), Brazil(+250,000, from 3.4 to 3.7 million), Argentina (+125,000, from 200,000 to 325,000), and Turkmenistan (-150,000, from 600,000 to 450,000).
Price outlook
For price direction, there has been a push-and-pull dynamic resulting from the U.S. production outlook. On one side has been fear related to storm damage and uncertainty involving cotton that has yet to be harvested. On the other side, there is this year’s 20% increase in planted acreage and generally good growing conditions outside areas impacted by hurricanes.
As more acres are harvested in the U.S. and in other exporting countries, it could be expected that the market’s attention may shift towards the large volume of cotton to be collected. Even though the production forecast was lowered in this month, this year’s U.S. harvest currently ranks as the fifth biggest of all-time. India is projected to collect its second largest harvest on record, and so is Australia. Every one of the world’s major cotton growing countries increased cotton acreage in 2017/18, and every one of the world’s major exporting countries are expected to have an increase in ending stocks this crop year.
Exporters will increasingly be looking to move supplies as harvests come in, and the corresponding competition for sales in import markets could be expected to weigh on prices. There is a possibility that China could absorb some of this additional supply by increasing imports. However, even after factoring in another round of auctions next spring/summer, the USDA still expects China to have enough stocks at the end of the 2017/18 to result in a stocks-to-use ratio over 100%. With so much supply at home, uncertainty surrounds the question whether China will increase imports.
猜你喜欢
杂志排行

China Textile的其它文章
- Technology is the best footnote to change life
- Intertextile Shanghai Apparel Fabrics: In-depth leading to create extraordinary
- A new decade to power glory of fashion knitting
- New materials,New momentum &New trends
- To explore the great courses of Beijing Fashion Industry 2017 Beijing Fashion Summit
- Snow Lotus performed first show to highlight cultural self-confidence of domestic brands