The effects of step inclination and air injection on the water flow in a stepped spillway: A numerical study*
2017-04-26KhadidjaKherbacheXavierChesneauBelkacemZeghmatiStphaneAbideSadiaBenmamar
Khadidja Kherbache, Xavier Chesneau, Belkacem Zeghmati, Stéphane Abide, Saâdia Benmamar
1.Université de Perpignan Via Domitia (UPVD), LAboratoire de Mathématiques et de PhySique (LAMPS) EA4217, F-66860, Perpignan, France
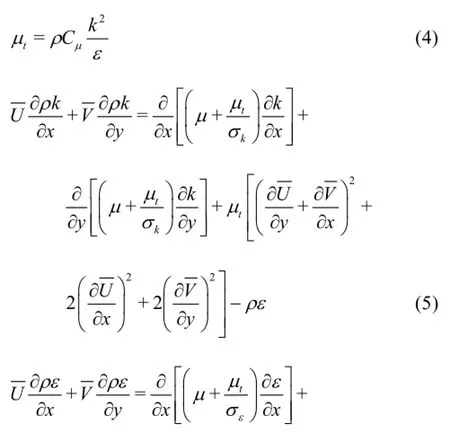
2.Ecole Nationale Polytechnique, Laboratoire de Recherche des Sciences de l’eau, 10 Avenue Hassen Badi, 16000 Alger, Algérie, E-mail: kherbache_khadidja@yahoo.fr
The effects of step inclination and air injection on the water flow in a stepped spillway: A numerical study*
Khadidja Kherbache1,2, Xavier Chesneau1, Belkacem Zeghmati1, Stéphane Abide1, Saâdia Benmamar2
1.Université de Perpignan Via Domitia (UPVD), LAboratoire de Mathématiques et de PhySique (LAMPS) EA4217, F-66860, Perpignan, France
2.Ecole Nationale Polytechnique, Laboratoire de Recherche des Sciences de l’eau, 10 Avenue Hassen Badi, 16000 Alger, Algérie, E-mail: kherbache_khadidja@yahoo.fr
In this work, we perform a numerical study of a water flow over a stepped spillway. This flow is described by the Reynolds averaged Navier-Stokes equation (RANS) associated with the turbulencemodel. These equations are solved using a commercial software based on the finite volume scheme and an unstructured mesh. The air-water flow was modeled using volume of fluid (VOF) and multiphasic methods. The characteristics of the flow were investigated including the total pressure, the velocity profile, etc.. We analyze the effects on the flow structure of the steps and countermarch inclination, the air injection through the countermarch into the water flow and the dynamics water discharges. Results show that the inclination of the countermarch relative to the vertical and the air injection into the water flow increase the total pressure in the neighbourhood of the steps.
Stepped spillway, turbulence, air-water, air injection, volume of fluid (VOF) method, multiphasic method
Introduction
Water flow over spillway has been extensively studied because of its relevance in engineering problems such as in storage and detention dams. In a dam spillway, the water flow velocity reaches very high values causing the cavitation erosion of the spillway walls. Studies of water flows over a stepped spillway are very complex because these flows involve a number of phenomena such as air entrainment, cavitation, turbulent boundary layer, free surface flow and complex geometry[1]. In the following, we attempt to report some experimental and numerical studies on water flow along stepped spillway. Based on experimental works, Sánchez-Juny[2]showed the existence of four different zones inside which the flow occurs. In the first zone, immediately downstream of the crest of the spillway, the water is clear and without aeration process. In the second zone, adjacent to the preceding one, the water is clear and described by a typical U-shape and an aeration process occurs, starting from the edges of the channel. In the third area, the aeration process begins where the water is foamy and white. In the fourth zone, the flow is completely aerated and the white water phenomenon appears. In order to analyze the influence of the size of the countermarch on the flow structure, the air concentration and the rate of energy dissipation, Felder and Chanson[3,4]conducted a study on five stepped spillway configurations, two with countermarch of the same size and three with countermarch of different sizes. The results show that for low flow rates, the air concentration in the flow is, in the case of the configuration with countermarch of different sizes, superior to the one with the configuration for which the countermarch has the same size. For the stepped spillway with countermarchs of different sizes, the air concentration is superior to all those of other configurations. Moreover, the rate of energy dissipation does not really depend on the stepped spillway configuration considered in this study. Therefore, increasing the number of steps of the same size leads to a decreasing of the energy dissipation of the flow. It will be noted that in the case of the stepped spillway configuration for which steps have the same size, regardless of the flow regime, the rate of energy dissipation and the airconcentration decreases as the discharge increases. The increase in the number of steps generates an increase in water thickness in the stilling basin and a reduction in the length of hydraulic jump[5]. For instance, for a stepped spillway made up of 32 steps, the water thickness in the stilling basin increased by 71% and the value of the length of hydraulic jump is reduced by 64% compared with a conventional spillway.
Numerous experimental studies based on the similarity of Froudeand Mortonnumbers were performed to analyze the scale effect on the twophase air water flows. These studies highlighted that the choice of the criteria to assess scale effects is critical because some parameters such as void fraction, turbulence intensity, or bubble size, are likely to be most affected by scale effects, even in relatively large laboratory models[6]. Based upon a literature review[7], Pfister and Chanson[6]have highlighted that the relevant scaling parameter of an air water flow is the air concentration, while the non-dimensional numbersFr,, and some limiting values oforreduce scale effects. No scale effect has been observed by these authors at full scale only, using the same fluids in prototype and model.
Numerical simulations of air-water flowing on stepped spillway were performed using the Reynolds Averaged Navier-Stokes equations (RANS)[1,8-12]or the Saint Venant equations[13]coupled with turbulent models such as standardReynolds stress[10,16], realizableand LES[9]. These equations are very difficult to solve, so various works on this flow type were carried out by using a commercial code such as Fluent[8], or Flow-3D[10,11]and others. These software are based on the finite volume method, the volume of fluid (VOF) method[9,15], Tru VOF[10,17]or the mixture model[8,9]. Numerical studies showed that the skimming flow regime[1,8,9,12]is divided into a main flow described by a uniform stream over the outer edges of the steps[1,8,9]and a secondary flow characterized by eddies located in the space defined by the main flow, the step and the countermarch. For instance, a discharge value equal to 0.03 m3/s, leads to negative pressure on the edges of the steps[8]. This negative pressure causes the cavitation phenomenon and consequently the deterioration of the stepped spillways. Qian et al.[9]analyzed the influence of four turbulence models: realizableand LES on the mean velocity of the water flow. The results are compared with those obtained by PVC. The turbulence modelunderestimates the mean velocity value of the iso-velocity cells, while the mean velocity values obtained by the realizableSST models are superior to those measured by the PIV system. The LES model leads to results different from the experimental results. Bombardelli et al.[11]simulated a non-aerated flow over a stepped spillway using theand RNGturbulence models combined with the Tru VOF method. Results of velocity field and water flow thickness obtained with these two turbulence models are close. Numerous studies[18-21]on water flows over stepped spillway showed that flows over stepped spillways can be classified into three regimes depending on the discharge value and the step geometry: nappe flow regime, observed for small discharge values, characterized by a succession of overfalls jumping from one step to another. The increase in the discharge value generates the development of eddies located in the space delimited by the main flow, the step and the countermarch. Between this type of skimming flow and the nappe flow regime, there exists a range of discharge values for which the flow is characterized by a significant aeration, splashing, and chaotic appearance and the flow properties vary from step to step.
Wei et al.[22]developed a diffusion model to predict the air concentration distribution in the self-aerated open channel flows. The air-water flow is regarded as consisting of the low flow region, where the air concentration is lower than 0.5 and the upper flow region, where the air concentration is higher than 0.5. They noted two different diffusion processes: one in which the air bubble diffuses in the water flow by turbulent transport fluctuations in the low flow region, in the other process the water droplets and free surface roughness diffuse in the air in the upper region.
In water flowing along a stepped spillway, the air quantity entrained by the flow and the air bubbles in the water flow contribute to the reduction of cavitation erosion. The air entrainment causes a reduction of the shear stresses in the fluid and on the wall of the spillway. Dong and Lee[23]indicated that friction factor in a stepped channel flow is considerably greater than that in a smooth channel flow. Moreover, the energy dissipated in the flow over a stepped spillway is superior to the one in a flow on a smooth spillway. Chen et al.[24]carried out a study in order to analyze the influence of the dam slop and of the ogee at the spillway toe on the energy dissipation rate. They showed that the energy dissipation rate increases as the dam slope decreases. In addition, the energy dissipation ratio of the stepped spillway without ogee is much greater compared with that of the stepped spillway with ogee. So, the ogee can improve the energy dissipation rate and consequently contribute to the reduction of the cavitation phenomenon. Many studies[18,21], mainly experimental, have shown that the resistance on the walls of spillway can be reduced by using, for example, special concrete or by air injection into the water flow.
Although the study of flowing water on stepped spillways have been the subject of various studies, itappears, to our knowledge, that the effect of the inclination of the steps, the countermarchs and the injection of air into the water flow on the characteristics of the flow have not been studied. The aim of this paper is to perform a numerical study of water flowing over a stepped spillway. The RANS associated with the turbulencemodel were solved using the software Fluent. The air-water two-phase flow was modeled using VOF and multiphasic models. We analyzed the effects of the dynamic water discharge, the inclination of the steps and the air injection into the flow on the main characteristic parameters of the flow.
1. The physical model and mathematical formulation
1.1The physical model
The physical model is a stepped spillway inclined to the horizontal by an angle ofand made up of 13 steps (Fig.1). The spillway crest shape is identical to that of a standard waterways experiment station (WES). This spillway is linked to the vertical wall of an approach channel (0.25 m×0.827 m) by a rounded corner of three radii equal respectively to 0.0485 m, 0.0194 m and 0.00388 m. The five steps counted from the spillway crest have different sizes ((0.015 m× 0.02 m), (0.018 m×0.024 m), (0.0225 m×0.03 m), (0.03 m×0.04 m), and (0.0375 m×0.05 m)), the other steps have the same size (0.045×0.06 m). An ogee of radius 0.28 m ensures the connection between the bottom of the spillway and a horizontal channel with the length of 0.20 m.

Fig.1 Scheme of the physical model
1.2Hypothesis
(1) The transfers are two-dimensional and permanent.
(2) The physical properties of the air-water fluids are constant.
(3) The fluid is incompressible.
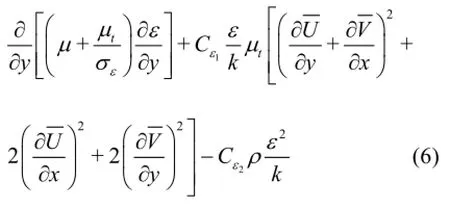
1.3Governing equations
The water flow equations over the stepped spillway presented above are expressed by the RANS.
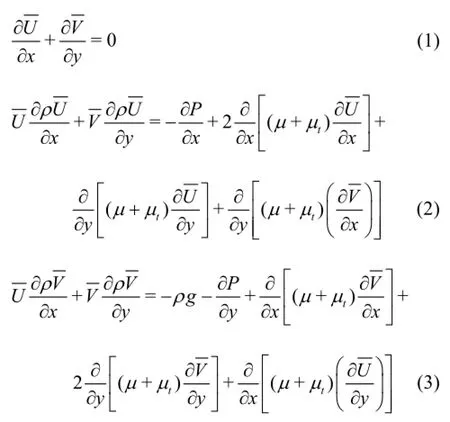
We simulated this flow by the VOF and the multiphasic methods. We use first, the VOF method for the analysis the effects of the inclination of the steps on the flow and then, the multiphasic method to determine the effect of the injection of air into the water flow on the main characteristic parameters of the flow. The VOF method is based on a volume fractionF[25]:
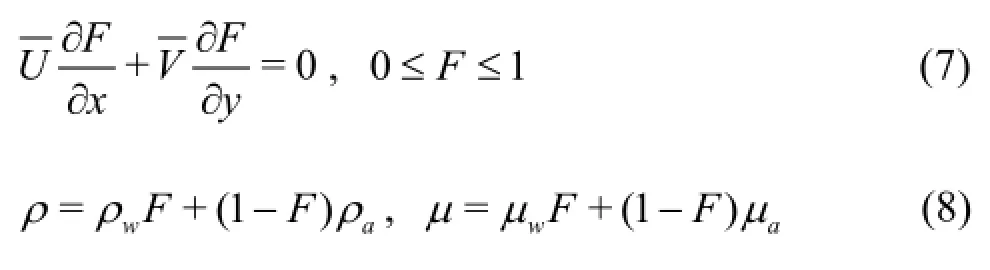
The multiphasic model is based on the volume fraction equation[25]:

1.4Boundary conditions
Inlet boundary
Water-air interface

Wall boundary conditions
2. Computational domain and meshing
The computational domain includes the entire spillway (the stepped spillway, the approach channel and the horizontal channel). The Eqs.(1)-(6) were discretized using an implicit scheme based on the finite volume method. The pressure implicit with splitting of operator (PISO) algorithm was applied to link the pressure and the velocity fields. The equations were solved using the software Fluent. An unstructured mesh consisting of two-dimensional quadrilateral cells (65 396 cells and 66 885 nodes) made by Gambit was implemented to fit the complex domain. Non uniform mesh was employed. The space stepsare equal to 0.0015 m in the vicinity of the wall of the entire spillway, then varie between 0.003 and 0.004 in the entire domain.

Table 1 Effect of the mesh size on the maximum velocity
3. The grid independence study
Mesh dependency tests have been conducted to ensure the accuracy of solutions. For this purpose, six different non uniform mesh 50 540, 55 674, 61 700, 66 885, 102 800 and 245 347 are employed for the numerical simulation. The results for maximum velocity value are presented in Table 1. It is observed that a refinement of the grid from 66 885 to 245 347 does not have a significant effect on the results in terms of the maximum velocity and the difference between the maximum velocities of these two grids is found to be less than 2.5%. Considering both the accuracy and the computational time the grid 66885 were adopted for the following calculations.
4. Validation
We will apply the software to a problem dealtwith in the literature[1], whose subject is nearest to that of this work[1]. Computations were performed for a stepped spillway where the dynamic height is equal to 0.097 m corresponding to a dynamic water discharge of 6.8×10⁻²m2/s. We plotted in the Fig.2, the evolution of the water thickness along the spillway computed by the software used in this study and the one reported by Chen et al.[1]. An analyze of the Fig.2 shows that the water thickness along the spillway is in good agreement with the one reported in Ref.[1]. As can be seen in Figs.3 and 4 our results concerning the velocity distribution in the vicinity of the step 5 and the static pressure distribution are in good agreement with those of Chen et al.[1]. It will be noted that for the static pressure the maximum discrepancies between ours results and those of Chen et al.[1], located at0.033 m of the step (Fig.4) is about 16%.
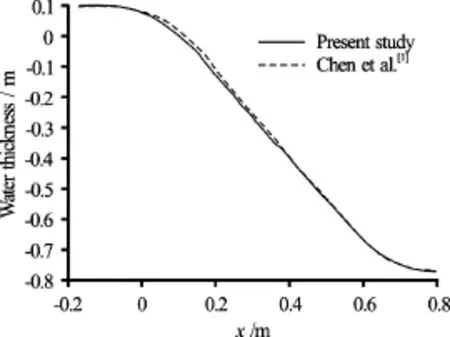
Fig.2 Evolution of the water thickness along the spillway

Fig.3 (Color online) Evolution of the velocity vectors (m/s) in the vicinity of the step 7
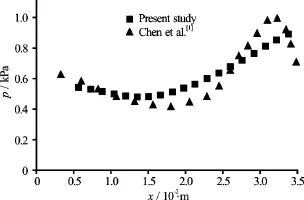
Fig.4 Evolution of the static pressures in the vicinity of the step 5
5. Results and discussion
Computations were performed for a dynamic height equal to 9.7×10⁻²m corresponding to a dynamic water discharge equal to 6.8×10⁻²m2/s in order to analyze the flow structure and the effects of the steps inclination and the air injection into the water flow on the pressure field[26].
The flow over the stepped spillway is composed of a main flow and a secondary flow (Fig.5). The water flowing from one step to the next can be described by a jet impacting a plane wall. This result is in agreement with the one reported by Chen et al.[1]and Cheng et al.[8]. We observe that the main flow is developed between the air-water interface and a plane adjacent to the step edges. The flow velocity increases along the stepped spillway. This increase is induced by the effects of the gravity and the conversion of the water potential energy into kinetic energy. The secondary flow is due to the effect of the step walls on the main flow. It is described by eddies located in the zone delimited by the main flow, the step and the countermarch.
The pressure field in the secondary flow consists of two cells: one located in the vicinity of the step and the other in the neighbourhood of the countermarch (Fig.6). This result is in agreement with the one reported by Cheng et al.[8]. We note that the pressure in the main flow is superior to the one in the secondary flow. The maximum pressure is found in the center of the pressure cell located along the step, the minimum pressure values are found in the center of the pressure cell near the countermarch. This pressure reaches negative values on the countermarch. The higher pressure values are in the area of impact of the water flow on the step and in the boundary between the main flow and the secondary flow.
In order to analyze the influence of the dynamic water discharge on the pressure, we carried out calculations for three dynamic heights: 0.097 m, 0.07 m and 0.04 m corresponding to three dynamic water discharges respectively equal to 6.8×10⁻²m2/s, 2.9×10⁻²m2/s and 0.6×10⁻²m2/s. The pressure pattern in the flow, are the same as the one described previously[26]. We note that the increase of the water discharge from 0.6×10⁻²m2/s to 6.8×10⁻²m2/s leads to an increase in the maximum value of the total pressure from 7.81×10²Pa to 1.99×10³Pa and a reduction of the minimum value of the pressure from −3.19×10²Pa to−4.93×10²Pa (Table 2). These negative pressures can provoke an erosion of the wall by the cavitation phenomenon. In order to avoid the negative pressure in the vicinity of the walls of the spillway, we analyze first the influence of the inclination of the step and of the countermarch then the air injection into the water flow on the structure of the flow and the main parameters of the flow.
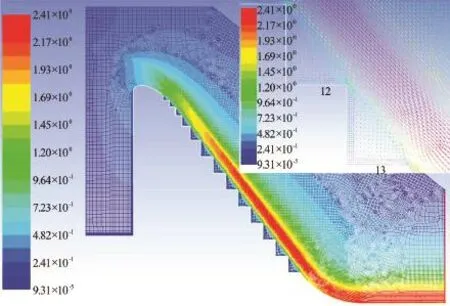
Fig.5 (Color online) Evolution of the velocity vectors along the spillway (m/s).
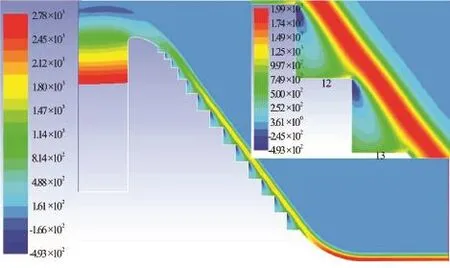
Fig.6 (Color online) Evolution of the pressure field along the spillway (Pa).
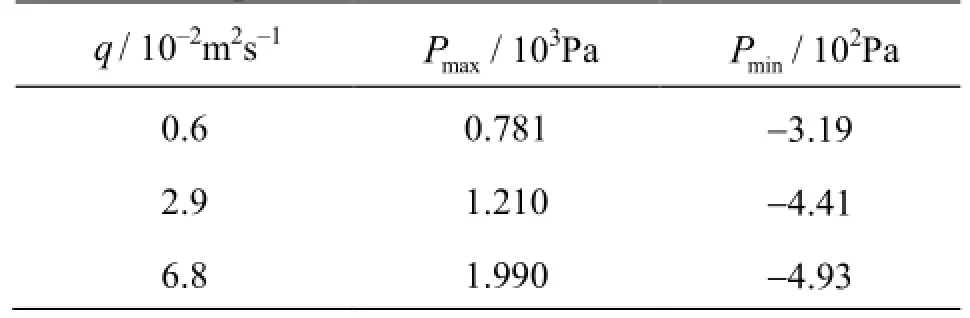
Table 2 Influence of the dynamic water discharge on the total pressure
5.1The influence of the inclination of the step and the
countermarch
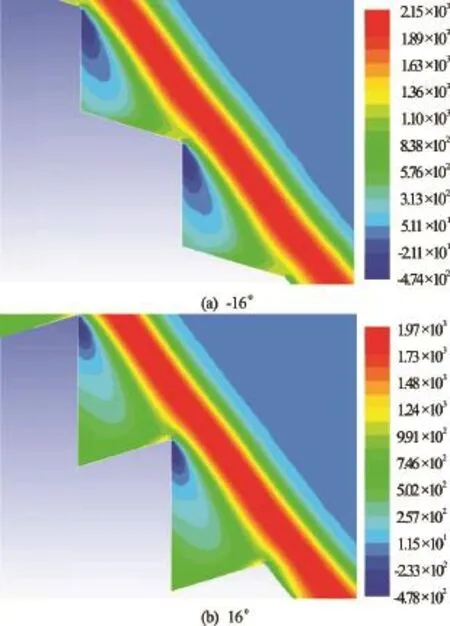
Fig.7 (Color online) Distribution of the total pressures in the vicinity of the steps 12 and 13. Influence of the inclination of the step.
Twelve configurations have been considered[26]. Four configurations are defined by the inclination of the step to the horizontal. The inclination angle is varying fromFour configurations are above the countermarch inclination to the verticalThe other configurations have been obtained by a combination of those mentioned above. To simplify the redaction, in the following: we use“negative in- clination” to note the configuration for which the in- clination angle of the step to the horizontal is negative, and “positive inclination” to note the configuration for which the angle to the horizontal is positive. We use the same denominations for the configurations chara- cterized by the inclination of the countermarch to the vertical. In the case of the inclination of the step, we note those for “the positive inclination”the total pressure is weakly modified (Figs.6 and 7(b)). The pressure is superior to the one obtained in the case of horizontal steps (Figs.6 and 7(a)) for the “negative inclination”. In the case of the inclination of the countermarch, the increase of the countermarch angle fromin the “positive inclination” causes a decrease of the pressure values from −4.93×10²Pa to−8.71×10²Pa (Figs.6 and 8(a)). The increase of the inclination angle in the “negative inclination” of the countermarch fromprovokes an increase of the pressure of −4.93×10²Pa to −2.61×10²Pa (Figs.6 and 8(b)). The effect of the inclination angle of the step on the pressure is less important than the one obtained for a vertical countermarch (Table 3). The variations of the inclination of the countermarch increase the total pressure for the “positive and negativeinclination”. In conclusion, the negative values of pressure in the vicinity of the step wall can be avoided by using a higher inclination angle of the countermarch to the vertical in the “negative inclination” case. In the case of a spillway made up of steps and countermarchs inclined respectively to the horizontal and to the vertical, the flow parameters and the pressure are similar to those obtained for a stepped spillway with inclined steps and vertical countermarchs or inclined countermarchs and horizontal steps (Fig.9).
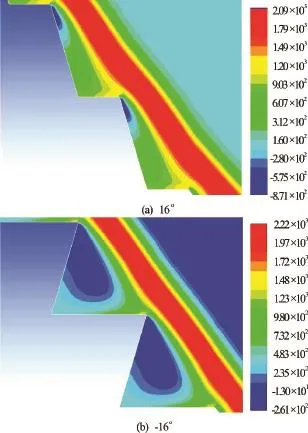
Fig.8 (Color online) Distribution of the total pressures in the vicinity of the steps 12 and 13. Influence of the inclination of the countermarch.

Fig.9 (Color online) Distribution of the total pressures in the vicinity of the steps 12 and 13. Influence of the inclination of the step and the countermarch.
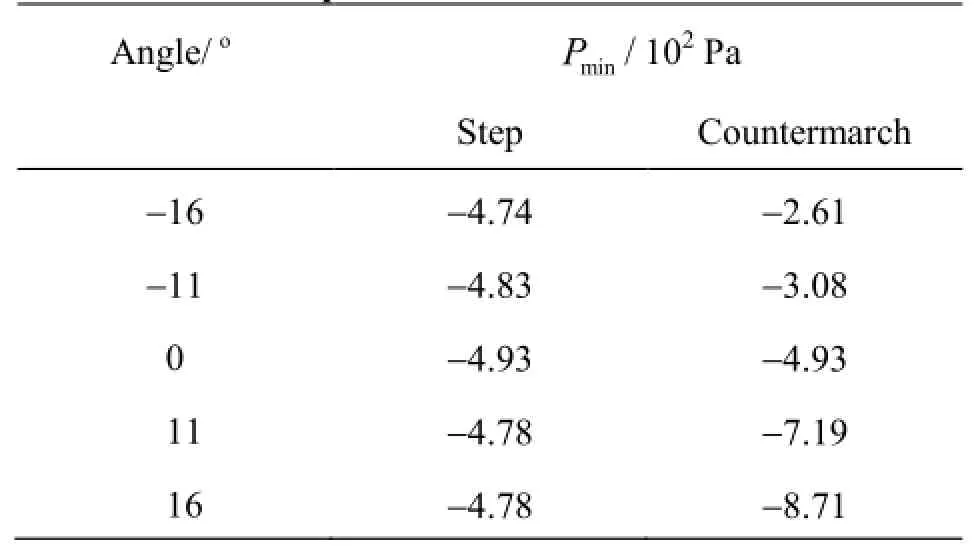
Table 3 Influence of the step and the countermarch inclination on the pressure
5.2The influence of the air injection
We considered two positions of air injection in the water flow: (P1) and (P2) located on the countermarch respectively at 0.009 m and 0.051 m from the bottom of the step[26]. Results show that the water flow parameters are not depending on the air injection rate for air flow rate values inferior to 0.45×10⁻³m2/s. Consequently, we carried out calculations for two values of air flow rate: 0.72×10⁻³m2/s and 1.35× 10⁻³m2/s. We note that the minimum value of the pressure is equal to −2.96×10²Pa without the air injection (Table 4).

Table 4 Influence of the air injection position and the rate of the air injection on the total pressure
The air injection position on the countermarch does not significantly influence the structure of the main flow such as those of the total pressure (Fig.10). Moreover, the values of the flow parameters such as the pressure increase as the air flow rate injected into the water increase. For instance, when the air injection is through P1 and P2, the total pressure in the flow is superior to the one obtained without air injection (Table 4). A comparative study of the total pressure values in the case of the P1 and P2 air injection positions shows that the largest increase of the total pressure is obtained when air is injected through the P2 position (Figs.10(a) and 10(b)). For example, for an air flow rate of 1.35×10⁻³m2/s injected through the P1 position, the minimum pressure value is equal to−1.06×10²Pa. In the case of the P2 position, the pressure is equal to -1.98×10²Pa. These values increaseto −0.92×10²Pa when the air is injected simultaneously through the P1 and P2 positions. We note that the air injection into the water flow through the P1 position leads to an increase of the pressure in the water flow notably in the vicinity of the wall of the spillway contributing to reduction of the cavitation phenomenon (Table 4). For the air injection position P1, the minimum value of the total pressure increases from -1.86× 10²Pa to −1.06×10²Pa for an air flow rate equal respectively to 0.72×10⁻³m2/s and 1.35×10⁻³m2/s. In the P2 position, the total pressure reached −1.98× 10²Pa for an air flow rate equal to 1.35×10⁻³m2/s. Results presented above show that the position of the air injection has stronger influence than the air flow rate of air injection.
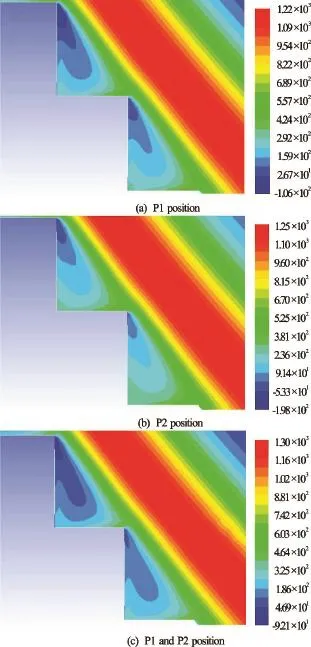
Fig.10 (Color online) Distribution of the total pressures in the vicinity of the steps 12 and 13. Influence of the air injection flow rate and the injection position:
6. Conclusions
We simulated water flowing over a stepped spillway using the standardmodel associated, on the one hand, with the VOF method in order to analyze the effects of the step inclination on the flow structure and, on the other hand with the multiphasic method for the case of the air injection into water flow. Computation was performed with the software Fluent. The water flow along the stepped spillway includes, on the one hand, a main flow in the zone delimited by the water-air interface and a tangent plane to the steps edge and on the other hand, a secondary flow located in the vicinity of the step corner. The inclinations of the countermarch and the step respectively to the vertical and to the horizontal, the flow rate of air injection into the water flow and the injection position located on the countermarch influence significantly the flow structure, notably the pressure pattern and its values. From this work it can be concluded:
The inclination of the countermarch (positive or negative) provokes an increase in the pressure values in the flow.
The inclination of the countermarch provokes for positive values of the inclination angle a decrease of the minimum pressure.
The total pressure increases in the water flow with the air flow rate injected through the P1 position.
Acknowledgments
The authors thank the ERASMUS MUNDUS AVERROES Program, for the financial support off this study.
[1] Chen Q., Dai G., Liu H. Volume of fluid model for turbulence numerical simulation of stepped spillway overflow [J].Journal of Hydraulic Engineering, ASCE, 2002, 128(7): 683-688.
[2] Sánchez-Juny M. Hydraulic behavior of stepped spillway in compacted concrete dams. Analysis of the pressure field [D]. Doctoral Thesis, Barcelona, Spain: Universitat Politècnica de Catalunya, 2001(in Spainish).
[3] Felder S., Chanson H. Energy dissipation down a stepped spillway with non-uniform step heights [J].Journal of Hydraulic Engineering, ASCE, 2011, 137(11): 1543-1548.
[4] Felder S., Chanson H. Energy dissipation and air entrainment on stepped spillway with Non-uniform cavity sizes [C].34th IAHR world congress-Balance and uncertainty, 33rd Hydrology et water resources symposium, 10th Hydraulics conference. Brisbane, Australia, 2011, 2412-2419.
[5] Dermawan V., Anwar N. Hydraulic model of flow conditions on stepped spillway due to number of steps [J].International Journal of Academic Research, 2010, 2(5): 200-205.
[6] Pfister M., Chanson H. Two-phase air-water flows: Scale effects in physical modeling [J].Journal of Hydrodynamics, 2014, 26(2): 291-298.
[7] Pfister M., Hager W. H. History and significance of the Morton number in hydraulic engineering [J].Journal of Hydraulic Engineering, ASCE, 2014, 140(2): 02514001.
[8] Cheng X. J., Cheng Y. C., Luo L. Numerical simulation of air-water two-phase flow over stepped spillways [J].Science in China Series E: Technological Sciences, 2016, 49(6): 674-684.
[9] Qian Z. D., Hu X. Q., Huai W. X. et al. Numerical simulation and analysis of water flow over stepped spillways [J].Science in China Series E: Technological Sciences, 2009, 52(7): 1958-1965.
[10] Meireles I., Bombardelli F., Matos J. Experimental testing and numerical simulation of the non-aerated skimming flow over steeply sloping stepped spillways [C].33rd IAHR Congress. Vancouver, Canada, 2009, 1972-1979.
[11] Bombardelli F. A., Meireles I., Matos J. Laboratory measurements and multi-block numerical simulations of the mean flow and turbulence in the non-aerated skimming flow region of steep stepped spillways [J].Environmental Fluid Mechanics, 2011, 11(3): 263-288.
[12] Chinnarasri C., Kositgittiwong D., Julien P. Model of flow over spillways by computational fluid dynamics [J].Proceedings of the Institute of Civil Engineers-Water Management, 2014, 167(3): 164-175.
[13] Sabbagh-Yazdi S. R., Safahieh R., Mastorakis N. E. Postprocessing of air entrainment on nasir flow solver results for skimming flow over stepped chutes [C].9th WSEAS International Conference on Automatic Control, Modeling and Simulation (ACMOSʼ07). Istanbul, Turkey, 2007.
[14] Ahadian J., Aghamajidi R. Investigation of geometric effect of steps on energy dissipation on stepped spillway [J].Applied mathematics in Engineering, Management and Technology, 2014, 2(2): 491-503.
[15] Chen Q., Dai G. Q., Zhu F. Q. et al. Three-dimensional turbulence numerical simulation of a stepped spillway overflow [J].Journal of Hydrodynamics, Ser. B, 2002, 14(3): 70-75.
[16] Chen Q., Dai G. Q., Liu H. Numerical simulation for the stepped spillway overflow with turbulence model [J].Journal of Hydrodynamics, Ser. B, 2002, 14(2): 58-63.
[17] Fratino U., Amador A., Valenzano B. et al. Air inception and pressure fields over a stepped spillway in transition flow regime [C].XXX IAHR Congress, AUTh. Thessaloniki, Greece, 2003, 711-718.
[18] Chanson H. Hydraulic design of stepped spillways and downstream energy dissipaters [J].Dam Engineering, 2001,11(4): 205-242.
[19] Amador A., Sánchez-Juny M., Dolz J. Characterization of the non-aerated flow region in a stepped spillway by PIV [J].Journal of Fluids Engineering, 2006, 128(6): 1266-1273.
[20] Bung Daniel B. Developing flow in skimming flow regime on embankment stepped spillways [J].Journal of Hydraulic Research, 2011, 49(5): 639-648.
[21] Guenther F., Felder S., Chanson H. Flow aeration, cavity processes and energy dissipation on flat and pooled stepped spillways for embankments [J].Environmental Fluid Mechanics, 2013, 13(5): 503-525.
[22] Wei W. R., Deng J., Zhang F. X. et al. A numerical model for air concentration distribution in self-aerated open channel flows [J].Journal of Hydrodynamics, 2015, 27(3): 394-402.
[23] Dong Z. Y., Lee J. H. W. Numerical simulation of skimming flow over mild stepped channel [J].Journal of Hydrodynamics, Ser. B,2006, 18(3): 367-371.
[24] Chen Q., Dai G. Q., Zhu F. Q. Influencing factors for the energy dissipation ratio of stepped spillways [J].Journal of Hydrodynamics, Ser. B, 2005, 17(1): 50-57.
[25] Eghbalzadeh A., Javan M. Comparaison of mixture and VOF model for numerical simulation of air entrainment in skimming flow over stepped spillwas [J].Procedia Engineering, 2012, 28: 657-660.
[26] Kherbache K. Contribution to the study of water flow on a stepped spillway [D]. Doctoral Thesis, Perpignan, France: Université de Perpignan Via Domitia, 2014(in France).
(Received April 10, 2015, Revised May 11, 2016)
* Biography: Khadidja Kherbache (1979-), Female, Ph. D.
杂志排行

水动力学研究与进展 B辑的其它文章
- Magnetohydrodynamic flows tuning in a conduit with multiple channels under a magnetic field applied perpendicular to the plane of flow*
- Modelling of wave transmission through a pneumatic breakwater*
- Comparison of blood rheological models in patient specific cardiovascular system simulations*
- The best hydraulic section of horizontal-bottomed parabolic channel section*
- Numerical simulation of hydrodynamic performance of blade position-variable hydraulic turbine*
- Efficient suction control of unsteadiness of turbulent wing-plate junction flows*