A Wind Speed Time Series Simulation Method and Its Application in Reliability Assessment of Generating Systems
2016-12-28SUNYuntaoWANGJunZHAOBinchaoSHIFangfang
SUN Yuntao,WANG Jun,ZHAO Binchao,SHI Fangfang
(State Grid Shandong Electric Power Research Institute,Jinan 250003,China)
A Wind Speed Time Series Simulation Method and Its Application in Reliability Assessment of Generating Systems
SUN Yuntao,WANG Jun,ZHAO Binchao,SHI Fangfang
(State Grid Shandong Electric Power Research Institute,Jinan 250003,China)
Simulating wind speed data has important implications in wind studies.A methodology to generate wind speed time series is provided based on polynomial normal transformation(PNT)and continuous state Markov chain(CSMC).The method firstly transforms the historical data into normal-followed data using PNT,next describes the stochastic process of the transformed data using the CSMC,and finally obtains the simulated wind speed series by performing the back-transformation of synthetic time series into the initial domain.Case studies are used to illustrate the capabilities of the proposed method.The results prove that the method can offer satisfactory fit for both probability distribution and temporal dependence.Case studies on a standard IEEE reliability test system(IEEE-RTS)have verified the applicability and effectiveness of the proposed model in evaluating the reliability performance of wind farms.
wind speed simulation;continuous state Markov chain;polynomial normal transformation;reliability evaluation
0 Introduction
Wind energy has been the fastest growing alternative energy sources in the last years due to its non-exhaustive and environmentally friendly nature.Its largescale integration brings unwanted consequences on power system operation and planning[1-5],mainly because of the stochastic character of wind speed.Analyzing these impacts usually requires a probabilistic approach usually relying on sequential Monte Carlo simulations which takes into consideration both the probability distribution and chronological characteristics of wind power generation,load profiles,and transition states of all the components.However,this method usually requires a large number of simulations toobtainthestatisticallyreliableresults.Thus,stochastic models for simulating or forecasting time series of wind speed are needed.
Two basic methodologies for the long-term generation of time series can be found in[6-13]:the classical time series analysis(CTSC)[6-7]e.g.AR,ARMA,etc,and Markov Chain Monte Carlo(MCMC)techniques[8-13].The CTSC is commonly used due to the relatively small number of parameters.The simulated data can match the autocorrelation function of historical data.However,this does not hold for thepdf and can result in wrong estimate of the energy production,and consequently,in wrong calculation of reliability benefits and equipment capacity[8].MCMC is a simulation method based on discrete state Markov Chain,which applies a discrete transition matrix to characterize the mutual transitions between different wind speed states and can reproduce the probability density function(pdf)and autocorrelation function(acf)of historical data.However,there is a dilemma between model accuracy and complexity which limits the application of this method.
To overcome the drawbacks of MCMC,a novel wind speed model and Monte Carlo simulation technique is proposed.The model replaces the discrete transition matrix with continuous transition kernel by using continuous state markov chain(CSMC)and construct CSMC of wind speed data in normal domain by applying polynomial normal transformation.
1 MCMC for Wind Speed Simulation
1.1 Discrete state Markov Chain model for wind speed
Denote Vta stochastic process of wind time series with n discrete states,a kth-order discrete state Markov Chain model can be expressed as[14]:
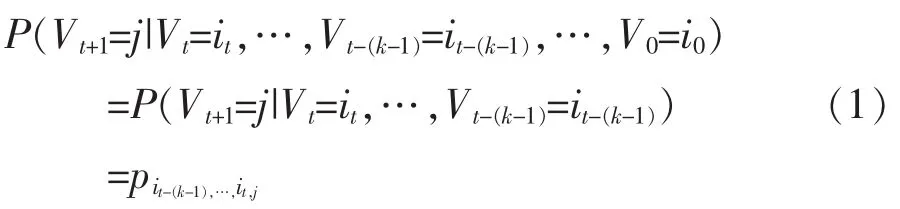
According to(1),it can be found that the state of next time is only dependent on the states of k previous time.
Since these probabilities are constant in time and divided by equal time steps,it is possible to formulate the transition probability matrix P with size of n×nk. The P for a first-order discrete state Markov Chain can be expressed as follows:
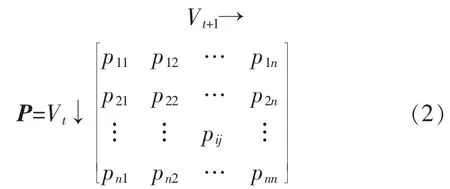
The rows of the matrix sum up to 1,and each element can be estimated by[14]:

where nijis the number of transitions from i to j encounter in the time series.
It can be seen from P that a high number of parameters(n×nk)must be estimated for the kth-order MCMC,which limits the application of the model.
1.2 MCMC simulation
Sampling based on a given transition probability matrix is performed by first constructing the cumulative probability transition matrix Pcumfrom the relation:

Each row of Pcumcorresponds to the discrete cumulative distribution function(cdf)for the next transition.The simulation starts with arbitrarily assumed initial state,i.e.initial state i.In order to sample the next transition,a uniform random number W is used. The realization w of this random number is compared with elements of the ith row of the matrix;if it falls between the elements k-1 and k,the state k is chosen as the next state.Further,the same procedure is repeated in order to sample based on the cdf Fk.
In case of a k-order Markov chain,the simulation procedure is analogous,but there are k initial states assumed and the row index is defined by the current and preceding states.
The application of MCMC involves the discretization of the stochastic process into a number of states and the calculation of probability matrix.However,there exists a tradeoff between state number and accuracy;that is a higher number of states lead to a better representation of the process but also make the model complex.
2 ContinuousStateMarkovChainfor Wind Speed
2.1 Introduction of continuous state Markov chain
Denote Vta stochastic process of wind time series with n continuous states,a kth-order CSMC model can be expressed as[14]:

where k(xt-(k-1),…,xt,z)is the state transition kernel(STK),and equivalent to the conditional probability density of Xt+1under the conditions that the states of k previous time is xt-(k-1),…,xt.STK is the basic measure of CSMC.The statistical property of CSMC is fully determined by its initial state and STK.
2.2 Construction of CSMC for wind speed
The key step of building the CSMC lies in the calculation of STK which can be obtained by the joint probability distribution due to its nature of being a conditional probability density.A new stochastic process Ztwith a standard normal marginal distribution is defined through a third-order polynomial normal transformation(PNT)according to(6)

where c0,c1,c2,c3polynomial coefficients.Ztis a standard normal random variable with mean 0 and deviation 1.
The sample of Ztcan be achieved by the inverse function of(6).In this paper,a dichotomy method is used to calculate the ztcorresponding to xt.The polynomialcoefficientsarecalculatedusingthe method proposed in reference[15].
Each variable at the time of t-m,m∈[-1,k-1]follows the same marginal distribution,namely standard normal distribution since they are from the same process Zt.Then,the k-dimensional random vector Z=(Zt-(k-1),…,Zt,Zt+1)can approximately be modeled using multivariate normal distribution which can be written in the following expression:

with k-dimensional means vector μ=(μt-(k-1),…,μt,μt+1)and k×k covariance matrix.
Based on the assumptions above,the joint probability density function can be achieved,and consequently the conditional probability density corresponding to the STK can be obtained.The conclusion from reference[16]states that the conditional distributions of each variable from multivariate normal distribution are also normal,that is

with mean μ and deviation σ2calculated by the following formulas,respectively
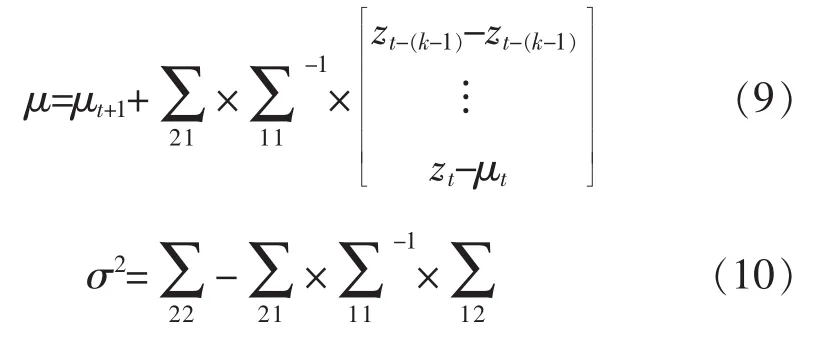
The STK of kth-order CSMC of the transformed data can be expressed as

The CSMC for wind speed can be obtained according to equation(5).
2.3 Monte Carlo simulation algorithm for CSMC
According to the analysis above,the algorithmic process for the generation of wind time series using kth-order CSMC is formulated as follows:
1)Transform the wind time series into the normal domain.
a)Calculate the polynomial coefficients of equation(6).
b)Calculate the ztcorresponding to xtusing dichotomy method.
2)Identify a CSMC model for time series Ztusing the sample zt.
3)Simulate a time series using the CSMC model.
a)Generate the initial values of random vector(Z1,…,Zk)as.
4)Back-transform the simulated time series using(6)into original domain;
The generated time series of{v′t;t=1,…,T}following the algorithm can satisfy the model(5).
3 Case Studies
3.1 Wind data information
The actual hourly wind speed time series from a wind monitoring station in China for six years were used to illustrate development and effectiveness of the proposed methodology.The wind time series were transformed to the hub height of 85 m[17].The probability plot is shown in Fig.1.Three-year data were used to training the model.
The transformation is performed by the third-order PNT according to(6).The one-sample Kolmogorov-Smirnov(K-S)test[16]is used to check the normality of transformed data.The result shows that Wtfollows normal distribution at the significance level 0.05(where test statistic D=0.0016 and critical value d0.05= 0.00812)
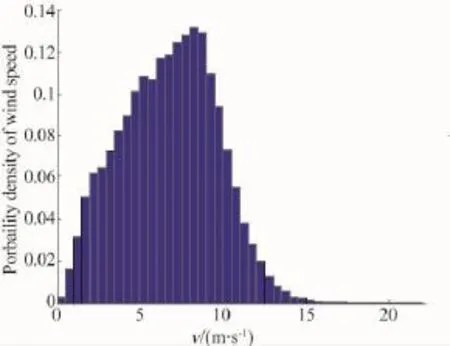
Fig.1 Wind speed frequency distribution
3.2 Wind simulation
A wind time series with the length of two hundred years is generated using the kth-order CSMC,where k=1,…,3.The two-sample K-S test is used to check whether the simulated and actual data come from the same distribution.The calculation results of test statistic at the significance level 0.05 are shown in Table 1.
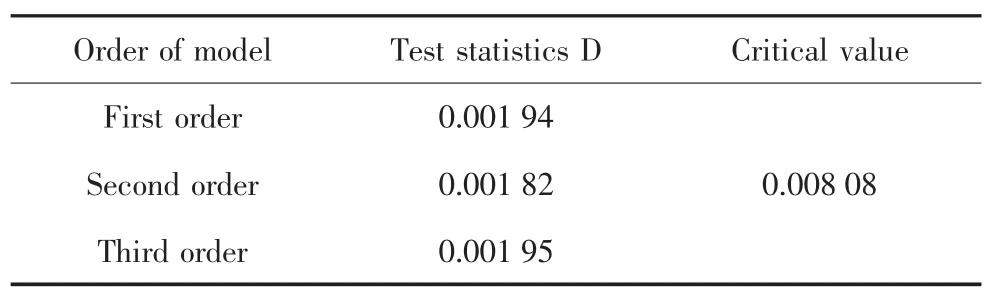
Table1 Test statistic of simulated wind
It can be seen from Table 1 that the test statistics for the model with different orders are smaller than the critical value which means that the simulated and actual wind time series are from the same distribution. The test statistics for the model with different orders have minor difference.A further analysis shows that the test statistics converge,when a longer simulation time is used.
The acf of the actual wind time series and simulated ones using the CSMC with different orders are shown in Fig.2.It illustrates that the acf of the generated time series can only match the one of the actual data for particular period.The models of second order and third order outperform these of first and fourth order for a longer lag time.Then,the second order model can be used to simulate the wind time series.

Fig.2 Autocorrelation plot of simulations using CSMC with different orders
3.3 Comparison between models
The proposed methodology in this paper is compared with the MCMC.A statisticis used as the judgment criteria of fit to observations.The higheris,the greater the fit is.The calculation method ofcan refer to Ref.[18].The calculation results are shown in Table 2.
Table2 Results ofwith different models
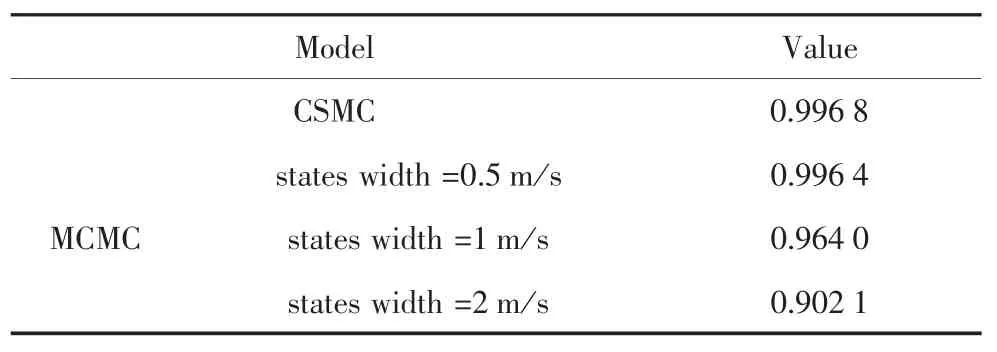
Table2 Results ofwith different models
ModelValue CSMC0.996 8 states width=0.5 m/s MCMCstates width=1 m/s0.964 00.996 4states width=2 m/s0.902 1
It can be observed from Table 2 that the proposed model gives a good fit for the probability distribution while accuracy of the MCMC changed with the number of states.It indicates that the number of states has great influence on model accuracy.A small number of states may bring about the loss of information while larger state numbers make the model complex.
The acf of the actual wind time series and simulated ones using the CSMC and MCMC is shown in Fig.3.It can be found that the CSMC and MCMC present a same capability to keep the acf of actual data.
The same analysis was performed for data from a wind monitoring station in China.The conclusions from this case are consistent with that above.

Fig.3 Autocorrelation plot of simulations using CSMC model and MCMC model
4 Application of CSMC in Generating System Reliability Evaluation
The IEEE-RTS used in this paper consists of 32 traditional generating units.The total installed capacity of the IEEE-RTS is 3 405 MW and the system peak load is 2 850 MW.The detailed generating unit ratings,reliability parameters and load data are given in reference[19].
To quantitatively assess the impacts of the wind power on system reliability,the IEEE-RTS was modified to create a system designated as the Combined Test System(CTS)by the addition of a wind farms with the capacity 400MW.The cut-in,rated,and cutoff wind speed of wind turbine generators are 3.3 m/s,10.6 m/s,and 22.2 m/s,respectively.
The reliability analysis on the system is conducted using state-sampling simulation method combing with the measured wind data,MCMC model and CSMC model,respectively.Here,the MCMC model is divided into 56 states with states width of 0.5 m/s.
The reliability indices of the CTS calculated using Sequential Monte Carlo simulation are shown in Table 3.
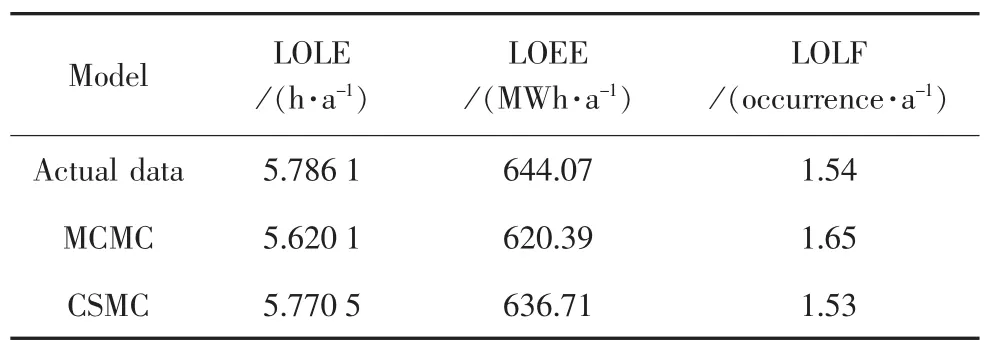
Table3 Reliability indices for the CTS
It can be seen from Table 3 that the reliability indices calculated by the proposed model are more close to those calculated by the measured data.
The investigation indicates that the proposed model has higher accuracy compared with the parametric models,and can be directly applied in reliability evaluation of power system containing wind energy.
5 Conclusions
We contribute to a methodology aimed at the simulation of wind speed time series based on polynomial normal transformation and continuous state markov chain.The method modeling wind time series in continuous state space can avoid the loss of information during discretization process and decrease the computation complexity.
The proposed model can reproduce the probability distribution accurately and moreover the accuracy has nothing to do with the order of the model.The model also can fit the acf in certain time scale with satisfactorily accuracy.
References
[1]S.Teleke,M E.Baran,A.Huang,et al.Control strategies for battery energy storage for wind farm dispatching,IEEE Trans. Energy Convers.,2009,24(3):725-732.
[2]R.Billinton,B.Guang.Generating Capacity adequacy associated with wind energy,IEEE Trans.Energy Convers.,2004,19(3):641-646.
[3]B.Klockl.Multivariate time series models applied to the assessment of energy storage in power systems.IEEE PMAPS Conf 2008.
[4]D.Jakus,R.Goic,J.Krstulovic.The impact of wind power plants on slow voltage variations in distribution networks,Electric Power Systems Research,2010,81(2):589-598.
[5]H.Yang,K..Xie,H.Tai,et al.Wind farm layout optimization and its application to power system reliability analysis.IEEE Transactions on Power Systems,2016,31(3):2 135-2 143.
[6]R.Billinton,H.Chen,R.Ghajar.Time-series models for reliability evaluation of power systems including wind energy,Microelectron.Reliab.,1996,31(9):1 253-1 261.
[7]P.Chen,T.Pedersen,B.Bak-Jensen,et al.ARIMA-based time series model of stochastic wind power generation,IEEE Trans.Power Syst.,2010,25(2):667-676.
[8]G.Papaefthymiou,B.Klo..ckl.MCMC for wind power simulation,IEEE Trans.Energy Convers.,2008,23(1):234-240.
[9]E.F.Youcef,H.Sauvageot,A.E.H.Adane.Statistical bivariate modeling of wind using rst order Markov chain and Weibull distribution.Renew.Energy,2003,28(11):1 787-1 802.
[10]Nfaoui H.,Essiarab H.,Sayigh A.A.M.A stochastic Markov chain model for simulating wind speed time series at Tangiers,Morocco,Renew.Energy,2004,29(8):1 407-1 418.
[11]F.Zhou,L.Jin,B.Wang,Z.Zhang.analysis of wind power forcasting perfomence based on high-order markov chain models,Power System Portection and Control,2012,40(6):6-10.
[12]K.Brokish,J.Kirtley.Pitfalls of modeling wind power using Markov chains,in 2009 Power Systems Conference and Exposition,PSCE'09.
[13]R.Goi,J.Krstulovi,D.Jakus.Simulation of aggregate wind farmshort-termproductionvariations,Renew.Energy,2010,35(11):2 602-2 609.
[14]W.Ching,K.N.Michael.Markov chains:models,algorithms and applications.New York:Springer,2006.
[15]D.Cai,D.Shi,J.Chen.Probabilistic load flow computation with polynomial normal transformation and Latin hypercube sampling. IET Gener.Transm.Distrib.,2013,7(5):474-482.
[16]T.W Anderson.An Introduction to Multivariate Statistical Analysis,2nd Edition.New York:John Wiley&Sons,Inc,2003.
[17]J.A.Carta,P.Ramírez,S.Velazquez.A review of wind speed probability distributions used in wind energy analysis Case studies in the Canary Islands.Renew.Sustain.Energy Rev.,2009,13(5):933-955.
[18]E.Firtin,O.Guler,S.A.Akdag.Investigation of wind shear coefficients and their effect on electrical energy generation,Applied Energy,2011,88(11):4 097-4 105.
[19]D.J.Sheskin,Handbook of Parametric and Non-parametric Statistical Procedures,3rd Edition.Boca Raton:Chapman&Hall/CRC,2003.
Accepted date:2016-08-16
Sun Yuntao(1985),received his M.S degree in High Voltage and Insulation Technology from NCEPU in 2010.His current research direction is power system analysis and relay protection technology.
风速时序仿真模型及其在发电系统可靠性评估中的应用
孙运涛,王军,赵斌超,史方芳
(国网山东省电力公司电力科学研究院,济南250003)
风速模拟在风电领域相关研究中具有重要的应用。基于多项式正态变换和连续状态马尔科夫链技术,提出了一种时序风速的模拟方法。该方法首先利用多项式正态变换方法将原始数据变换为服从正态分布的数据;然后利用连续状态马尔科夫链描述变换后数据的随机波动过程;最后,通过正态逆变换获得模拟产生的风速数据。实际风速数据验证表明,模型能够较好地保持原始风速数据的概率分布特性和短期相依特性。将该模型应用于IEEE-RTS可靠性测试系统,结果表明模型可进行含风能的电力系统可靠性评估。
风速模拟;连续马尔科夫链;多项式正态变换;可靠性评估
TM614
A
1007-9904(2016)11-0005-06