Barotropic Processes Associated with the Development of the Mei-yu Precipitation System
2016-12-07TingtingLIandXiaofanLI
Tingting LI and Xiaofan LI
School of Earth Sciences,Zhejiang University,Hangzhou 310027
Barotropic Processes Associated with the Development of the Mei-yu Precipitation System
Tingting LI and Xiaofan LI∗
School of Earth Sciences,Zhejiang University,Hangzhou 310027
The barotropic processes associated with the development of a precipitation system are investigated through analysis of cloud-resolving model simulations of Mei-yu torrential rainfall events over eastern China in mid-June 2011.During the model integration period,there were three major heavy rainfall events:9–12,13–16 and 16–20 June.The kinetic energy is converted from perturbation to mean circulations in the first and second period,whereas it is converted from mean to perturbation circulations in the third period.Further analysis shows that kinetic energy conversion is determined by vertical transport of zonal momentum.Thus,the prognostic equation of vertical transport of zonal momentum is derived,in which its tendency is associated with dynamic,pressure gradient and buoyancy processes.The kinetic energy conversion from perturbation to mean circulations in the first period is mainly associated with the dynamic processes.The kinetic energy conversion from mean to perturbation circulations in the third period is generally related to the pressure gradient processes.
tropical cyclone–trough interaction,upper troposphere,eddy momentum flux convergence
1.Introduction
Barotropic processes represent one of the most important physical process types in the development of precipitation systems.They are described by the kinetic energy conversion between the mean background circulations and perturbation(secondary)circulations associated with vapor condensation and deposition for the production of precipitation. Such kinetic energy conversion is primarily determined by vertical transport of horizontal momentum acting on vertical shear of the mean background horizontal winds(e.g.,Pastushkov,1975).Barotropic processes may affect the development of precipitation systems through the vertical wind shear of background circulations(e.g.,Corbosiero and Molinari, 2002;Langet al.,2007;Ueno,2007).The verticalwindshear may have impacts on the timing of convection(Xu et al., 1992),the organization of convection(Robe and Emanuel, 2001)and rainfall(e.g,Wang et al.,2009;Shen et al.,2011).
Severe floodsand associated naturaldisasters occurin the Mei-yu season as torrential rainfall frequently occurs over the middle and lower reaches of the Yangtze River during the early season of the NH summer.Zhai et al.(2014)conductedacloud-resolvingmodelstudyofa Mei-yuheavyrainfall event that occurred over eastern China in mid-June 2011. During the modeling period,there were three major rainfallevents,and they found differences in rainfall types and horizontal scale between the three periods.Wu and Yanai(1994) revealed the effects of vertical wind shear on the development of a precipitation system through the change in vertical transport of horizontal momentum.But does vertical wind shear determinebarotropickinetic energyconversiondirectly throughthe changein verticaltransportofhorizontalmomentum?And which physicalprocesses controlvertical transport of horizontal momentum?
The objective of this study is to examine the barotropic processes associated with the Mei-yu precipitation system throughanalysisofthedifferencesinbarotropicprocessesbetween three rainfall events using the Mei-yu simulation data from Zhai et al.(2014).The model,large-scale forcing,and sensitivity experimentsare briefly describedin section 2.The results are presented in section 3.A summary is given in section 4.
2.Model and experiments
The experiment analyzed in this study was conducted by Zhai et al.(2014)using the 2D version of a cloud-resolving model(Table 1).The model was integrated with imposed large-scale forcing from 0800 LST 9 June to 0800 LST 20 June 2011.The forcing was averaged in a rectangular box of(30◦–31◦N,114◦–122◦E)using NCEP/GDAS data.There are three upward motion centers while westerly winds pre-vail(Zhai et al.,2014,Fig.1).The three torrential rainfall events are forced by the three upward motion centers during the model integration period(Fig.1).The rainbands are better organized in the third rainfall event than in the two previous rainfall events,while the second rainfall event occupies a larger area than the two other rainfall events.Thus, the model integration period is divided into the three subperiods:0800 LST 9 June to 0000 LST 13 June(the first period);0000LST 13Juneto 1200LST 16June(thesecondperiod);and 1200 LST 16 June to 0800 LST 20 June(the third period).Thelarge-scaleforcingis averagedforthethreeperiods and shown in Fig.2.The averaged vertical profiles show that westerly winds generally increase with increasing height (Fig.2a).Near the surface,averaged zonal winds are zero in the first period and weak easterly winds in the two other periods.In the upper troposphere,the westerly winds in the first period are stronger than in the third period,whereas they are weaker in the second period.The averaged upward motions prevail in the troposphere and reach their maxima around 8 km(Fig.2b).Below 10 km,the averaged upward motions in the third period are stronger than in the first period,but they are weaker than in the second period.Above 10 km,the averaged upward motions in the first period are stronger than in the third period,but they are weaker than in the second period.The averaged rain rates are 0.98 mm h-1in the first period,1.38 mm h-1in the second period,and 1.17 mm h-1in the third period.The rainfall is stronger in the second period than in the two other periods due to stronger upward motions in the second period.The rain rate is about 20%higher in the thirdperiodthan in the first period,while the upwardmotions are only slightly stronger in the third period.The difference in vertical wind shear implies barotropic effects on Mei-yu rainfall.
©Institute of Atmospheric Physics/Chinese Academy of Sciences,and Science Press and Springer-Verlag Berlin Heidelberg 2016
3.Results
Following Li et al.(2002b),barotropic conversion between the mean kinetic energy to perturbation kinetic energy can be symbolically expressed by the sum of Cu(K,K′)and Cw(K,K′),where

and

in which u and w are the zonal and vertical components of wind,respectively;an overbar indicates the model domain mean;a prime indicates a perturbation from the model domain mean;the subscriptois an imposed value from NCEP/ GDAS;[·]=Rztzbρ·dz andρis height-dependent air density,ztand zbare the heights of the top and the bottom of the model atmosphere,respectively.Cu(K,K′)andCw(K,K′) are the barotropic conversions between the mean domain mean kinetic energy(K)and K′,respectively,through verticaltransportofzonalmomentumactingontheverticalshear of imposed horizontal-mean zonal wind,and vertical transport of vertical momentumacting on the vertical shear of imposed horizontal-mean vertical velocity.Since the calculations from Wang et al.(2009)and Shen et al.(2011)indicate Cw(K,K′)is negligible,the barotropic conversion from the mean kinetic energy to perturbation kinetic energy term can be simplified to

Fig.1.Time–zonal distributionof simulatedsurfacerainfall rate (mm h-1).

To examine the contribution from height-dependent kinetic energy conversion to Cu(K,K′),we calculate the vertical profile of barotropic kinetic energy conversion(BKEC), which can be written as:

Here,BECK1 is the vertical difference in zonal wind,and BKEC2 is the air density weighted covariance between perturbationzonalwindandverticalvelocityorverticaltransport of zonal momentum.Cu(K,K′)is calculated by vertically integrating BKEC or addingBKEC for all vertical layers in our calculations.
The calculations of BKEC show that the BKEC is generally negative in the troposphere in the first period(Fig.3a). In the second period,the BKEC is positive below 4 km but negative above 4 km(Fig.3b).The BKEC is generally positive from 1 to 9 km(Fig.3c).Since negative and positiveBKEC values indicate kinetic energy conversion from perturbation to mean circulation and from mean to perturbation circulation,respectively,the positive BKEC value denotes a dynamically unstable system and the negative BKEC value represents a dynamically stable system.Thus,the precipitation system is dynamically stable in the first and second periods and dynamically unstable in the third period.

Fig.2.Vertical profiles of(a)zonal wind(m s-1)and(b)vertical velocity(cm s-1)averaged from 0800 LST 9 June to 0000 LST 13 June(red),from 0000 LST 13 June to 1200 LST 16 June(green)and from 1200 LST 16 June to 0800 LST 20 June(blue).
The BKEC is associated with the vertical shear of imposedzonalwind(BKEC1)andtheverticaltransportofzonal momentum(BKEC2),which are time-dependent.Thus,the time-mean BKEC(BKEC hereafter)can be decomposedinto the two components

and

where BKEC1Mand BKEC2Mare the time averages of BKEC1 and BKEC2,respectively,and BKEC1Tand BKEC2Tare the deviations of BKEC1 and BKEC2 from BKEC1Mand BKEC2M,respectively.In general,BKECMis out of phase with BKECTvertically.BKECMis negative but BKECTis positive through the troposphere in the first period (Fig.3a).BKEC is controlled by BKECM.In the second period,BKECMis negative from 2 to 8 km(Fig.3b).BKECTis negative above 7 km,whereas it is positive below 7 km. The negative BKEC is associated with the negative BKECTabove8 km and BKECMfrom 4 to 8 km.The positive BKEC corresponds to the positive BKECTbelow 4 km.In the third period,BKECMis positive throughout the troposphere(Fig. 3c).BKECTis negative above 5 km but it is positive below 5 km.The positive BKEC is determined by the positive BKECM.

Fig.3.Vertical profiles of barotropic kinetic energy conversion (BKEC;black)and its components(BKECM,red;BKECT, blue)averaged(a)from 0800 LST 9 June to 0000 LST 13 June, (b)from 0000 LST 13 June to 1200 LST 16 June,and(c)from 1200 LST 16 June to 0800 LST 20 June.Units:105J s-1.
Since BKEC is controlled by BKECM,the time-mean BKEC1 and BKEC2 are analyzed(Fig.4).The imposed zonal winds increase with increasing height in the three periods(Fig.4a).The time-mean vertical wind shear(BKEC1) barely changes in the first period.The time-mean vertical wind shear is similar in the second and third period,except that the vertical wind shear is decreased to zero around 12 km in the second period but around10 km in the third period. Inthesecondandthirdperiod,theverticalwindshearreaches its peak near the surface,reduces in magnitude around 4 km, and reaches a sub-peak at around 8 km.Since the timemean vertical wind shear has the same sign in all three periods,the differences in BKECMbetween the three periods are attributable to the differences in BKEC2.The timemean BKEC2 changes from negative values(upward zonalmomentum transport)in the first and second period to positive values(downward zonal-momentum transport)in the thirdperiod,throughasignificantincreaseinpositiveBKEC2 from the first and second period to the third period(Fig.4b). Thus,the dynamic stability(BKECM)of the precipitation system is determined by BKEC2 in this Mei-yu precipitation system.
TofurtherinvestigateiftheverticalwindsheardirectlyaffectstheBKEC2,orthroughwhichphysicalfactorsifthevertical wind shear indirectly affects the BKEC2,the tendency equation of BKEC2 is derived from the perturbationmomentum equations.Following Li et al.(2002b),the perturbation momentum equations in the 2D cloud-resolving model can be written by:


Fig.4.Vertical profiles of(a)imposed zonal-wind difference in the vertical layer(duo;BKEC1;m s-1)and(b)air density weightedcovariance between perturbation zonal windandvertical velocity(-ρu′w′;BKEC2;105J m-1;solid lines)averaged from 0800 LST 9 June to 0000 LST 13 June(black),from 0000 LST 13 June to 1200 LST 16 June(red),and from 1200 LST 16 June to 0800 LST 20 June(blue).In(b),BKEC2 is broken into components for u′w′>0(long-dashed line)and u′w′<0 (short-dashed line).
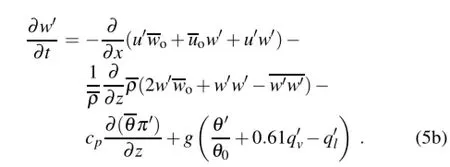
Here,θis potential temperature,andθ0is initial potential temperature;π=(p/po)κandκ=R/cp;R is the gas constant;cpis the specific heat of dry air at constant pressure p, where po=1000 hPa;qvis specific humidity;and qlis the sum of the mixing ratios of cloud water,raindrops,cloud ice, snow and graupel.
Multiplying Eq.(5a)by-ρw′and Eq.(5b)by-ρu′, adding the equations nd taking the model domain mean,the tendency equation of BKEC2(BKEC2t)can be expressed by

where∂


and

Here,BKEC2d,BKEC2pand BKEC2bare the contributors to BKEC2tfrom the processes related to dynamics,the pressure gradient and buoyancy force,respectively.BKEC2bcan be further partitioned into three terms:

The tendency budget of BKEC2 is integrated with time and each term in the budget has a contribution to BKEC2. BKEC2pis largelybalancedby BKEC2din the three periods, indicating the dominance of the processes related to dynamics andthe pressuregradientin determiningBKEC2.BKEC2 is at least three orders of magnitude smaller than these dominant terms.Negative values of BKEC2 correspond mainly to those of BKEC2dbelow 8 km and BKEC2pabove 8 km in the first period(Fig.5a),and those of BKEC2dabove 4 km and BKEC2pbelow 4 km in the second period(Fig.5b).The magnitudes of BKEC2dand BKEC2pdecrease from the first and second periods to the third period(Fig.5c).In the third period,positive values of BKEC2 are mainly associated with those of BKEC2pin the lower and upper troposphere and BKEC2din the mid troposphere.BKEC2b1and BECK2b2contribute to negative values of BKEC2 in the first and second periods,whereas BKEC2b2contribute to positive values of BKEC2 in the third period.
4.Summary
The barotropic processes associated with the development of a Mei-yu precipitation system are investigated through analysis of conversion between perturbation and mean kinetic energy.The data analyzed are from a 2D cloud-resolving model simulation of three Mei-yu torrential rainfall events that occurred over eastern China in mid-June 2011.The calculations of barotropic kinetic energy conversion show that the precipitation system is dynamically stable (with conversion from perturbation to mean kinetic energy) throughoutthetroposphere,turnsto beweaklyunstableinthe mid and lower troposphere,and eventually becomes dynamically unstable(with conversion from mean to perturbation kinetic energy)throughout the troposphere.

Fig.5.Vertical profiles of BKEC2(black)and associated contribution from BKEC2d(red),BKEC2p(purple),BKEC2b1(green),BKEC2b2(blue)and BKEC2b3(orange)in the BKEC2 budget averaged(a)from 0800 LST 9 June to 1200 LST 10 June,(b)from 0000 LST 13 June to 0000 LST 15 June,and (c)from 1200 LST 16 June to 1500 LST 18 June.Units:105J m-1.
The vertical wind shear in the simulation period is increased in imposed zonal winds upward,and the magnitude increases in the mid and lower troposphere from the first period to the second period and barely changes from the second period to the third period.The barotropic conversion is determined by vertical transport of zonal momentum acting on the vertical shear of imposed mean zonal wind.Since the upward increase in zonal winds is imposed during the model integration period,the barotropic conversion is controlled by the vertical transport of zonal momentum(vertical zonal-momentum flux or covariance between perturbation zonal wind and vertical velocity).The zonal-momentum flux is changed from upward in the first and second period to downwardin the thirdperiod,which leads to the changefrom a dynamically stable system in the first and second period to a dynamically unstable system in the third period.
An equation for predicting the vertical transport of zonal momentum is derived based on prognostic equations of perturbation zonal wind and vertical velocity.The tendency of vertical momentum flux is associated with the processes related to dynamics,the pressure gradient and buoyancy force. The budget analysis of vertical momentum flux reveals that the buoyancyterm and pressure gradientterm are largely balanced and barotropic stability is mainly related to dynamic processes,whereas barotropic instability is generally associated with the processes related to the pressure gradient.
Since only one torrential rainfall event is analyzed and the cloud-resolving model used is 2D,a 3D model is neededto study different torrential rainfall cases in various climate regimes to validate the results of this study.
Acknowledgements.The authors thank W.-K.TAO at NASA/ GSFC for his cloud-resolving model,and the two anonymous reviewers for their constructive comments.This work was supported by the National Natural Science Foundation of China(Grant No. 41475039)and National Key Basic Research and Development Project of China(Grant No.2015CB953601).
REFERENCES
Chou,M.-D.,and M.J.Suarez,1994:An efficient thermal infrared radiation parameterization for use in general circulation model.Vol.3,NASA Tech.Memo.104606,85 pp. [Available online at NASA/Goddard Space Flight Center, Code 913,Greenbelt,MD 20771.]
Chou,M.-D.,D.P.Kratz,and W.Ridgway,1991:Infrared radiation parameterizations in numerical climate models.J.Climate,4,424–437.
Chou,M.-D.,M.J.Suarez,C.-H.Ho,M.M.-H.Yan,and K.-T.Lee,1998:Parameterizations for cloud overlapping and shortwave single-scattering properties for use in general circulationand cloudensemble models.J.Climate,11,202–214.
Corbosiero,K.L.,and J.Molinari,2002:The effects of vertical wind shear on the distribution of convection in tropical cyclones.Mon.Wea.Rev.,130,2110–2123.
Gao,S.T.,and X.F.Li,2008:Cloud-Resolving Modeling of Convective Processes.Springer,206 pp.
Krueger,S.K.,Q.Fu,K.N.Liou,and H.-N.S.Chin,1995:Improvements of an ice-phase microphysics parameterization for use in numerical simulations of tropical convection.J. Appl.Meteor.,34,281–287.
Lang,S.,W.-K.Tao,J.Simpson,R.Cifelli,S.Rutledge,W.Olson, and J.Halverson,2007:Improving simulations of convective systems from TRMM LBA:Easterly and westerly regimes.J. Atmos.Sci.,64,1141–1164.
Li,X.F.,and S.T.Gao,2012:Precipitation Modeling and Quantitative Analysis.Springer,Dordrecht,240 pp.
Li,X.F.,C.-H.Sui,K.-M.Lau,and M.-D.Chou,1999:Largescale forcing and cloud-radiation interaction in the tropical deep convective regime.J.Atmos.Sci.,56,3028–3042.
Li,X.F.,C.-H.Sui,and K.-M.Lau,2002a:Dominant cloud microphysical processes in atropical oceanic convective system: A 2D cloud resolving modeling study.Mon.Wea.Rev.,130, 2481–2491.
Li,X.F.,C.-H.Sui,and K.-M.Lau,2002b:Interactions between tropical convection and its embedding environment:an energetics analysis of a 2D cloud resolving simulation.J.Atmos. Sci.,59,1712–1722.
Lin,Y.-L.,R.D.Farley,and H.D.Orville,1983:Bulk parameterization of the snow field in a cloud model.J.Climate Appl. Meteor.,22,1065–1092.
Pastushkov,R.S.,1975:The effects of vertical wind shear on the evolution of convective clouds.Quart.J.Roy.Meteor.Soc., 101,281–291.
Robe,F.R.,and K.A.Emanuel,2001:The effect of vertical wind shear on radiative-convective equilibrium states.J.Atmos.Sci.,58,1427–1445.
Rutledge,S.A.,and P.Hobbs,1983:The mesoscale and microscale structure and organization of clouds and precipitation in midlatitude cyclones.VIII:A model for the“seederfeeder”process in warm-frontal rainbands.J.Atmos.Sci.,40, 1185–1206.
Rutledge,S.A.,and P.V.Hobbs,1984:The mesoscale and microscalestructureandorganizationof cloudsandprecipitation in midlatitude cyclones.XII:A diagnostic modeling study of precipitation development in narrow cold-frontal rainbands. J.Atmos.Sci.,41,2949–2972.
Shen,X.Y.,Y.Wang,and X.F.Li,2011:Effects of vertical wind shear and cloud radiative processes on responses of rainfall to the large-scale forcing during pre-summer heavy rainfall over southern China.Quart.J.Roy.Meteor.Soc.,137,236–249.
Soong,S.-T.,and Y.Ogura,1980:Response of tradewind cumuli to large-scale processes.J.Atmos.Sci.,37,2035–2050.
常规CKF算法采样点均是系统状态向量维数的2倍。对于导航、目标跟踪等特殊非线性模型,可以发现,影响系统非线性的只是其状态向量的部分元素,引起线性Kalman滤波算法无法使用,而只能使用非线性滤波算法。例如针对式(1)的EKF算法中,其量测矩阵H中,只有1,4,7列针对位置的偏导数不为零,而2,3,5,6,8,9列针对速度、加速度的偏导数均为零。因此在增益计算中:
Soong,S.-T.,and W.-K.Tao,1980:Response of deep tropical cumulus clouds to mesoscale processes.J.Atmos.Sci.,37, 2016–2034.
Sui,C.H.,K.M.Lau,W.K.Tao,and J.Simpson,1994:The tropical water and energy cycles in a cumulus ensemble model. Part I:equilibrium climate.J.Atmos.Sci.,51,711–728.
Sui,C.-H.,X.Li,and K.-M.Lau,1998:Radiative-convective processes insimulated diurnal variations of tropical Oceanic convection.J.Atmos.Sci.,55,2345–2357.
Tao,W.-K.,and J.Simpson,1993:The Goddard cumulus ensemble model.Part I:model description.Terrestrial Atmospheric and Oceanic Sciences,4,35–72.
Tao,W.-K,J.Simpson,and M.McCumber,1989:An ice-water saturation adjustment.Mon.Wea.Rev.,117,231–235.
Ueno,M.,2007:Observational analysis and numerical evaluation of the effects of vertical wind shear on the rainfall asymmetry in the typhoon inner-core region.J.Meteor.Soc.Japan,85, 115–136.
Wu,X.Q.,and M.Yanai,1994:Effects of vertical wind shear on the cumulus transport of momentum:Observations and parameterization.J.Atmos.Sci.,51,1640–1660.
Xu,K.-M.,A.Arakawa,and S.K.Krueger,1992:The macroscopic behavior of cumulus ensembles simulated by a cumulus ensemble model.J.Atmos.Sci.,49,2402–2420.
Zhai,G.Q.,X.F.Li,P.J.Zhu,H.F.Shen,and Y.Z.Zhang,2014: Surface rainfall and cloud budgets associated withmei-yu torrential rainfall over eastern China during June 2011.Adv.Atmos.Sci.,31,1435–1444,doi:10.1007/s00376-014-3256-7.
Li,T.T.,and X.F.Li,2016:Barotropic processes associated with the development of the Mei-yu precipitation system.Adv.Atmos.Sci.,33(5),593–598,
10.1007/s00376-015-5146-z.
15 June 2015;revised 3 November;accepted 9 November 2015)
∗Xiaofan LI
Email:xiaofanli@zju.edu.cn
猜你喜欢
杂志排行

Advances in Atmospheric Sciences的其它文章
- Analyses and Forecasts of a Tornadic Supercell Outbreak Using a 3DVAR System Ensemble
- Comparison of a Very-fine-resolution GCM with RCM Dynamical Downscaling in Simulating Climate in China
- Evaluation of Atmosphere–Land Interactions in an LES from the Perspective of Heterogeneity Propagation
- Mesoscale Numerical Simulation Study of Warm Fog Dissipation by Salt Particles Seeding
- Impact of Atmospheric and Oceanic Conditions on the Frequency and Genesis Location of Tropical Cyclones over the Western North Pacific in 2004 and 2010
- Upper-Tropospheric Environment–Tropical Cyclone Interactions over the Western North Pacific:A Statistical Study